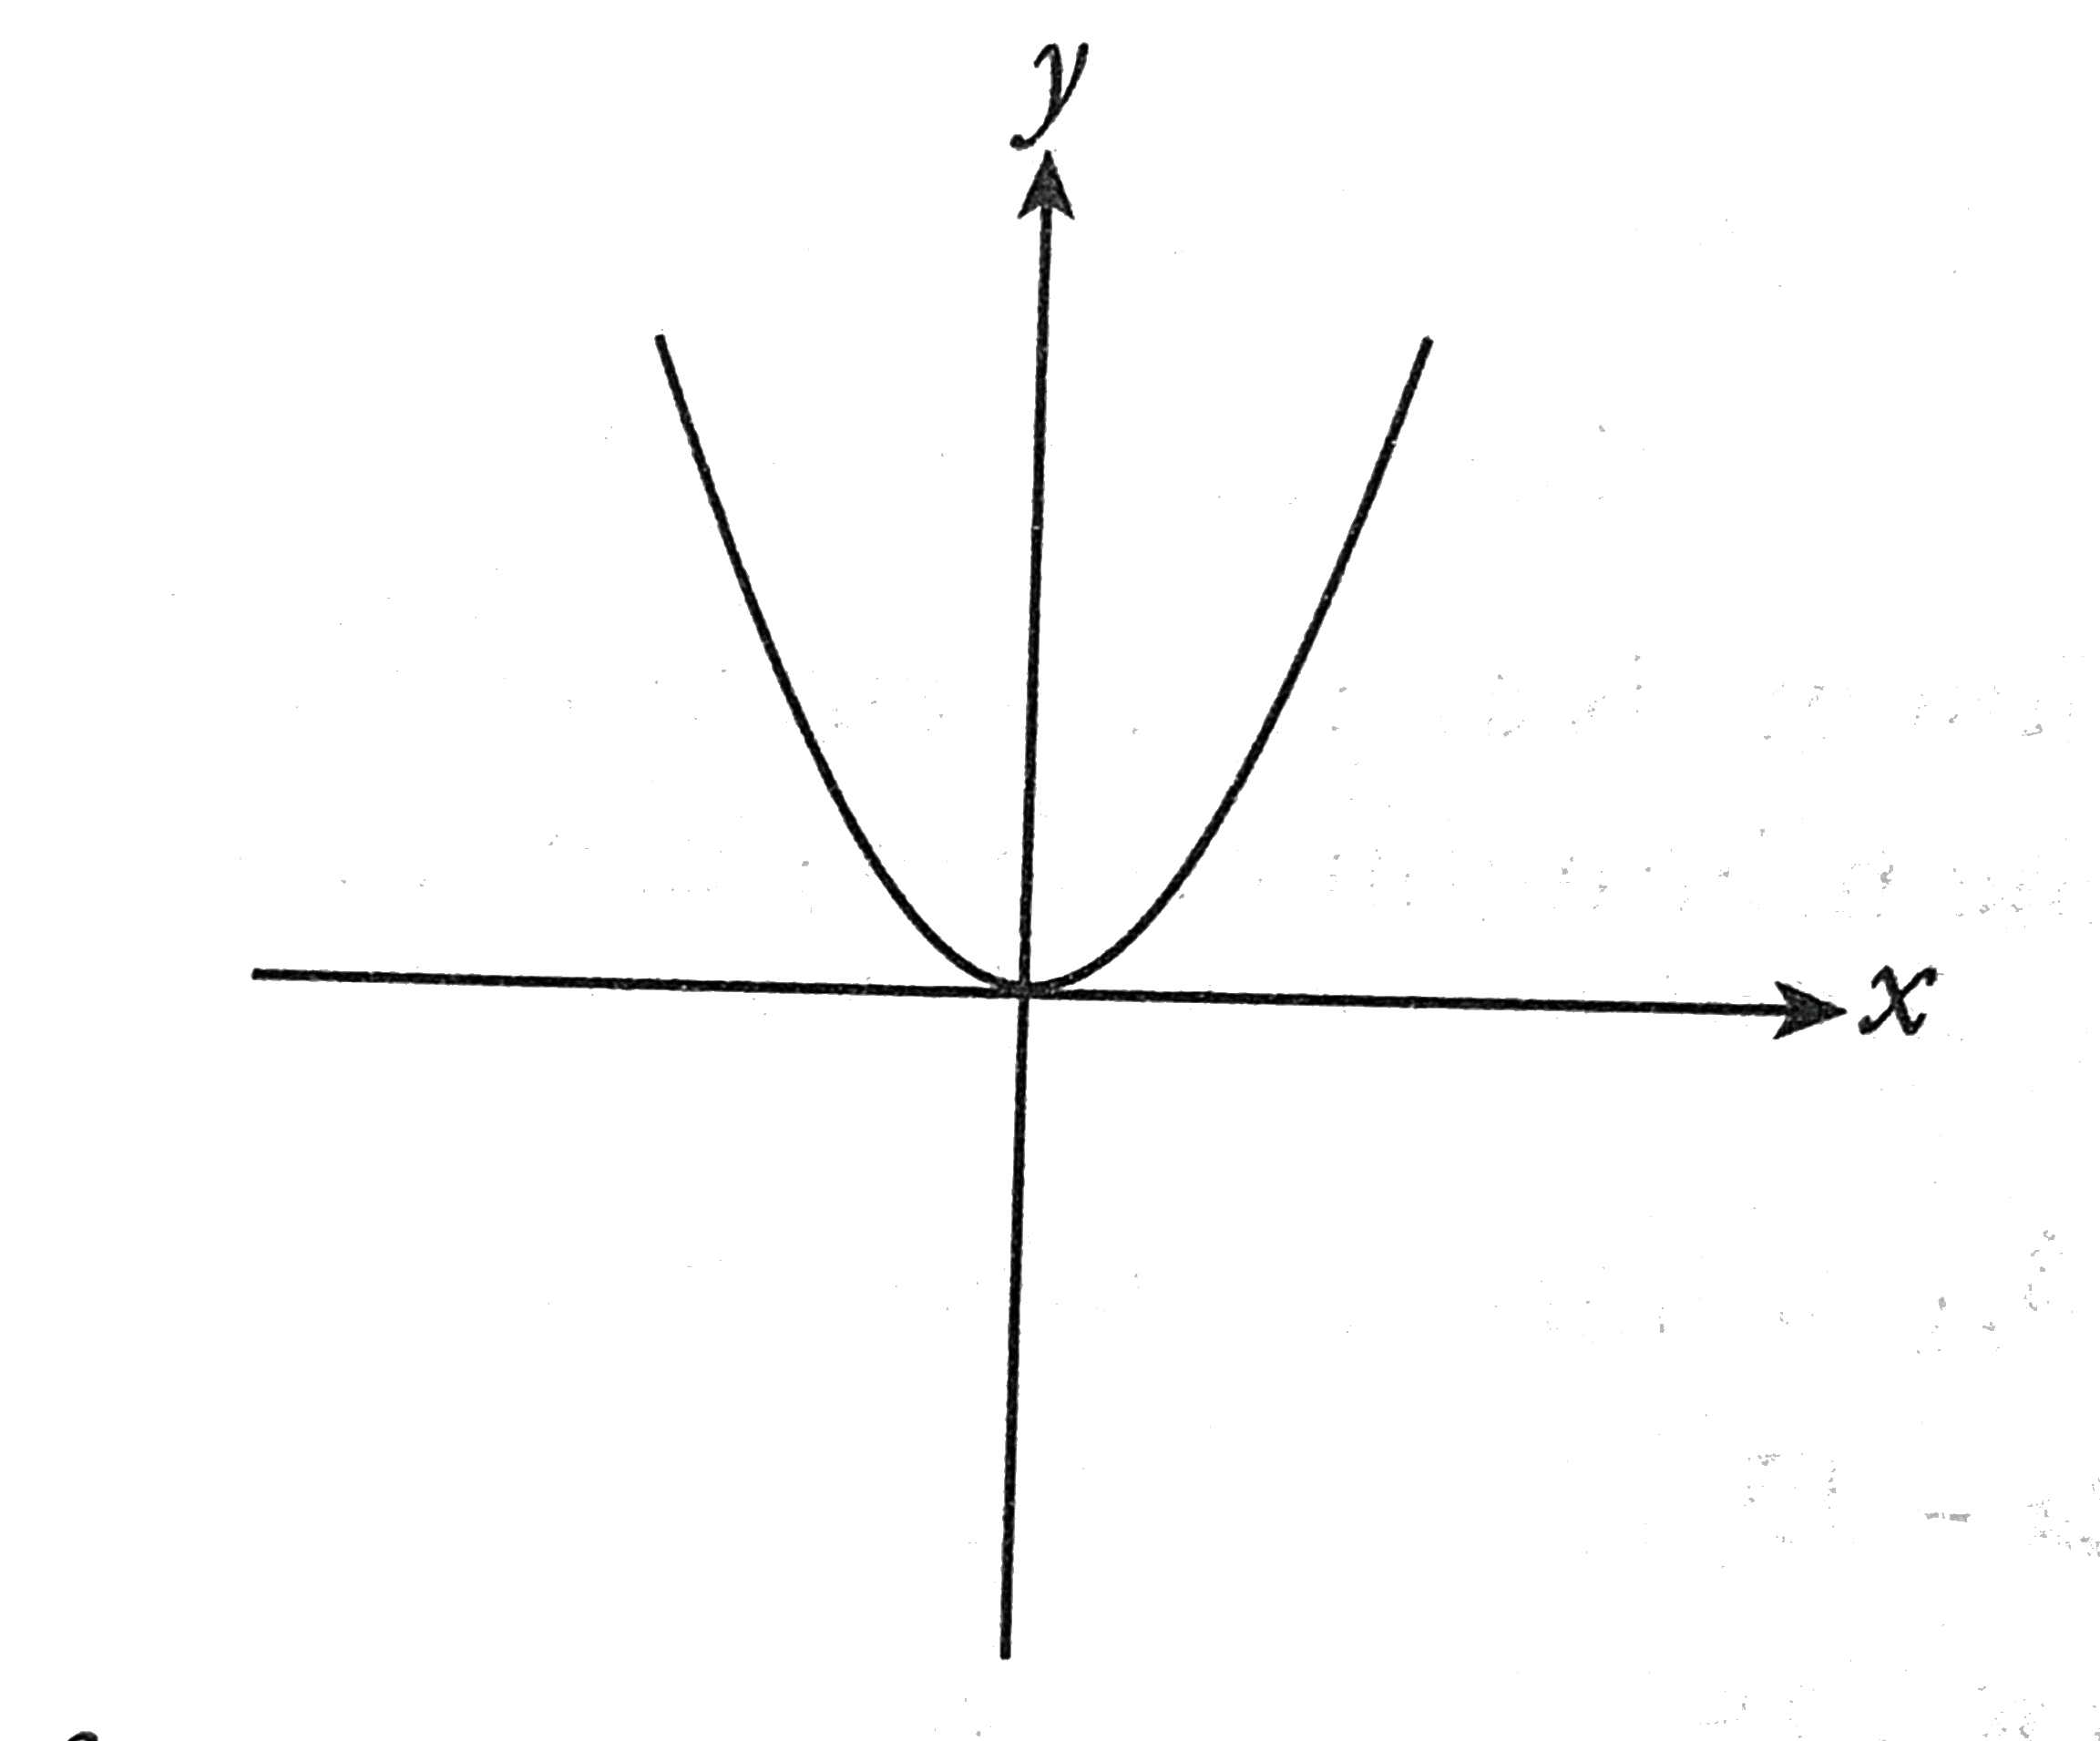
The quadratic y=f(x) is shown above. Which of the following graphs represents the function y=f(x+3)−4?
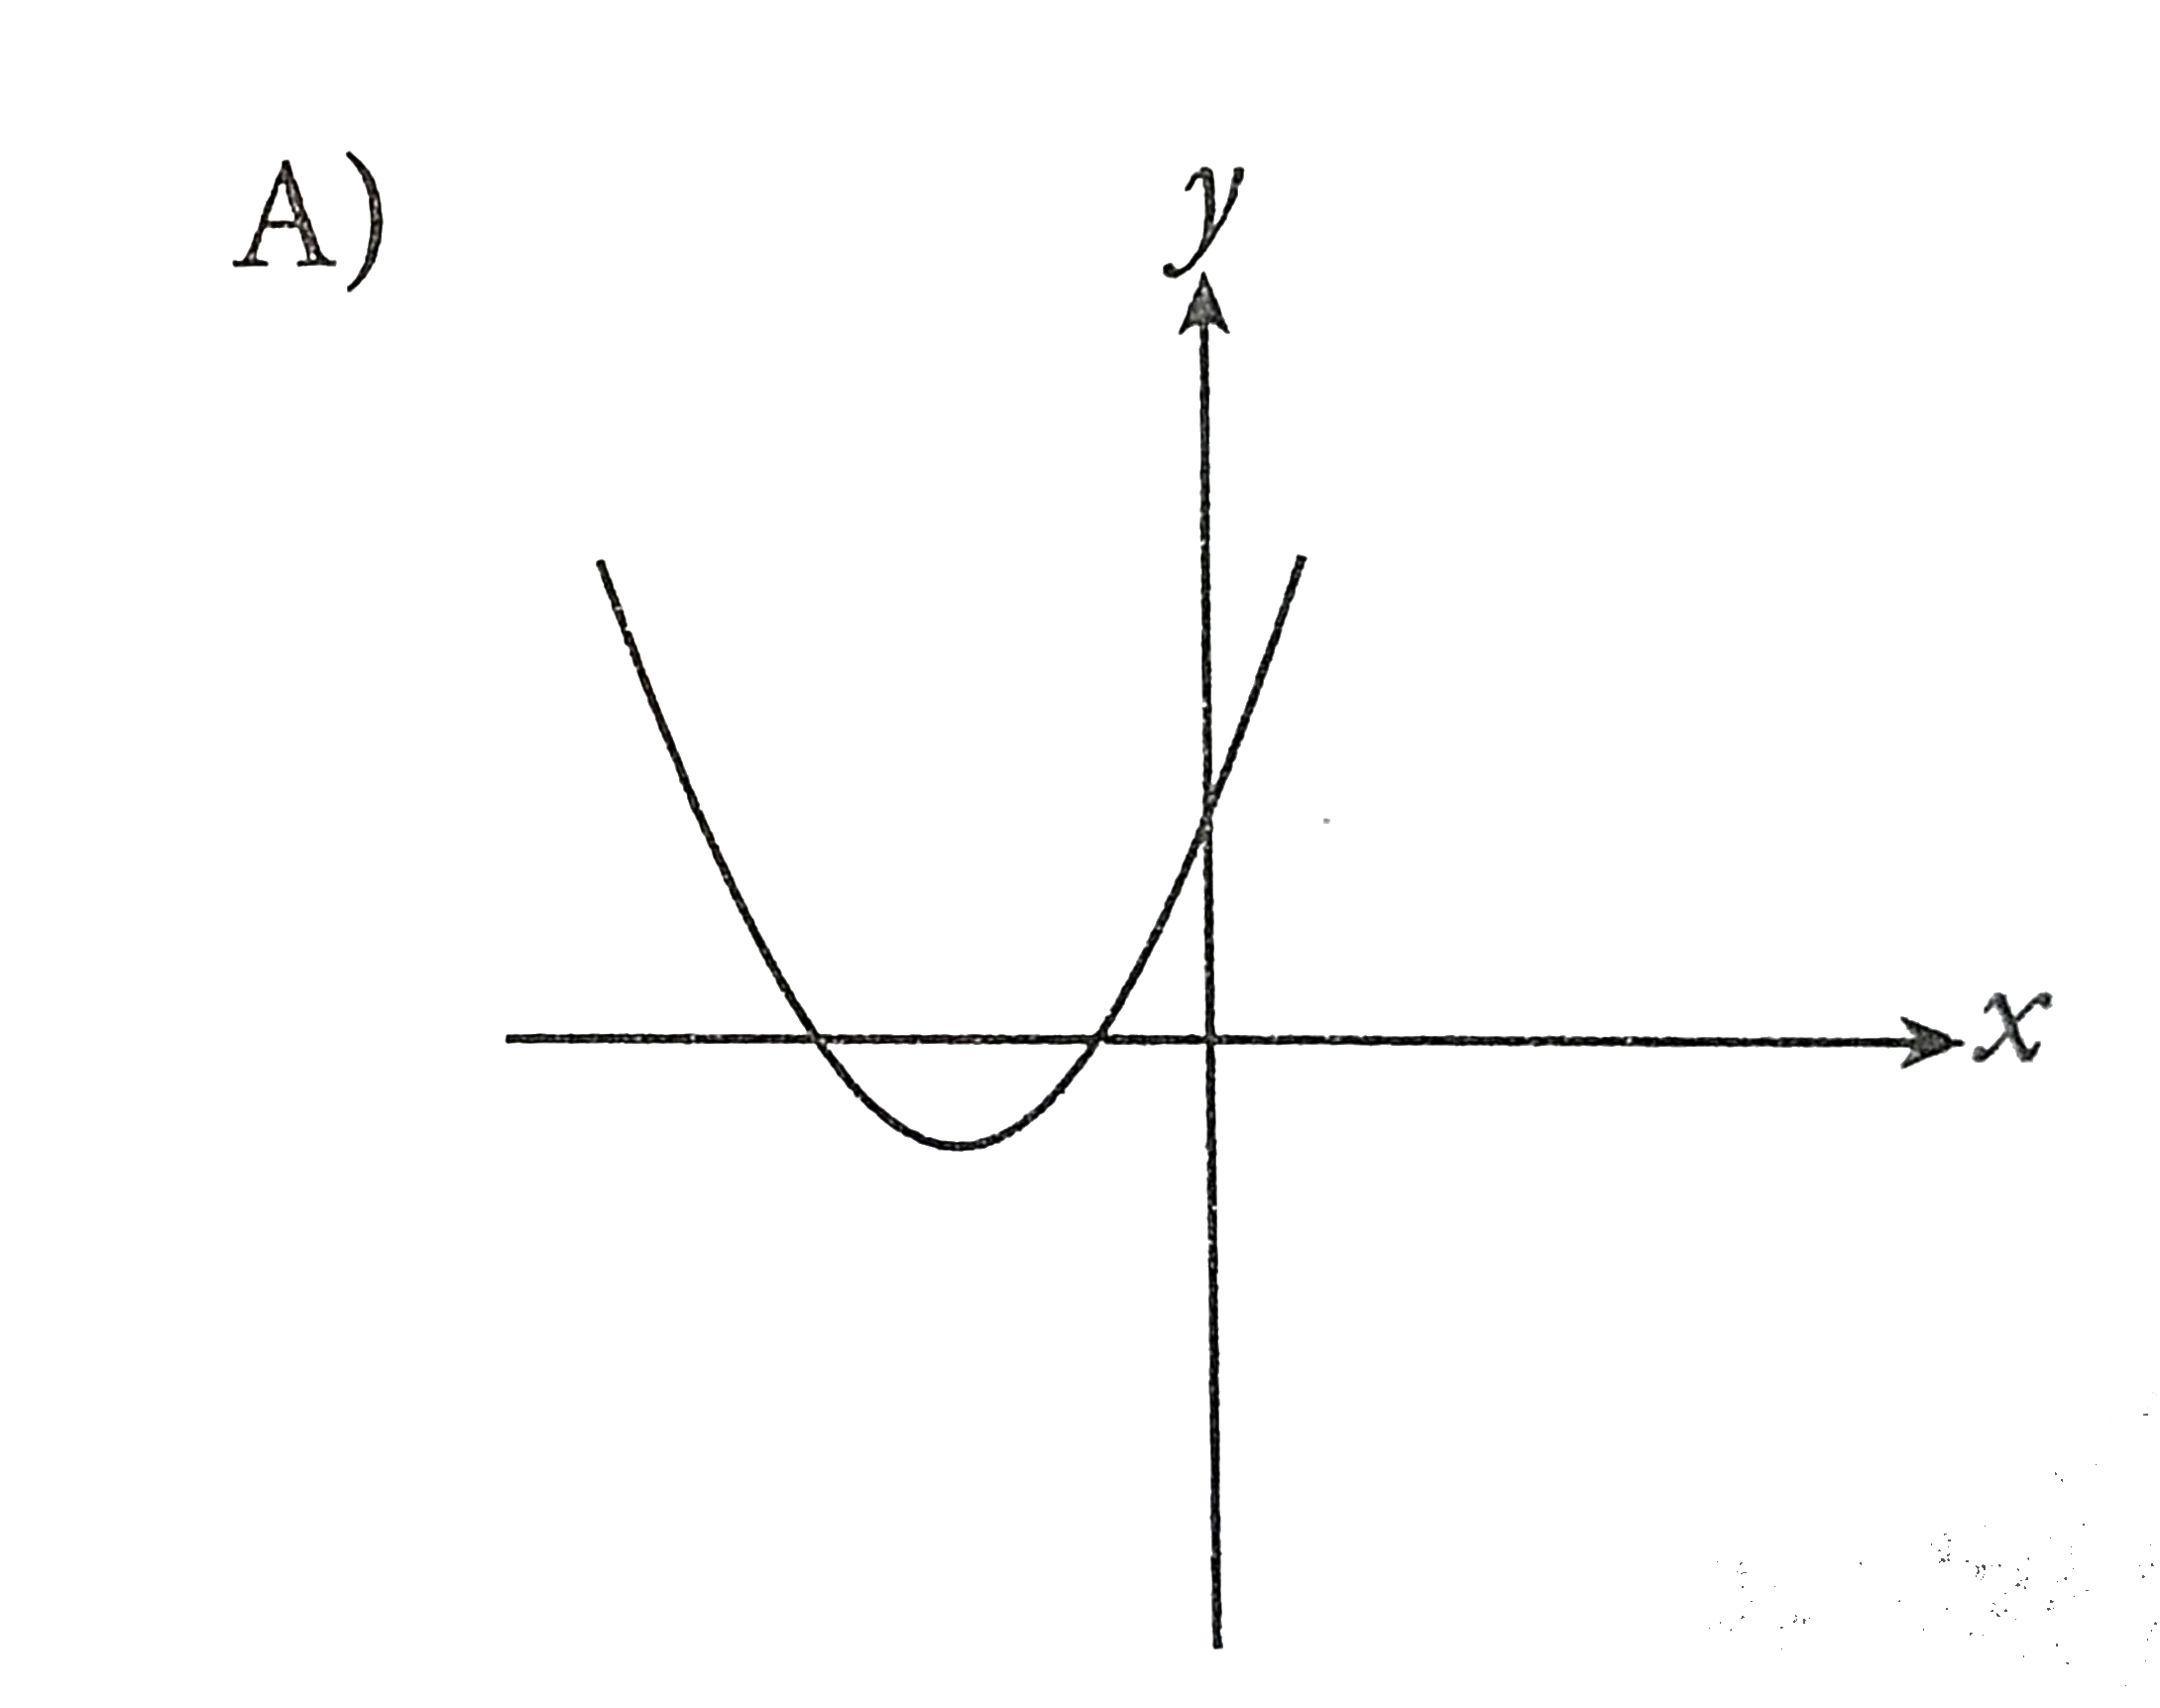
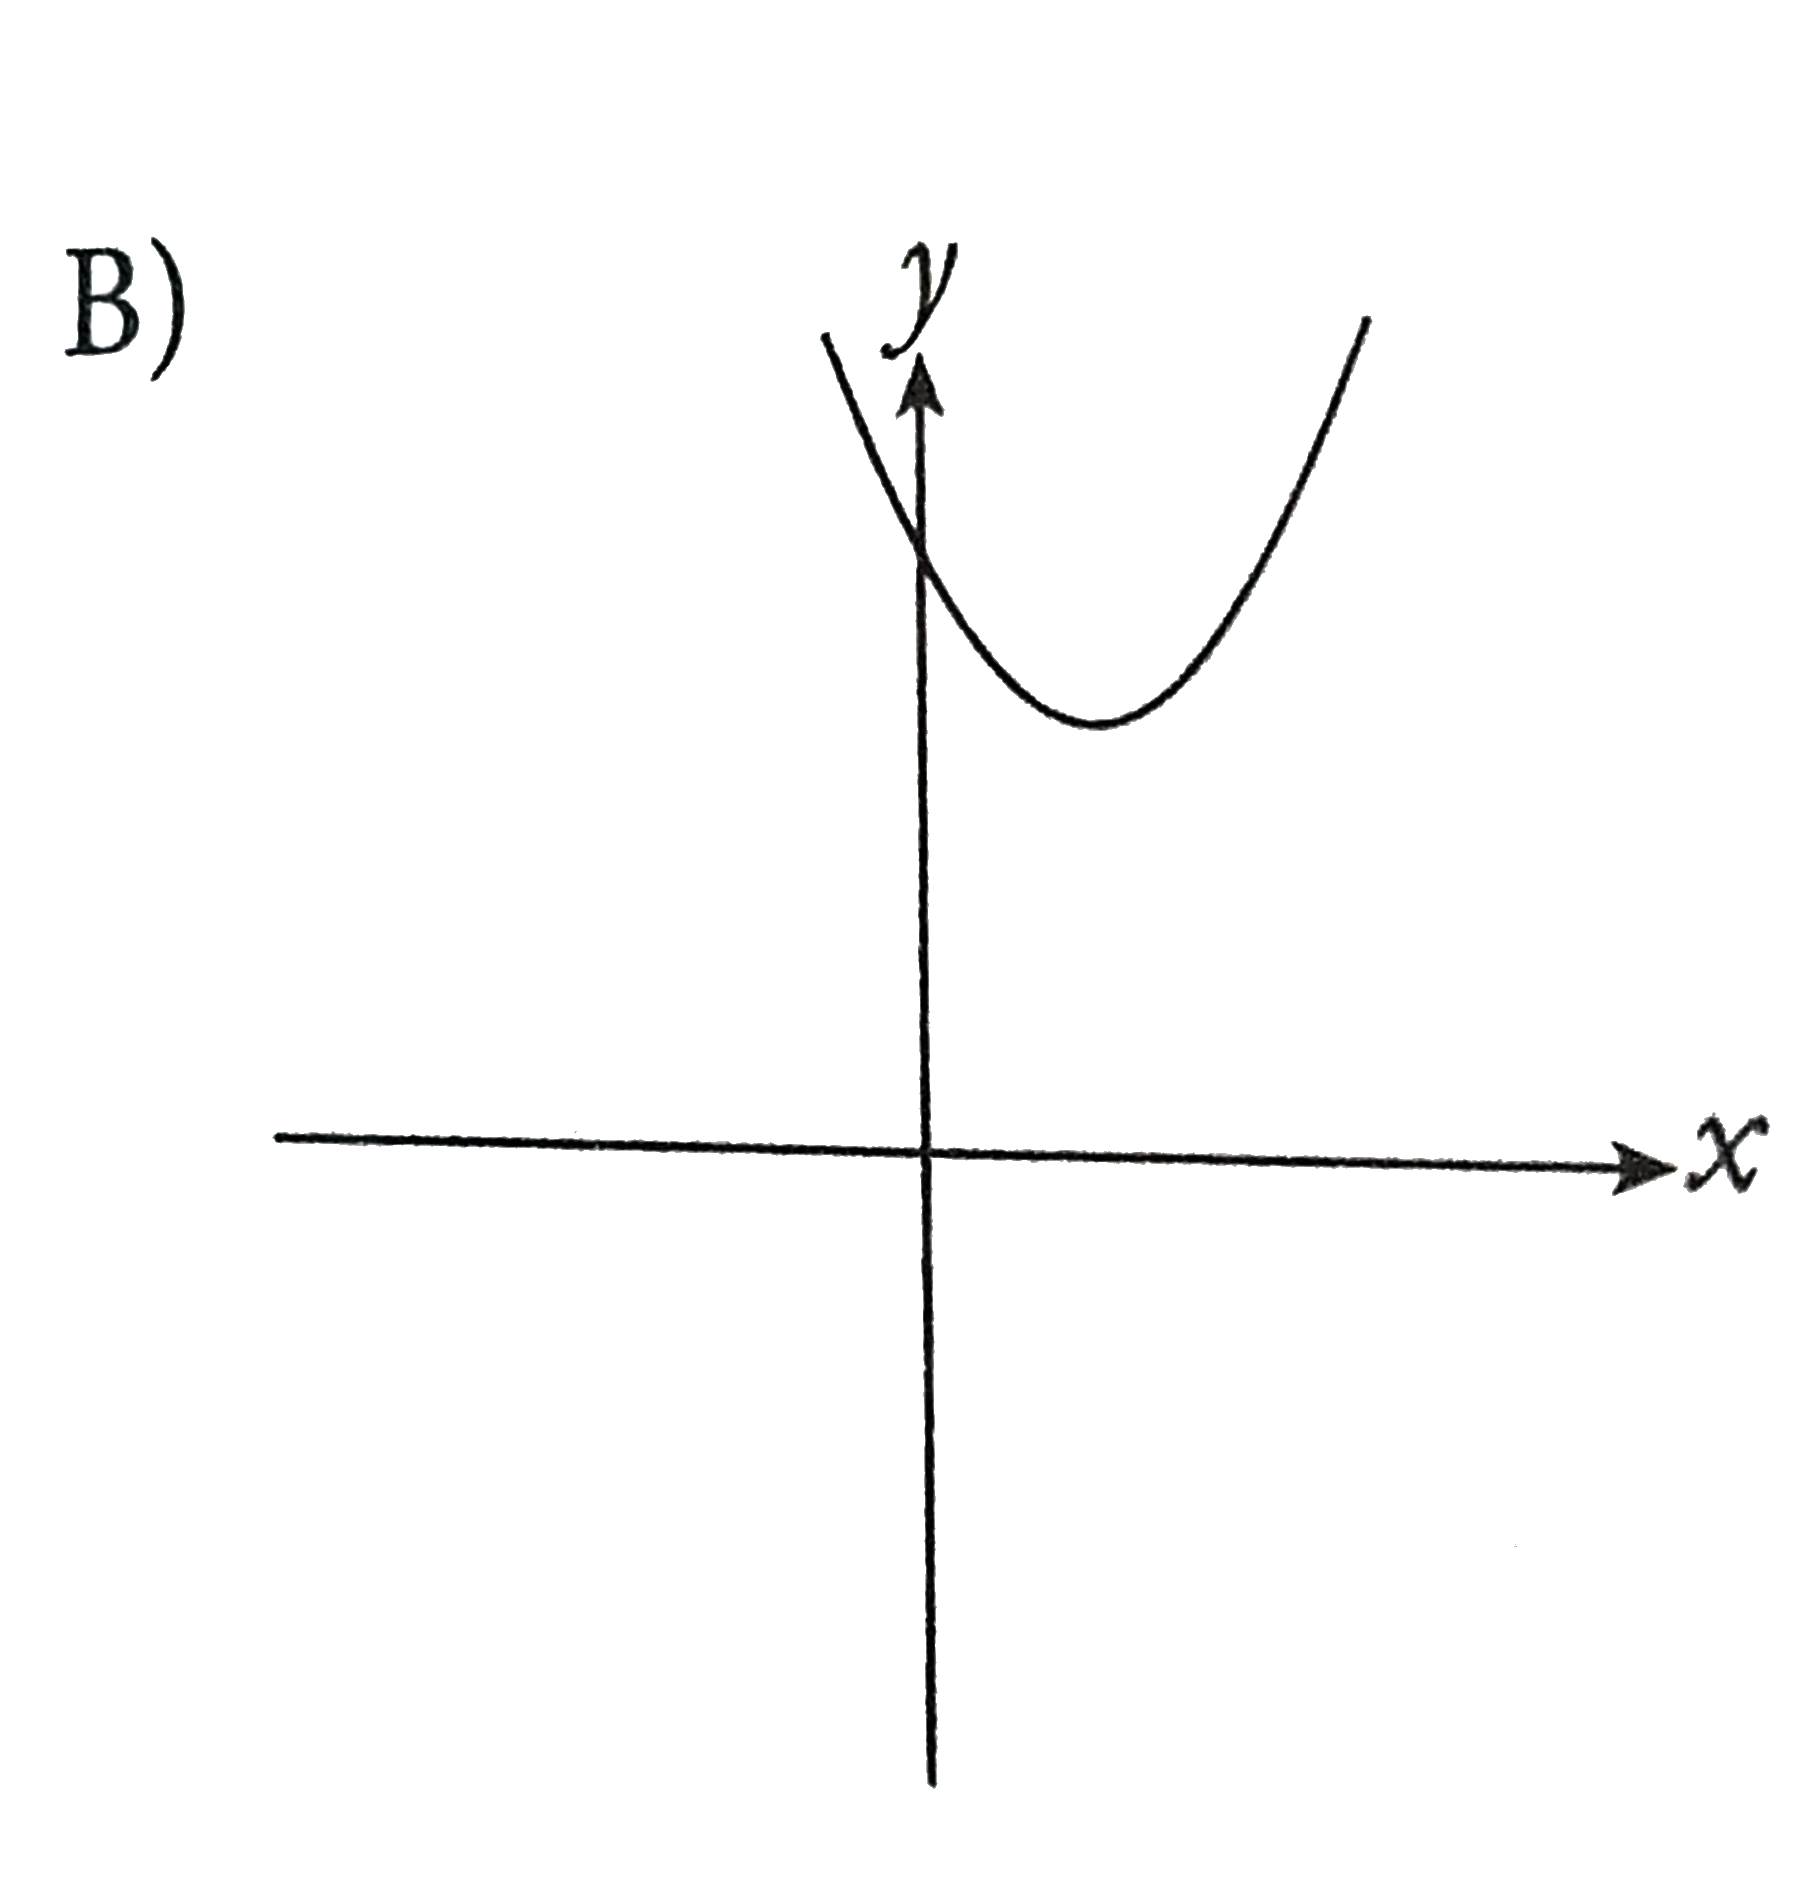
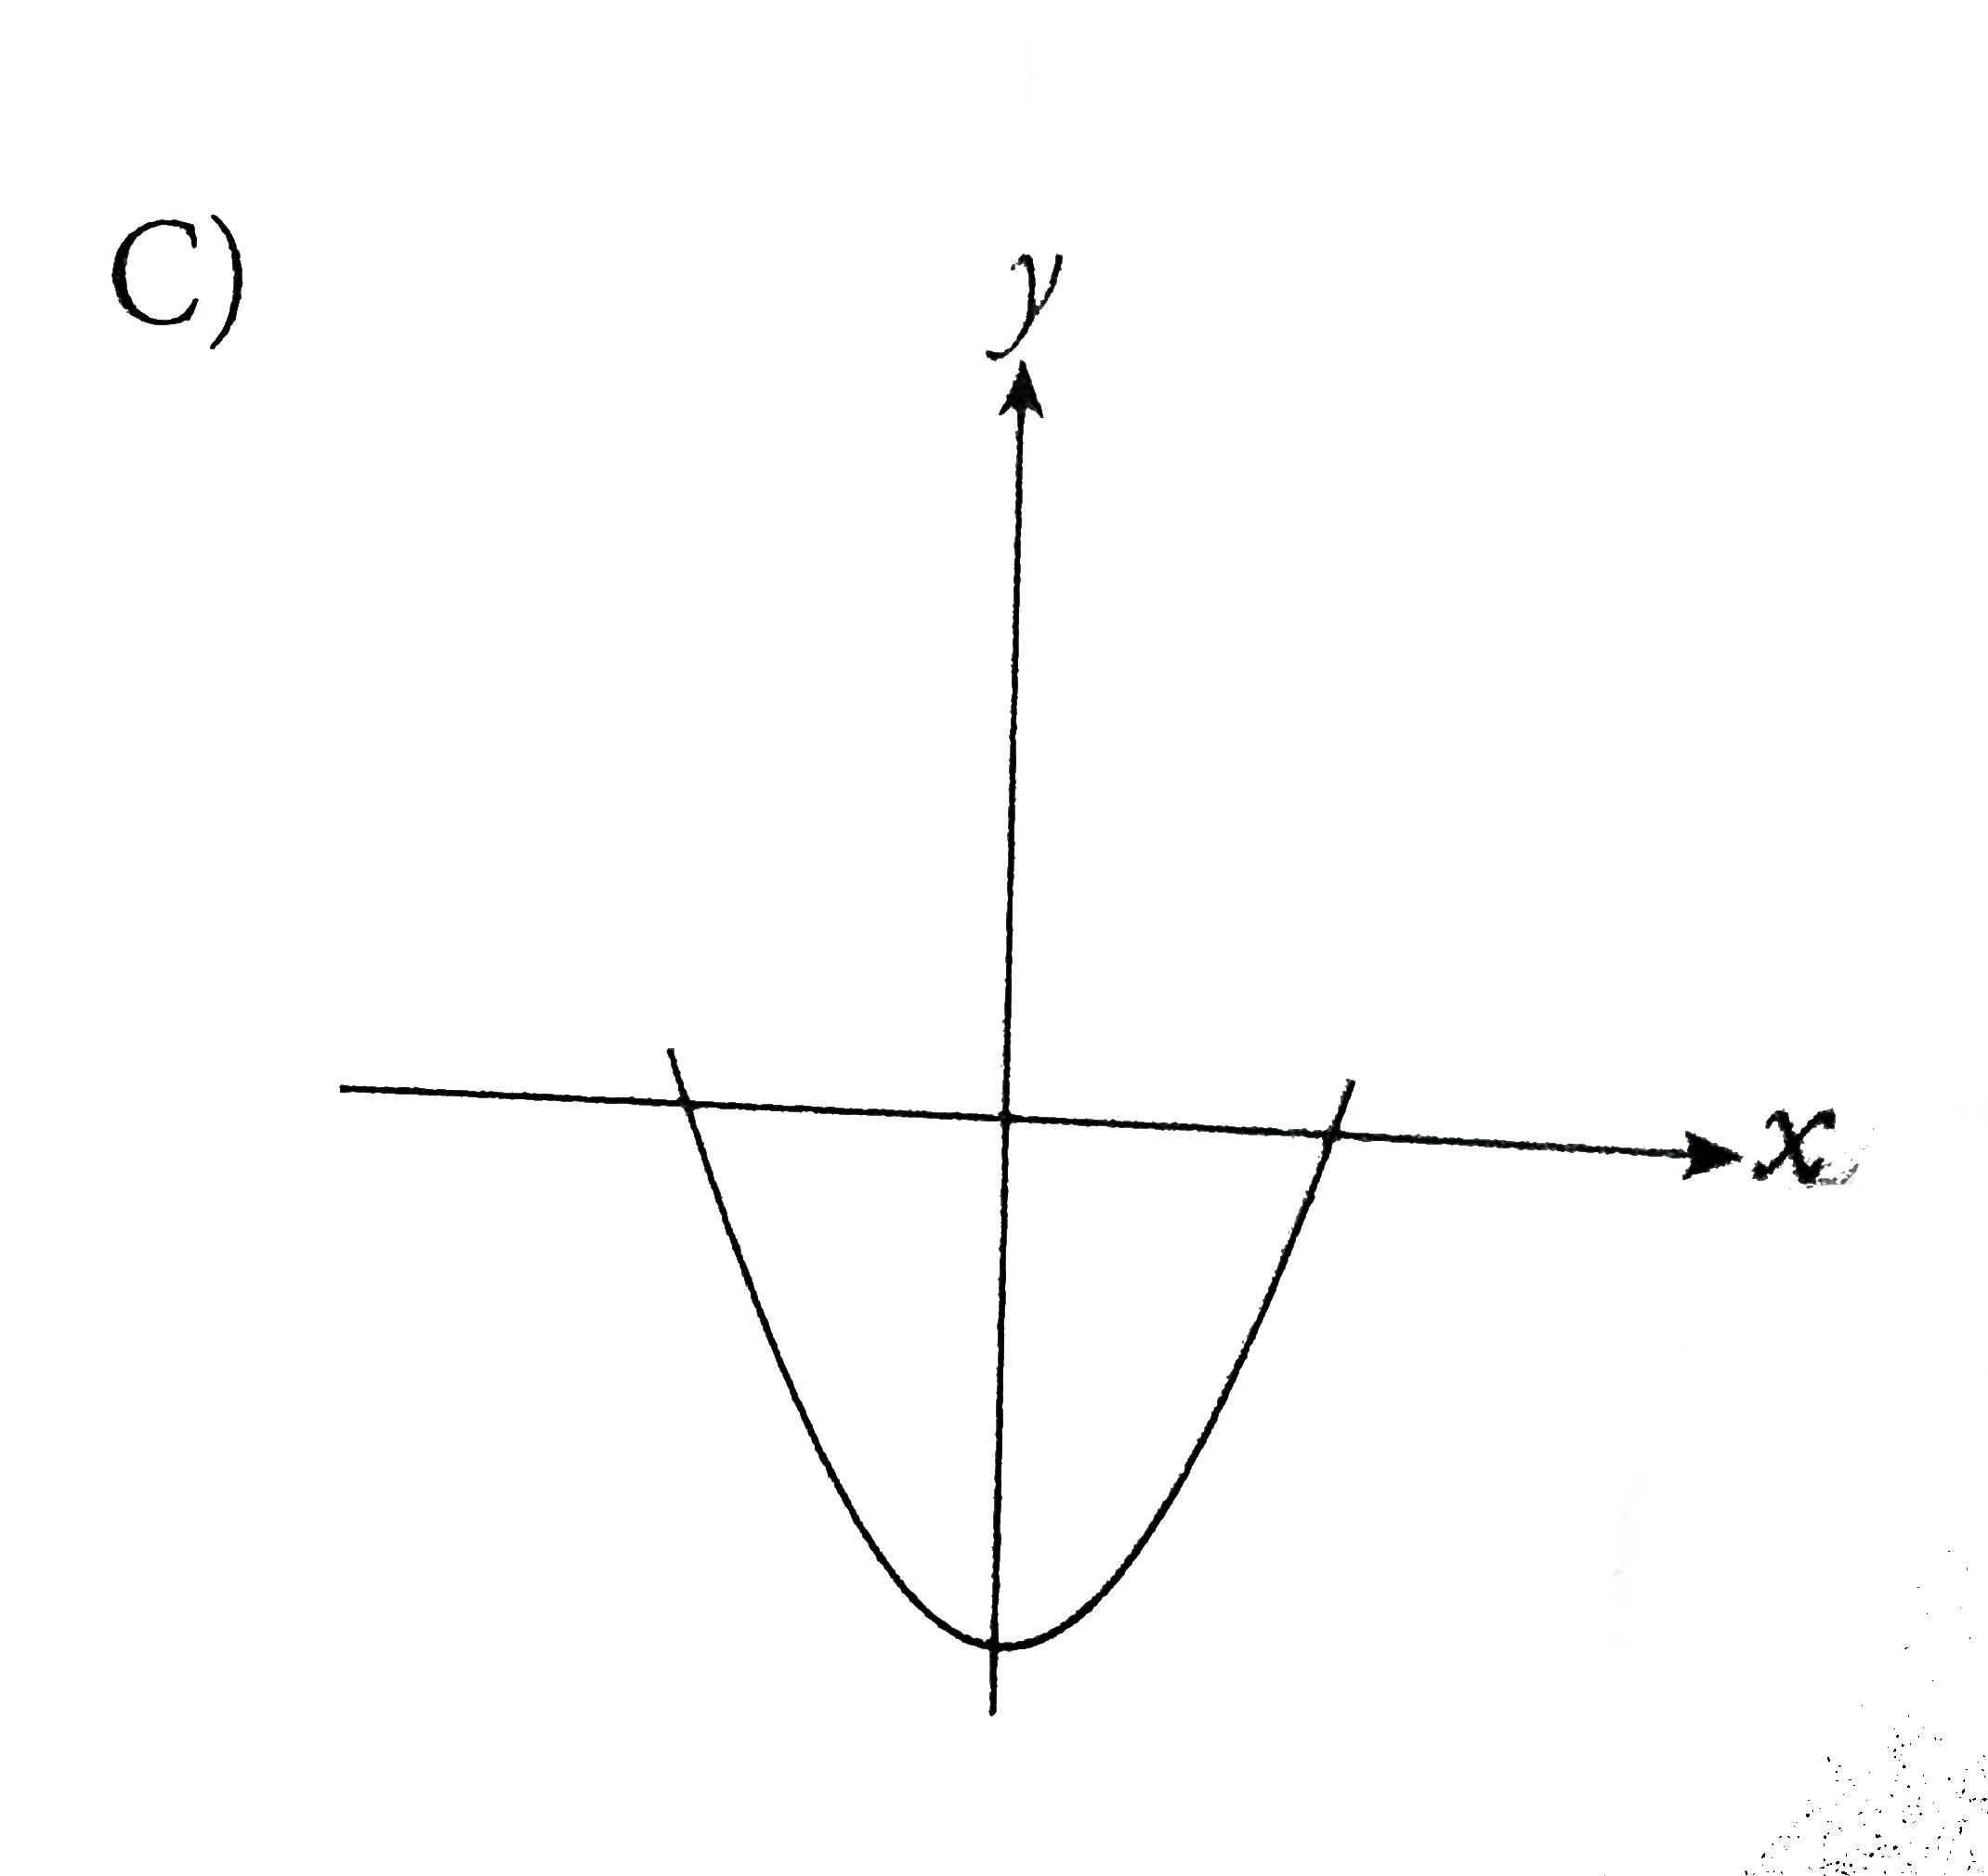

The correct Answer is:A
Step by step video, text & image solution for The quadratic y=f(x) is shown above. Which of the following graphs represents the function y=f(x+3)-4? by Maths experts to help you in doubts & scoring excellent marks in Class 12 exams.
Updated on:21/07/2023Topper's Solved these Questions
Similar Questions
Knowledge Check
The graph of y=f(x) is shown below.
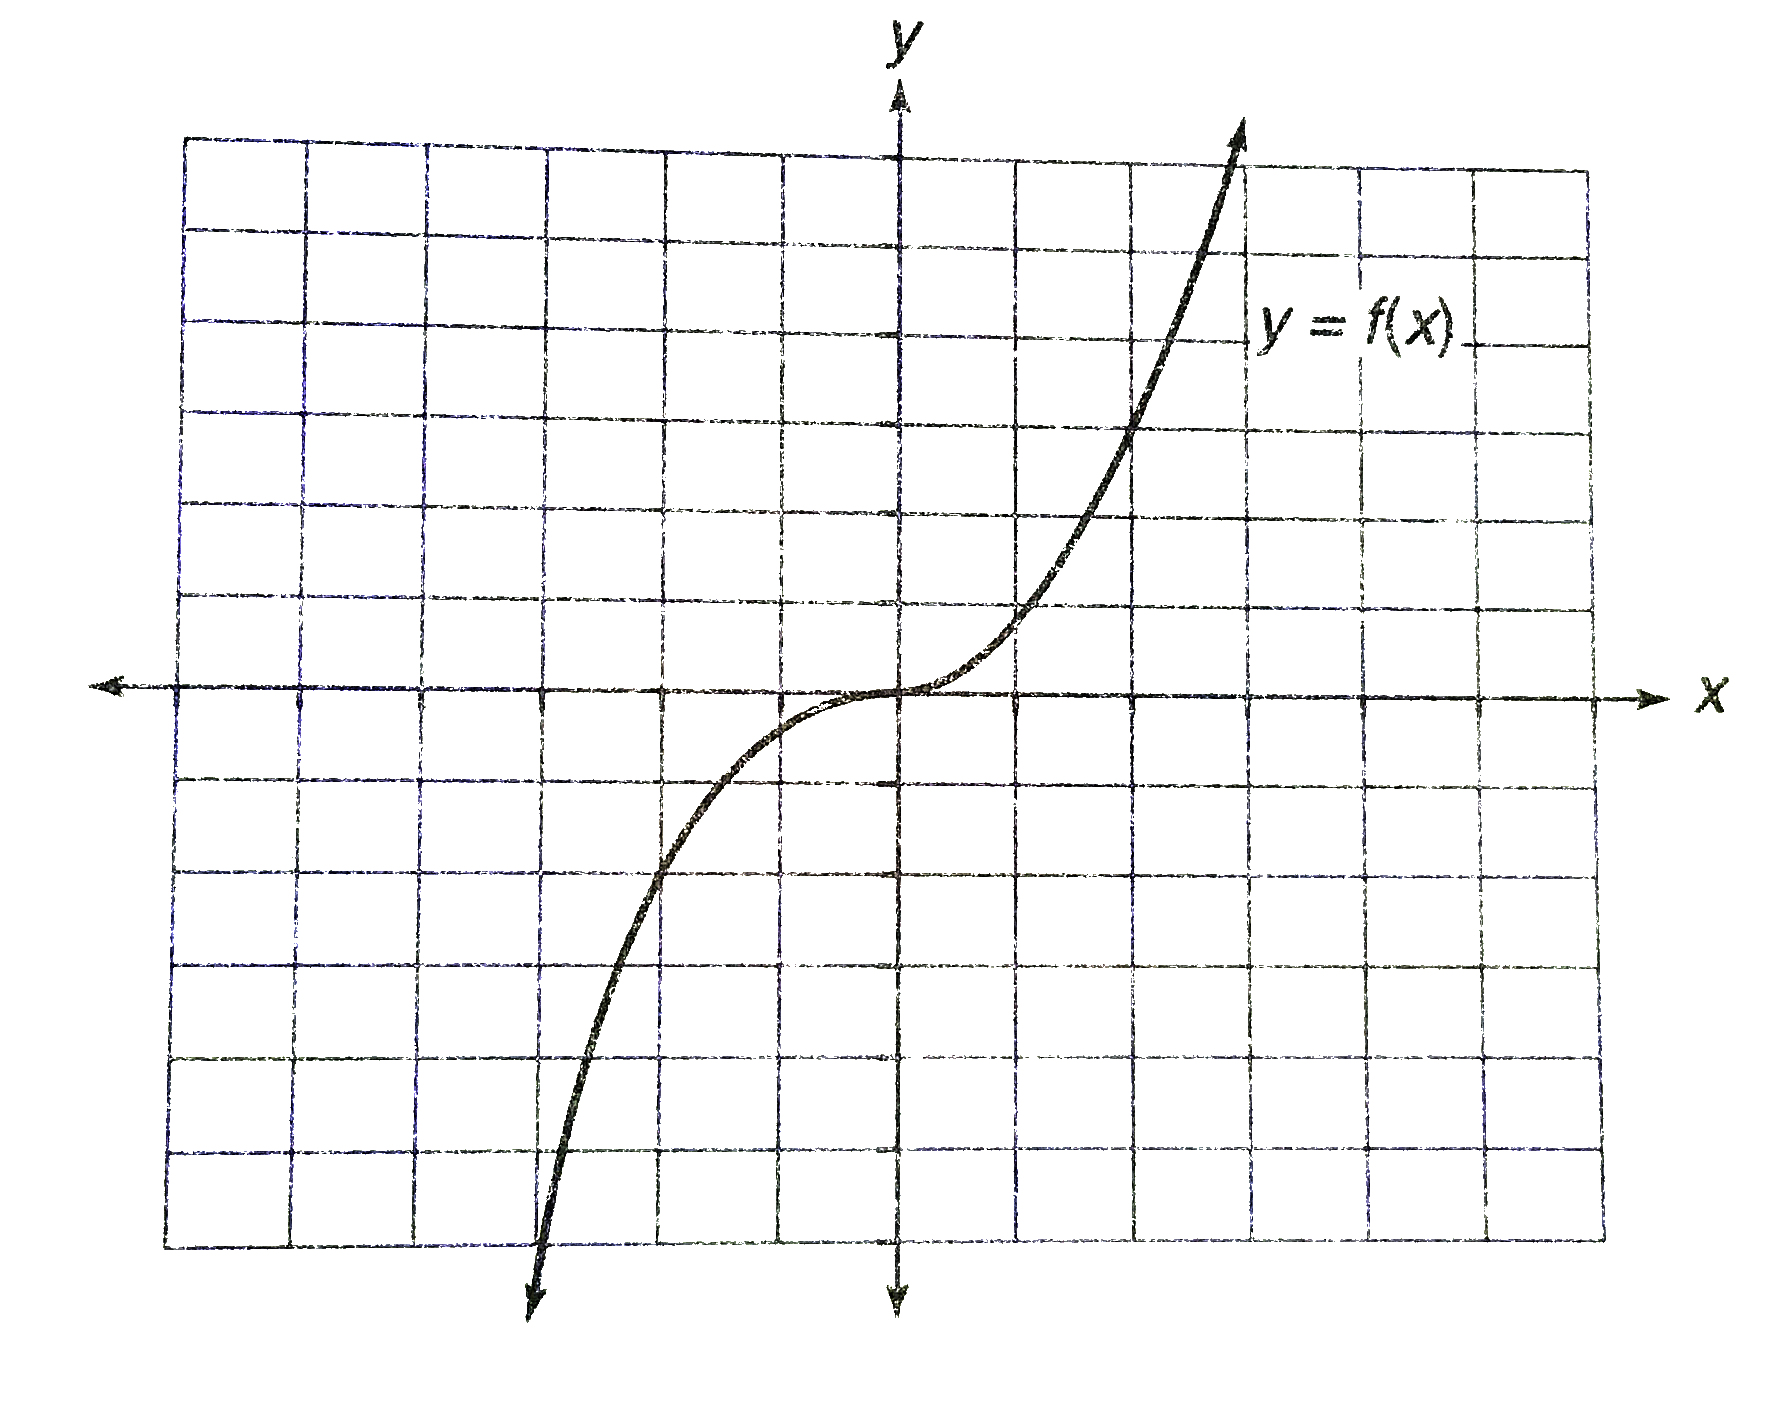
Which of the following could represents the graph of y=f(x−2)+1?A B
B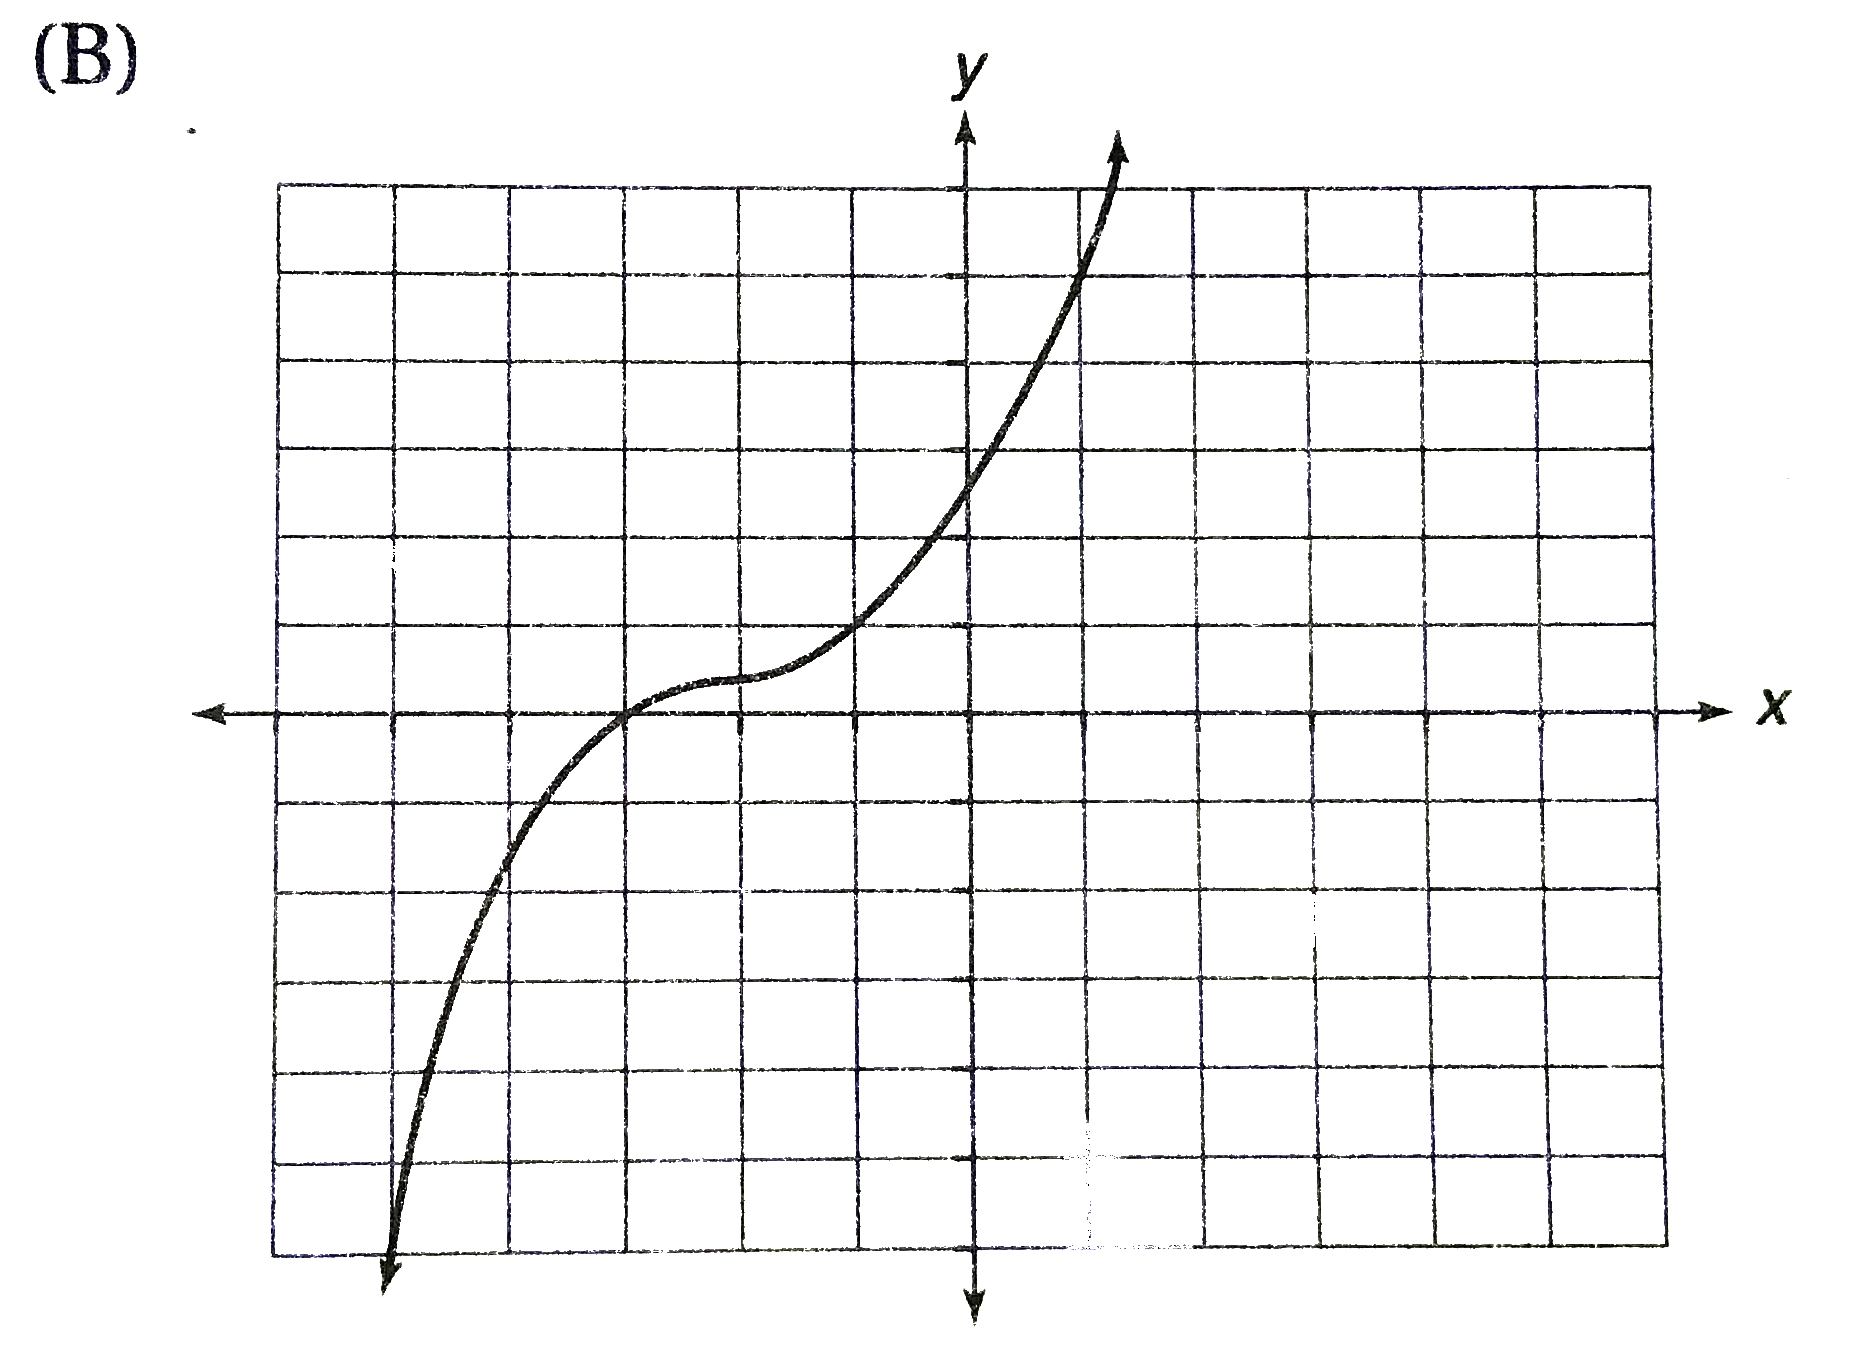 C
C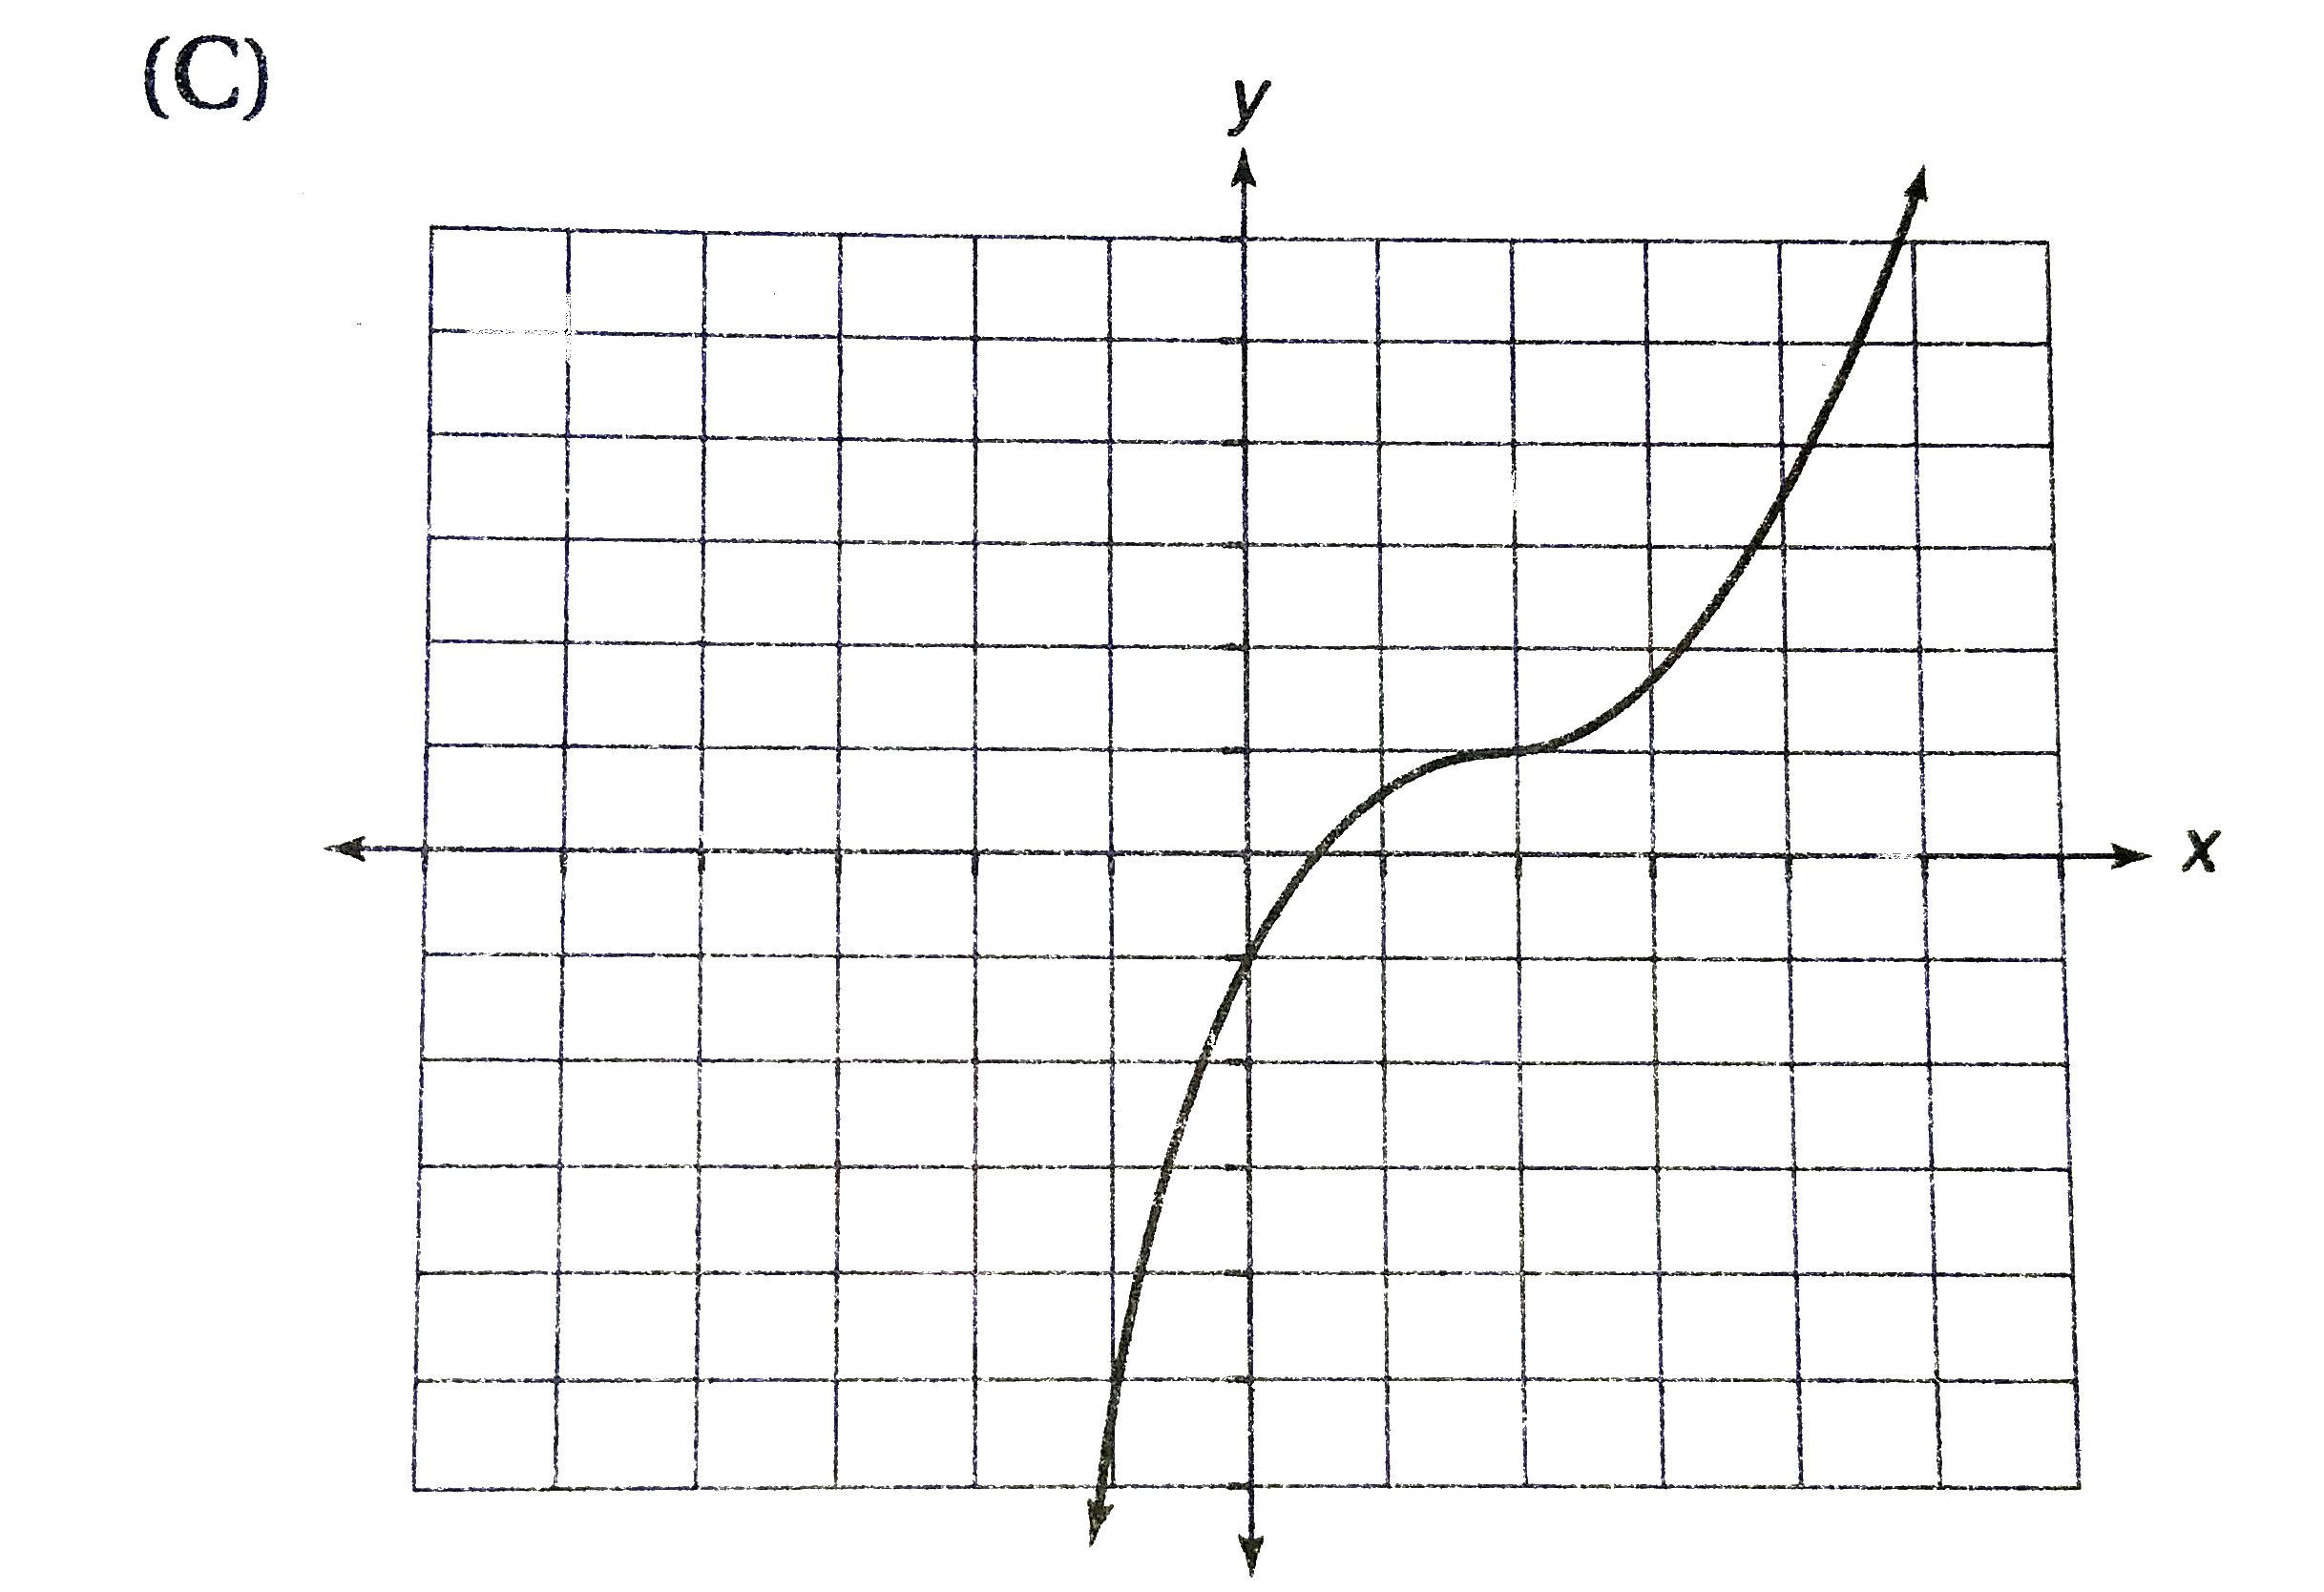 D
D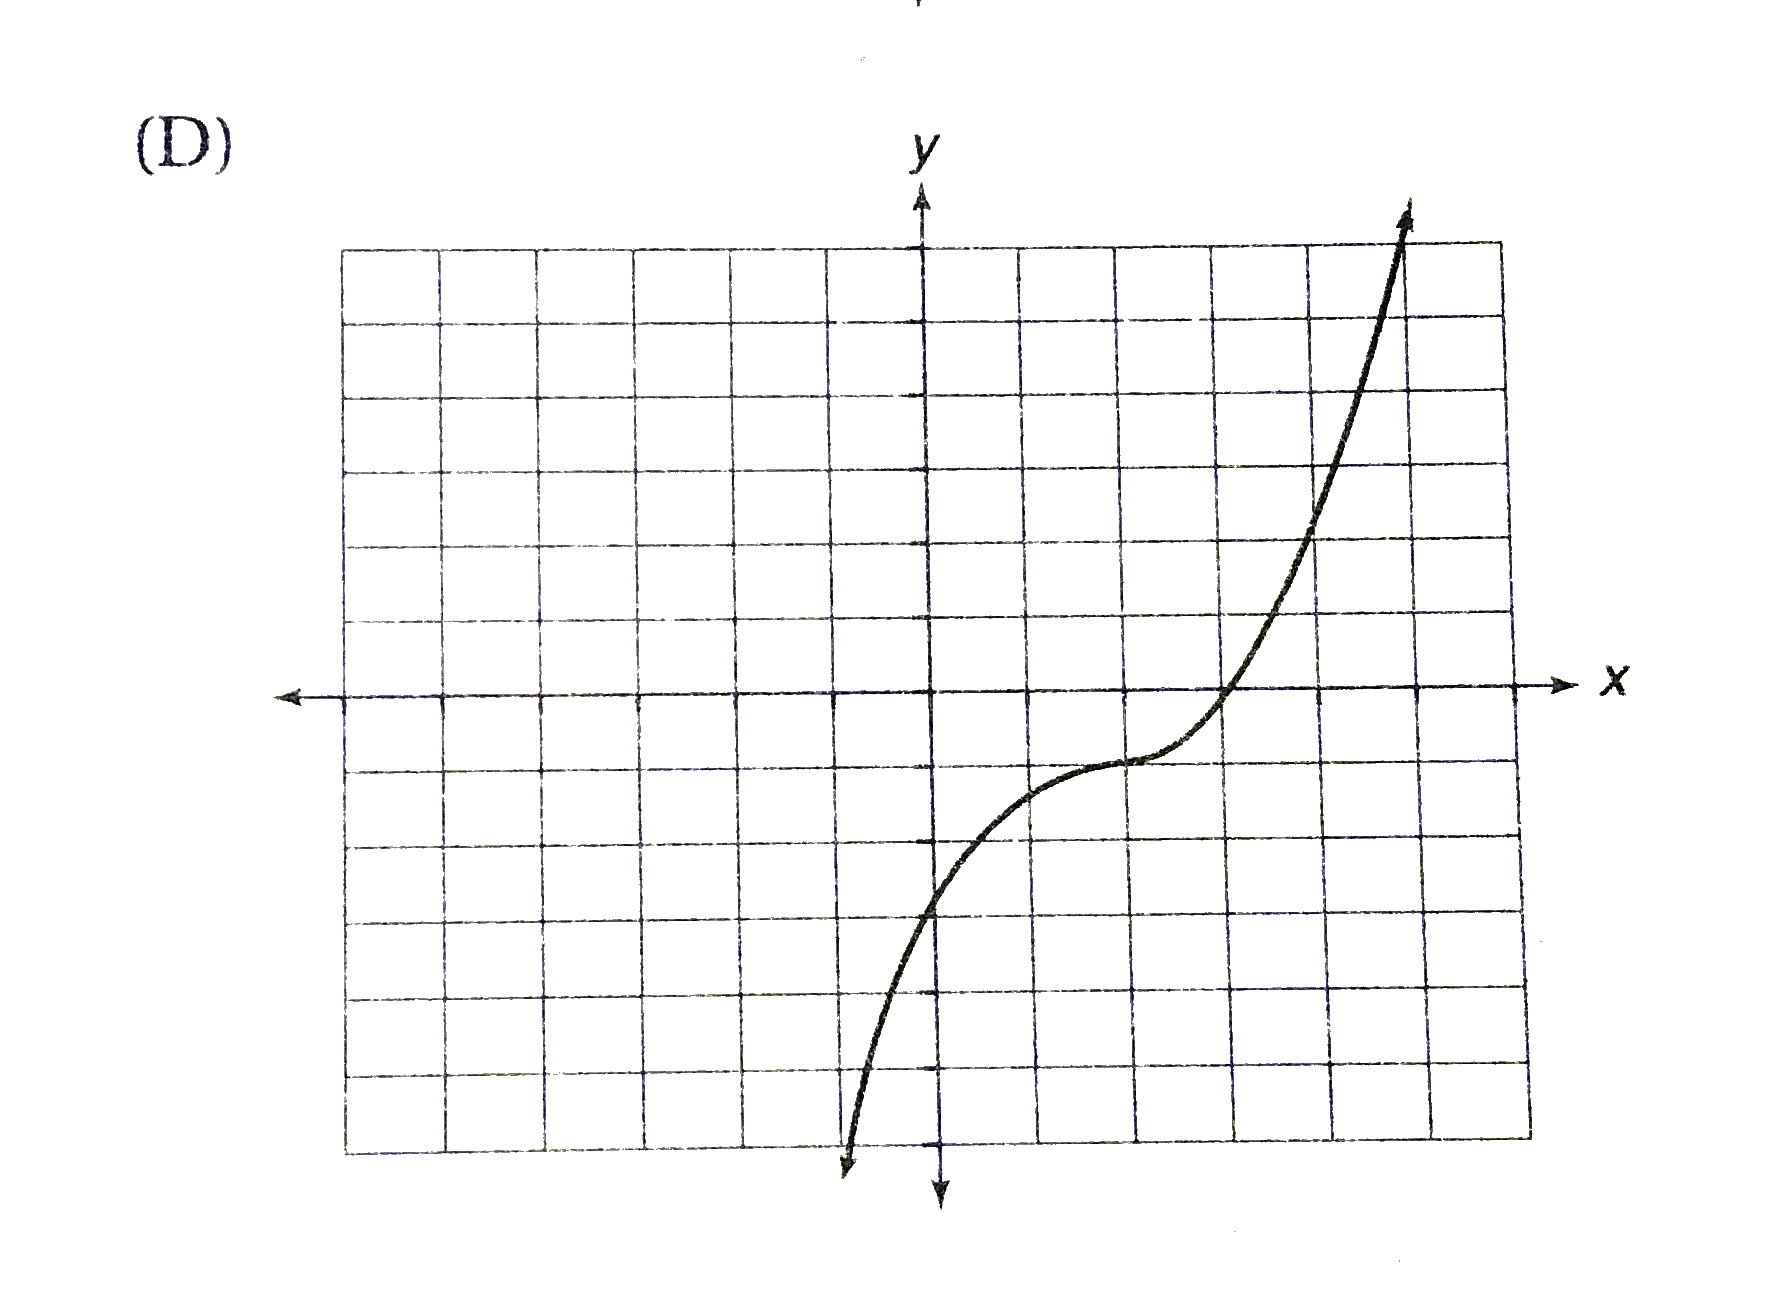
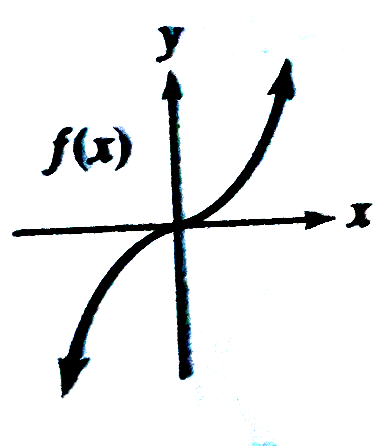
The graph of f(x) is shown above , Which of the following represents the graph of f(x-3) ?A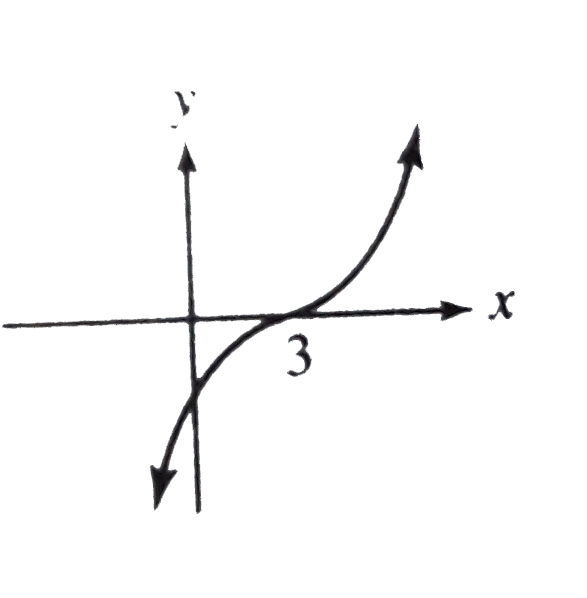 B
B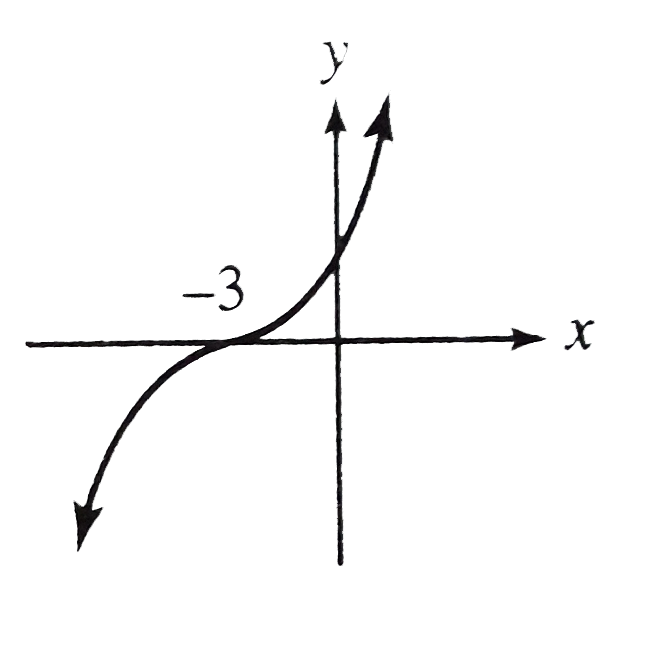 C
C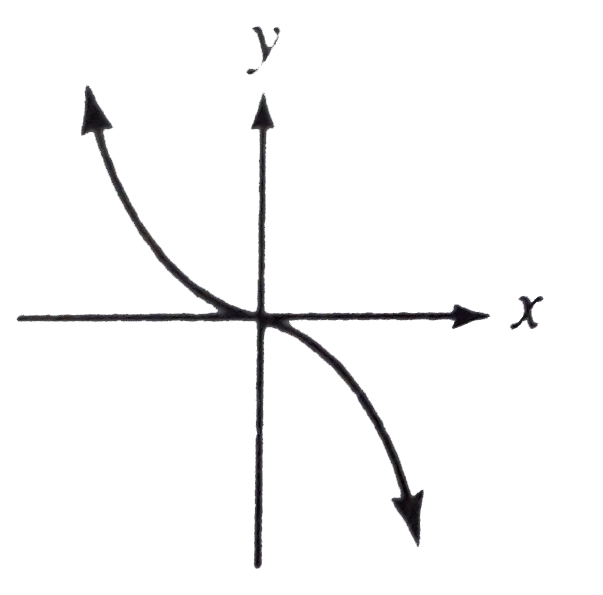 D
D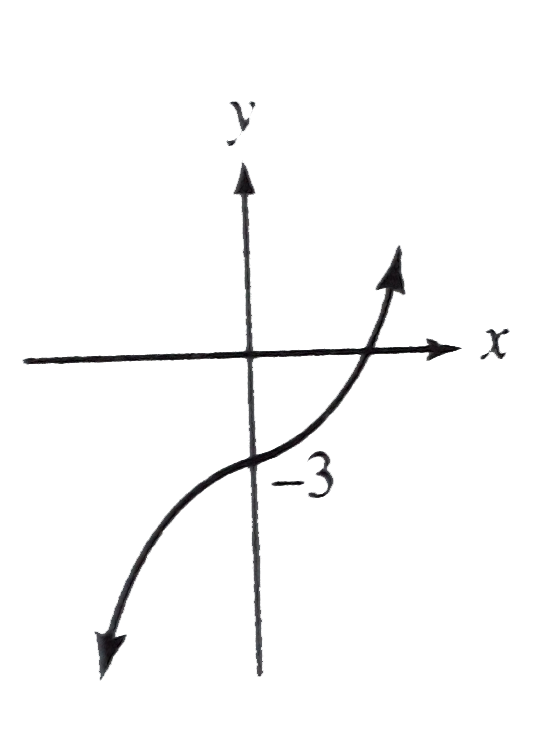
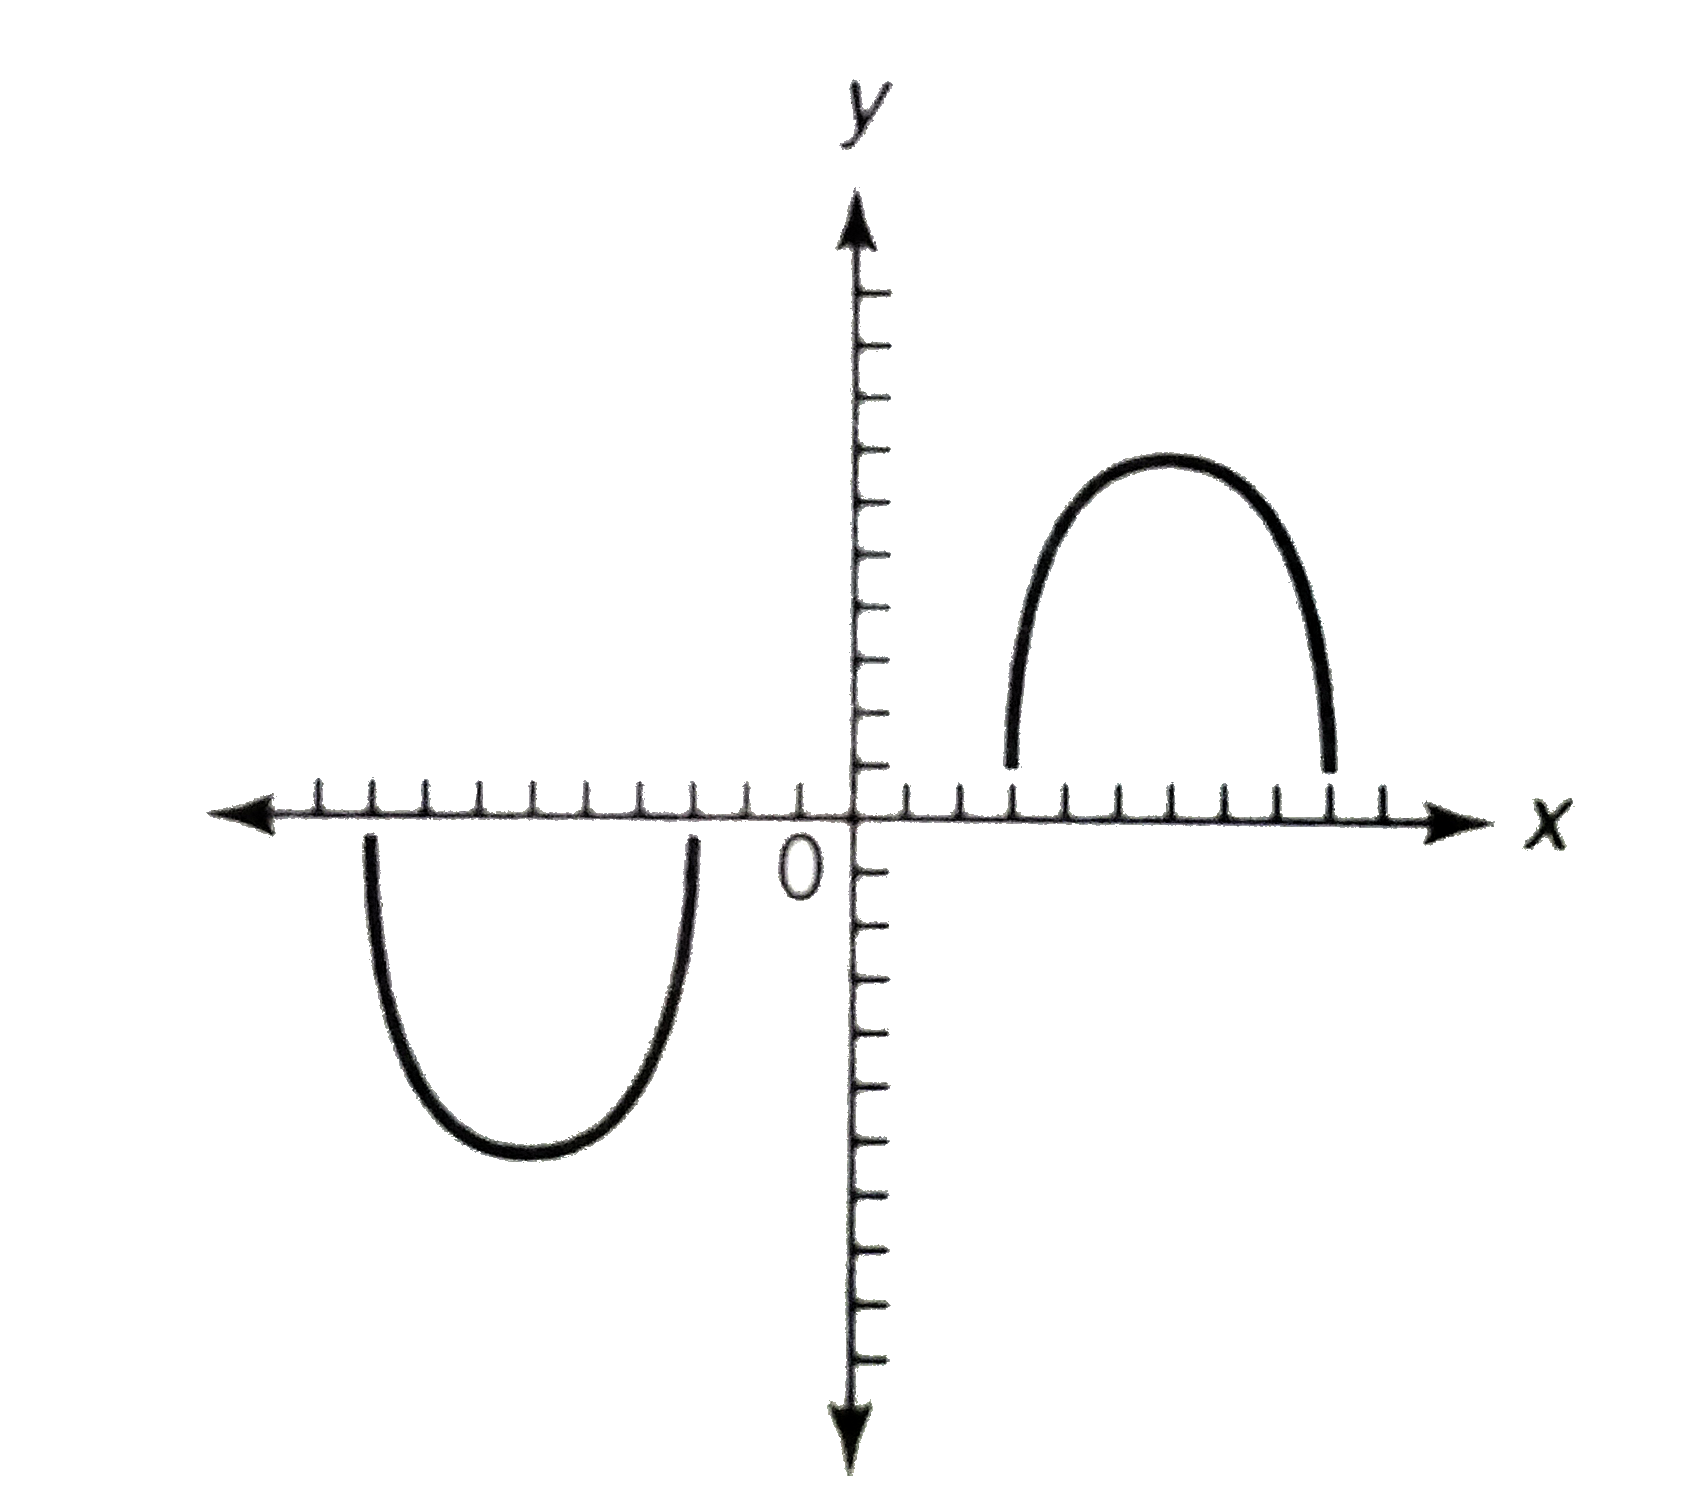
The graph of the function f is shown above. Which of the following could represent the graph of y=|f(x)|?A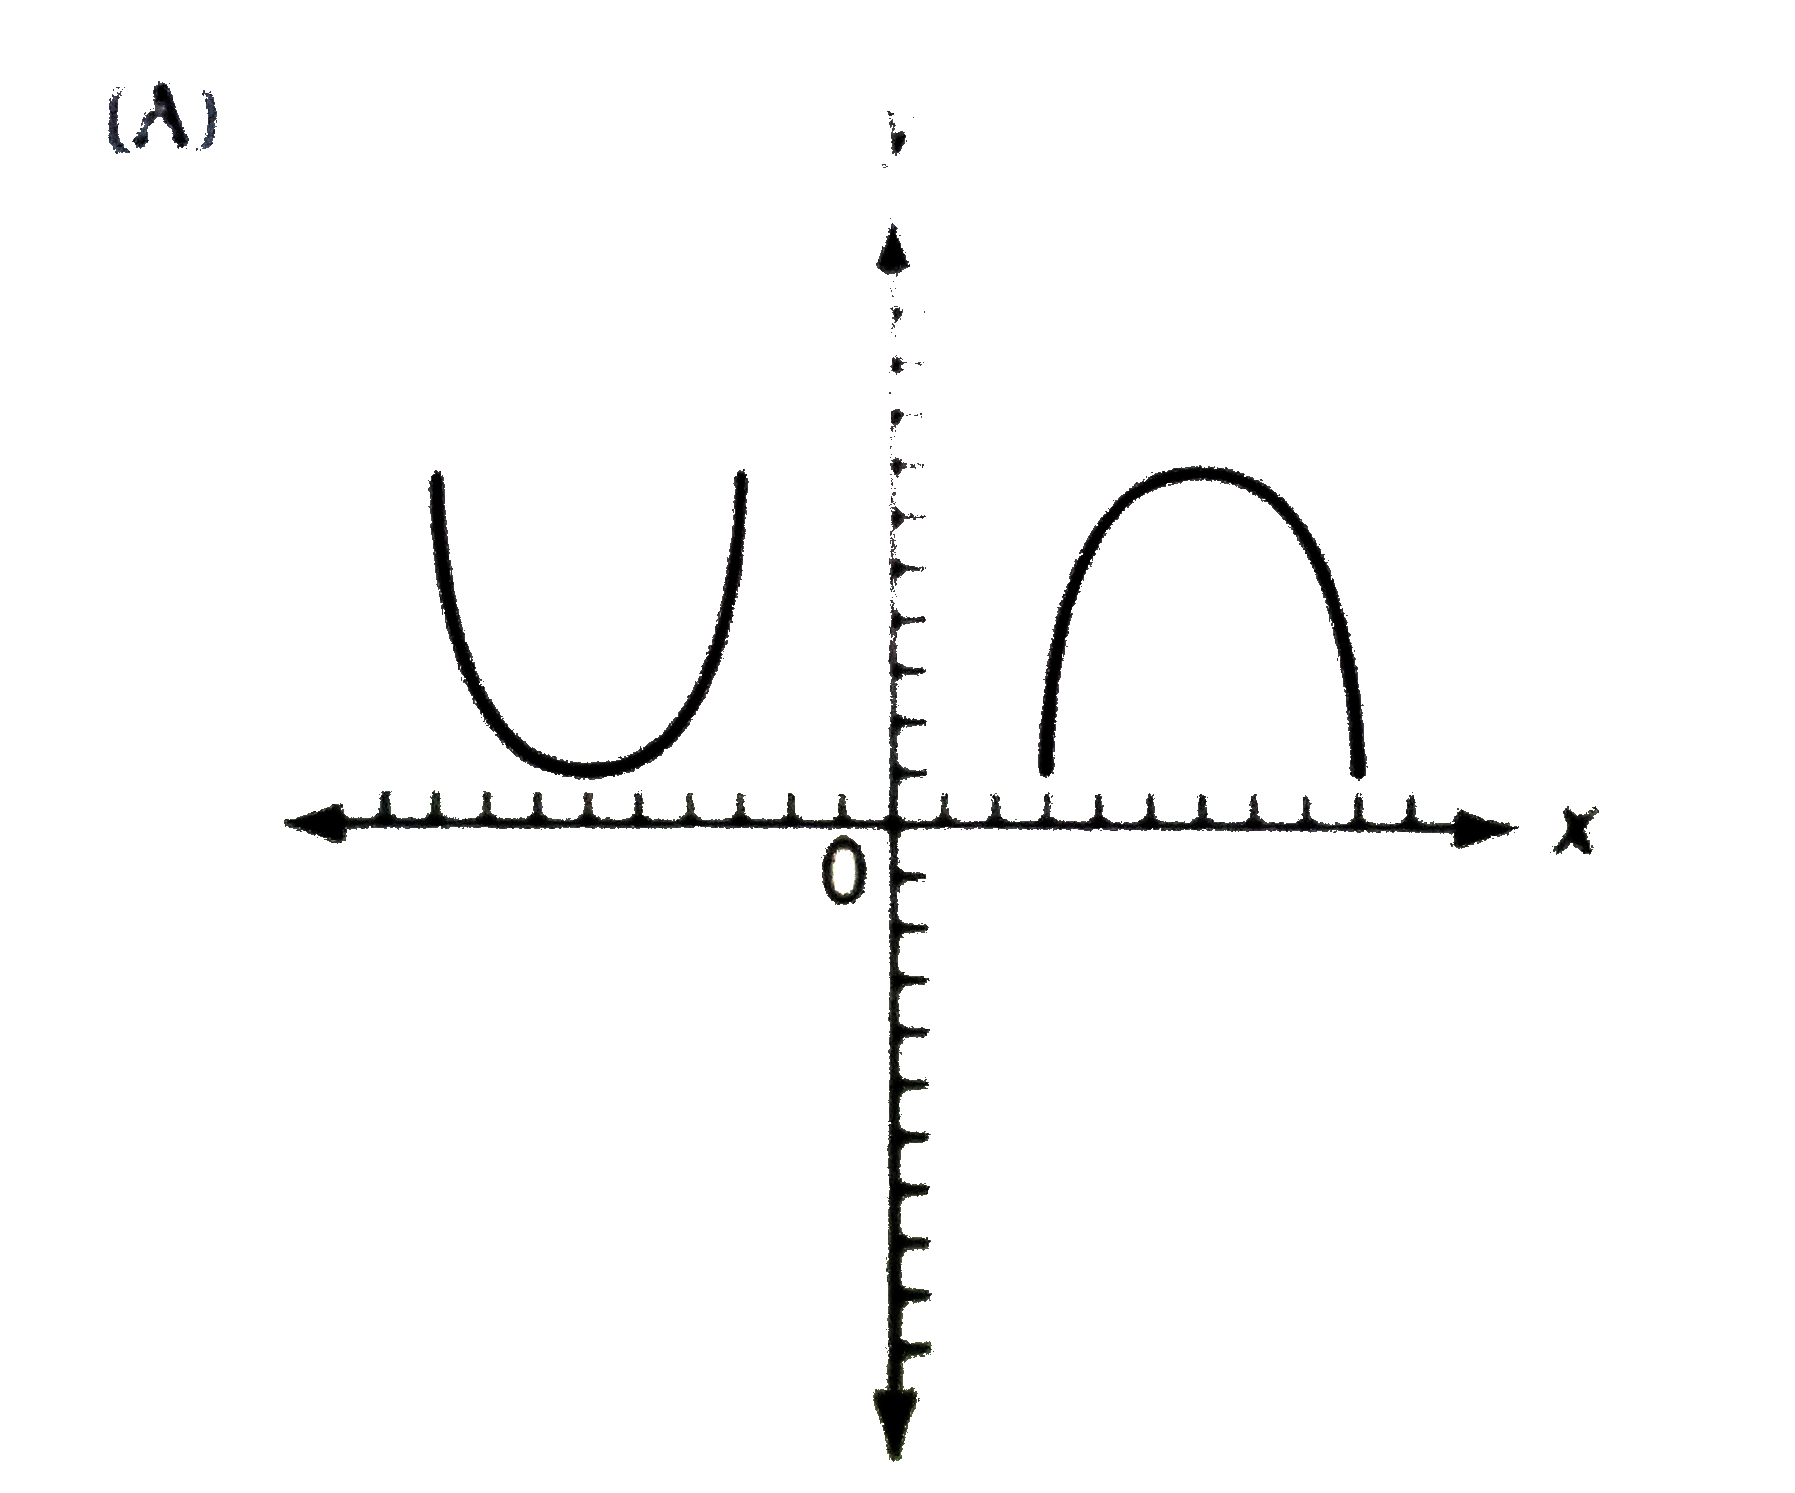 B
B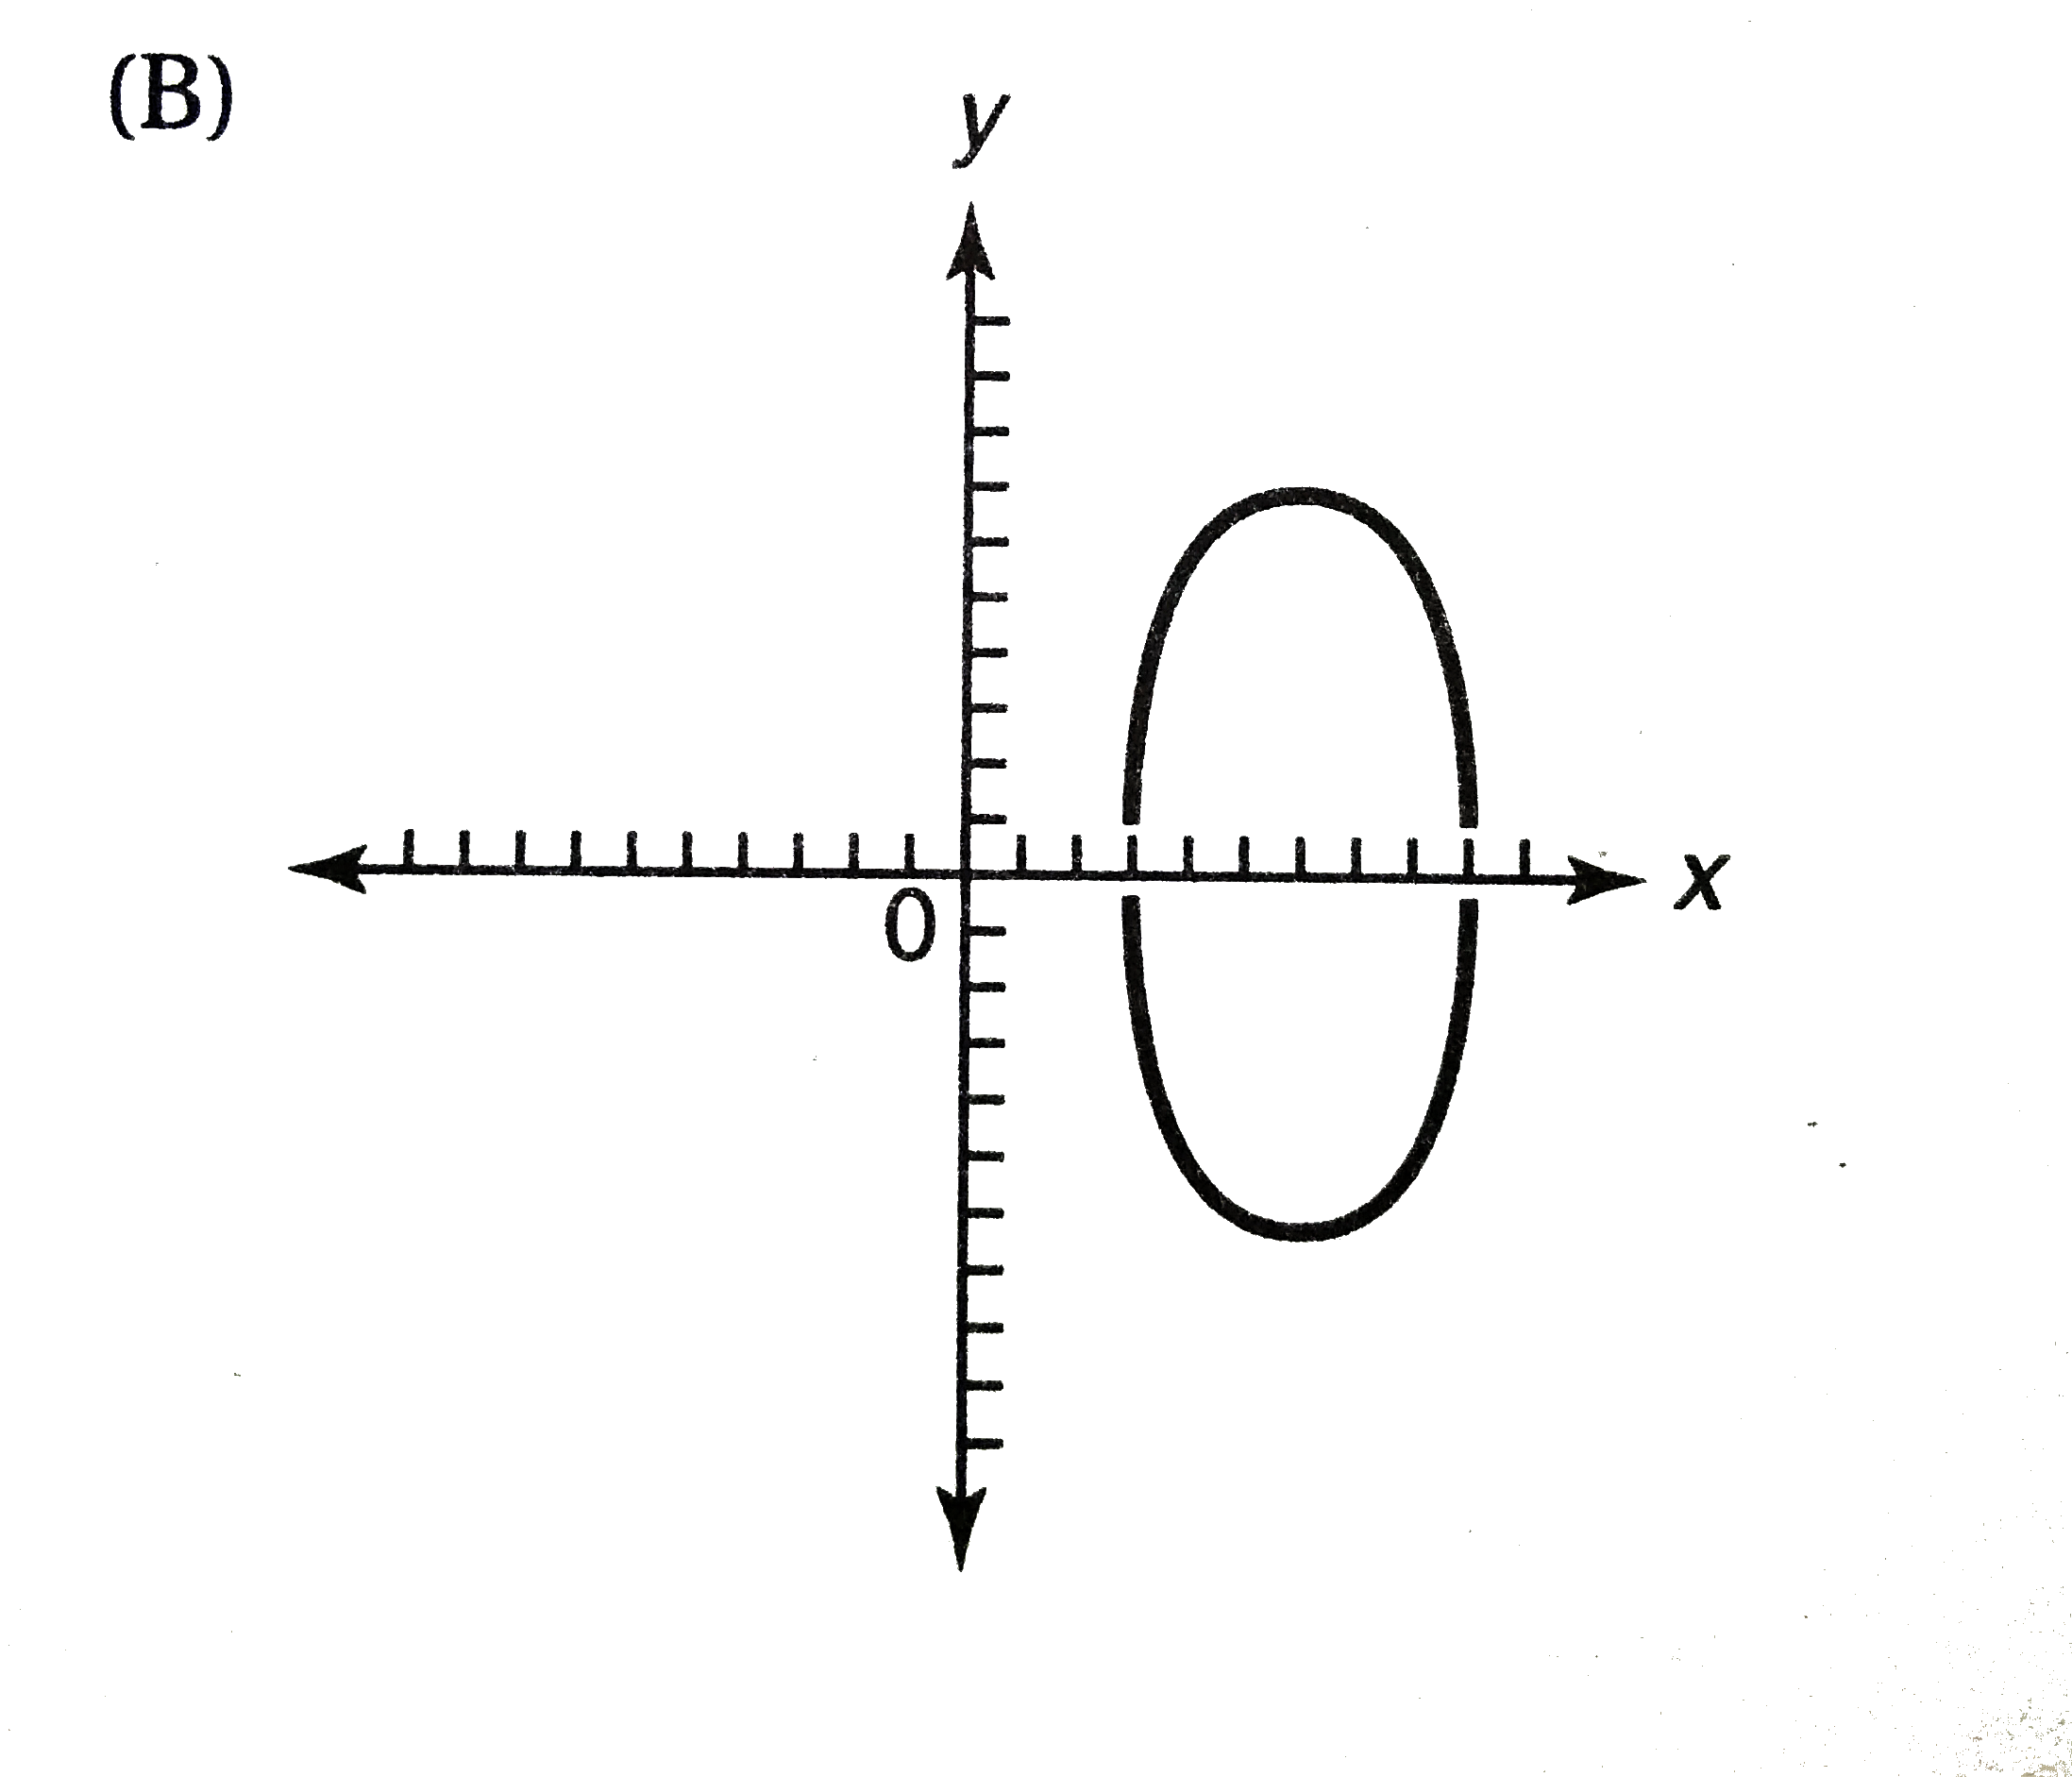 C
C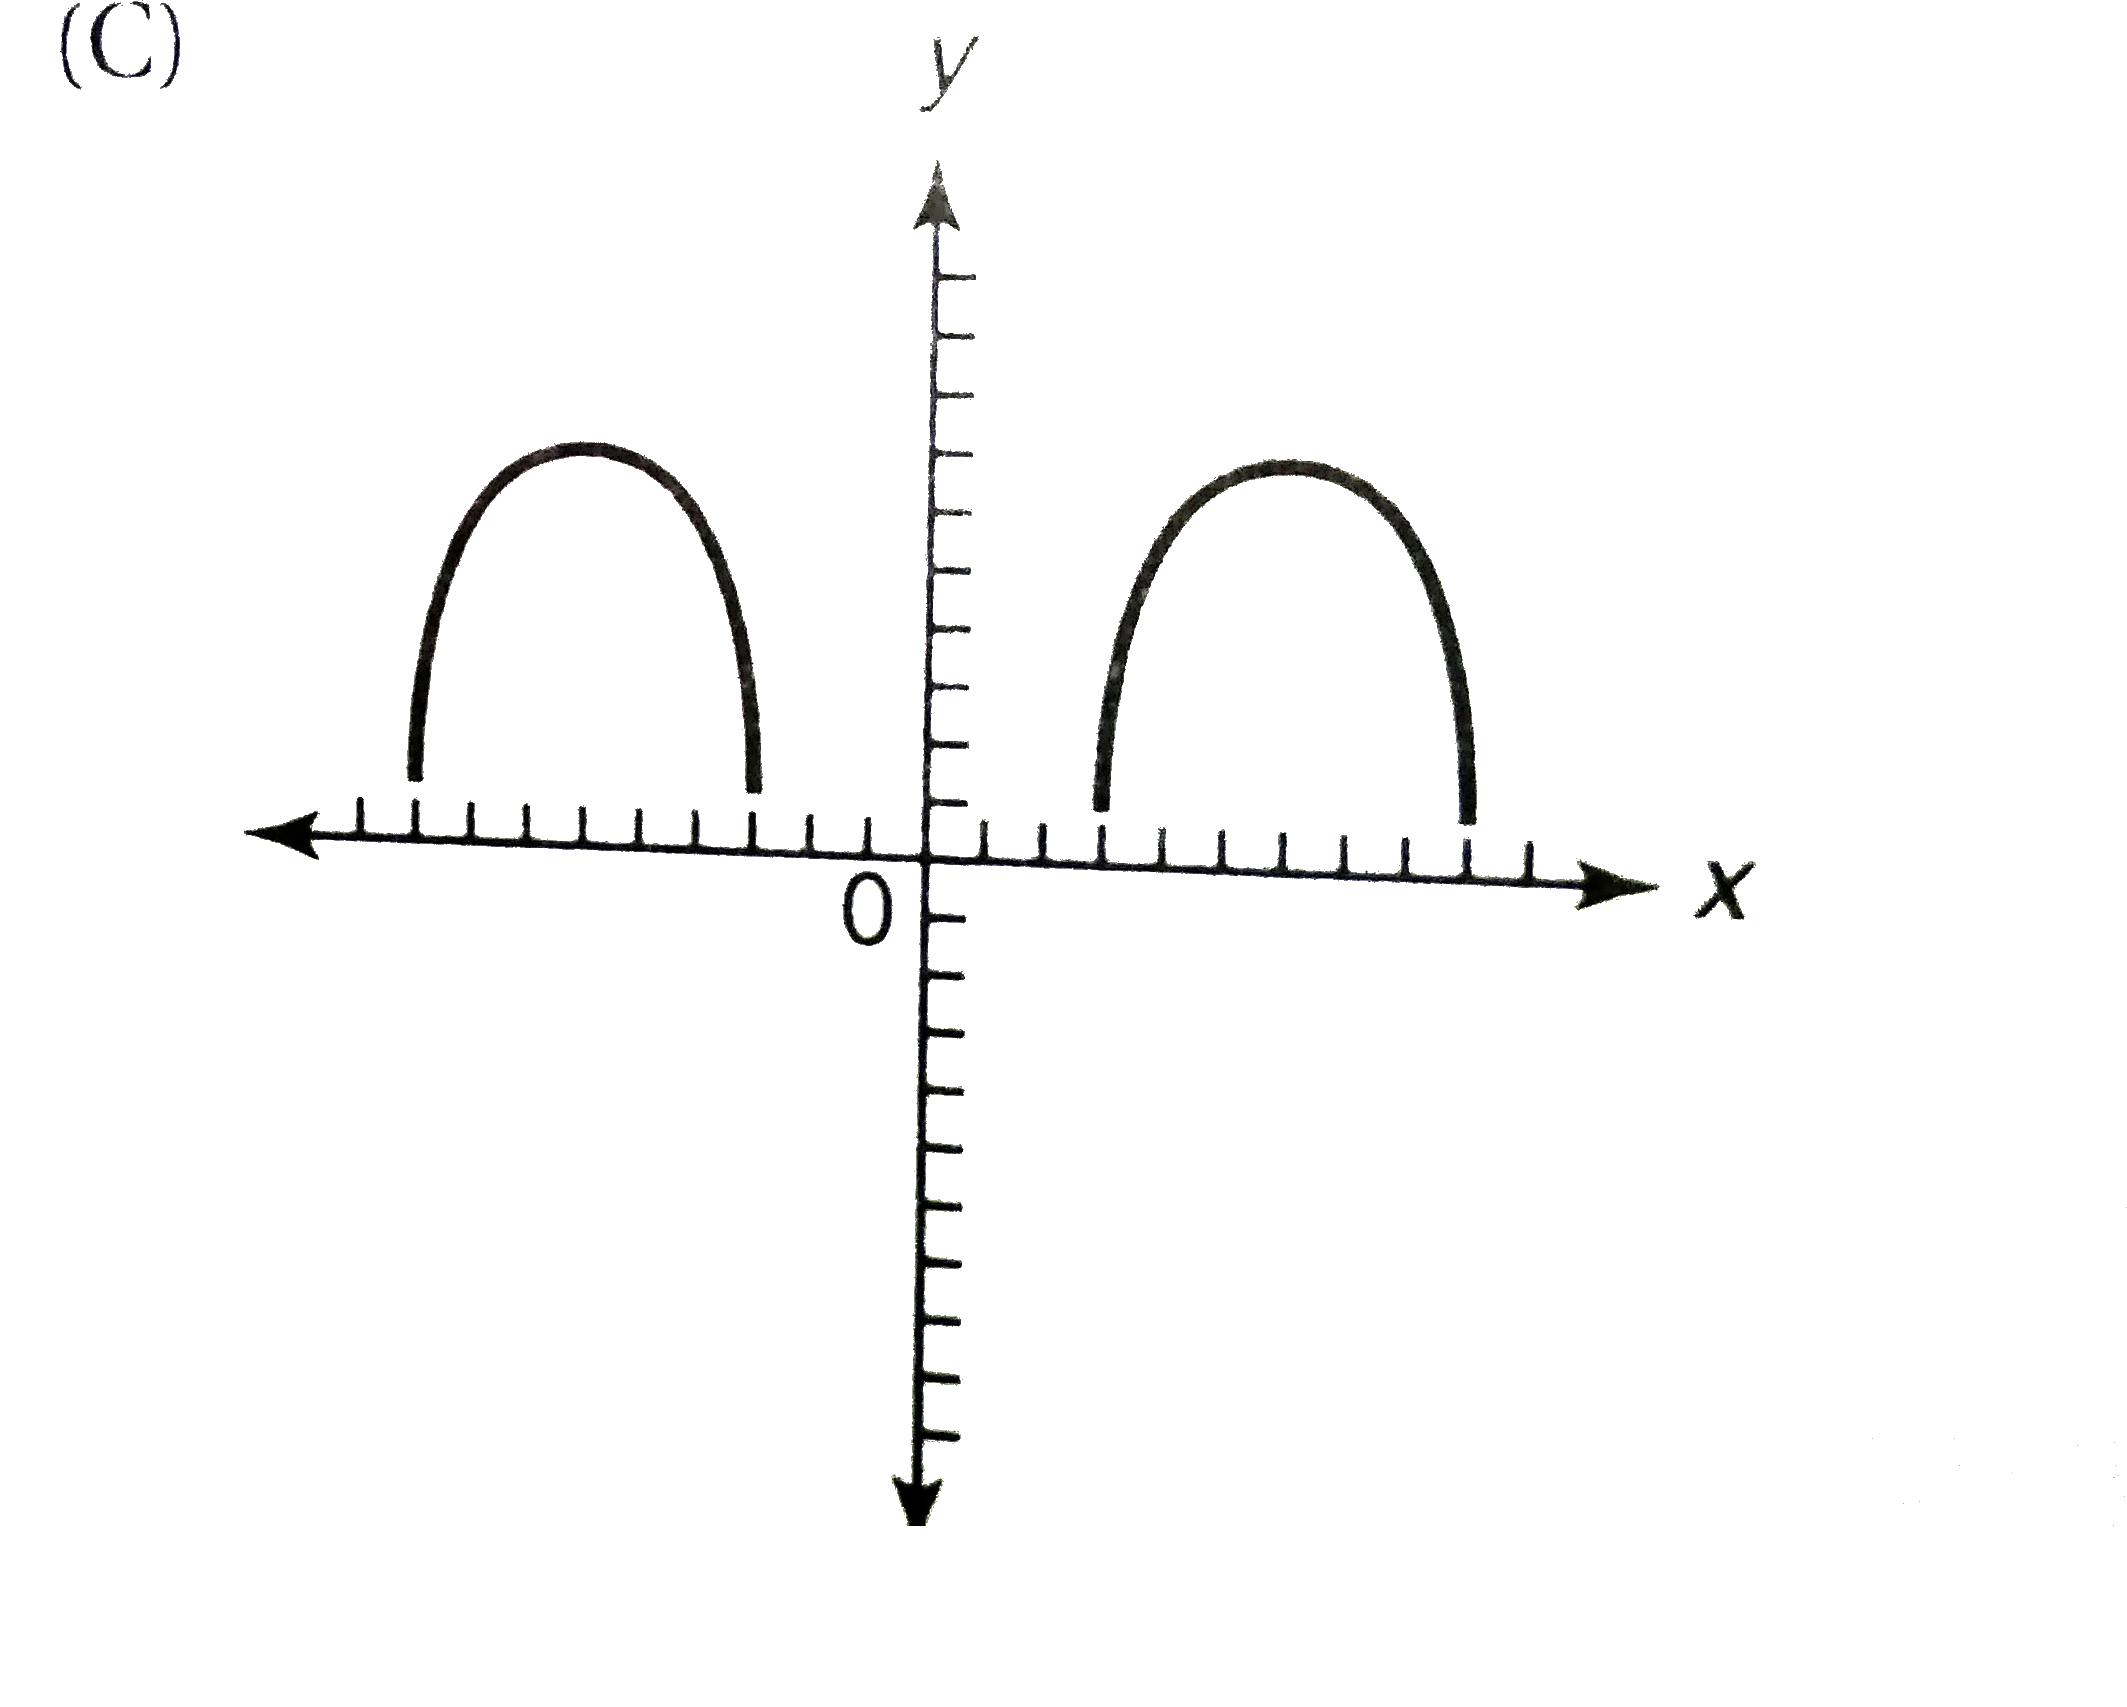 D
D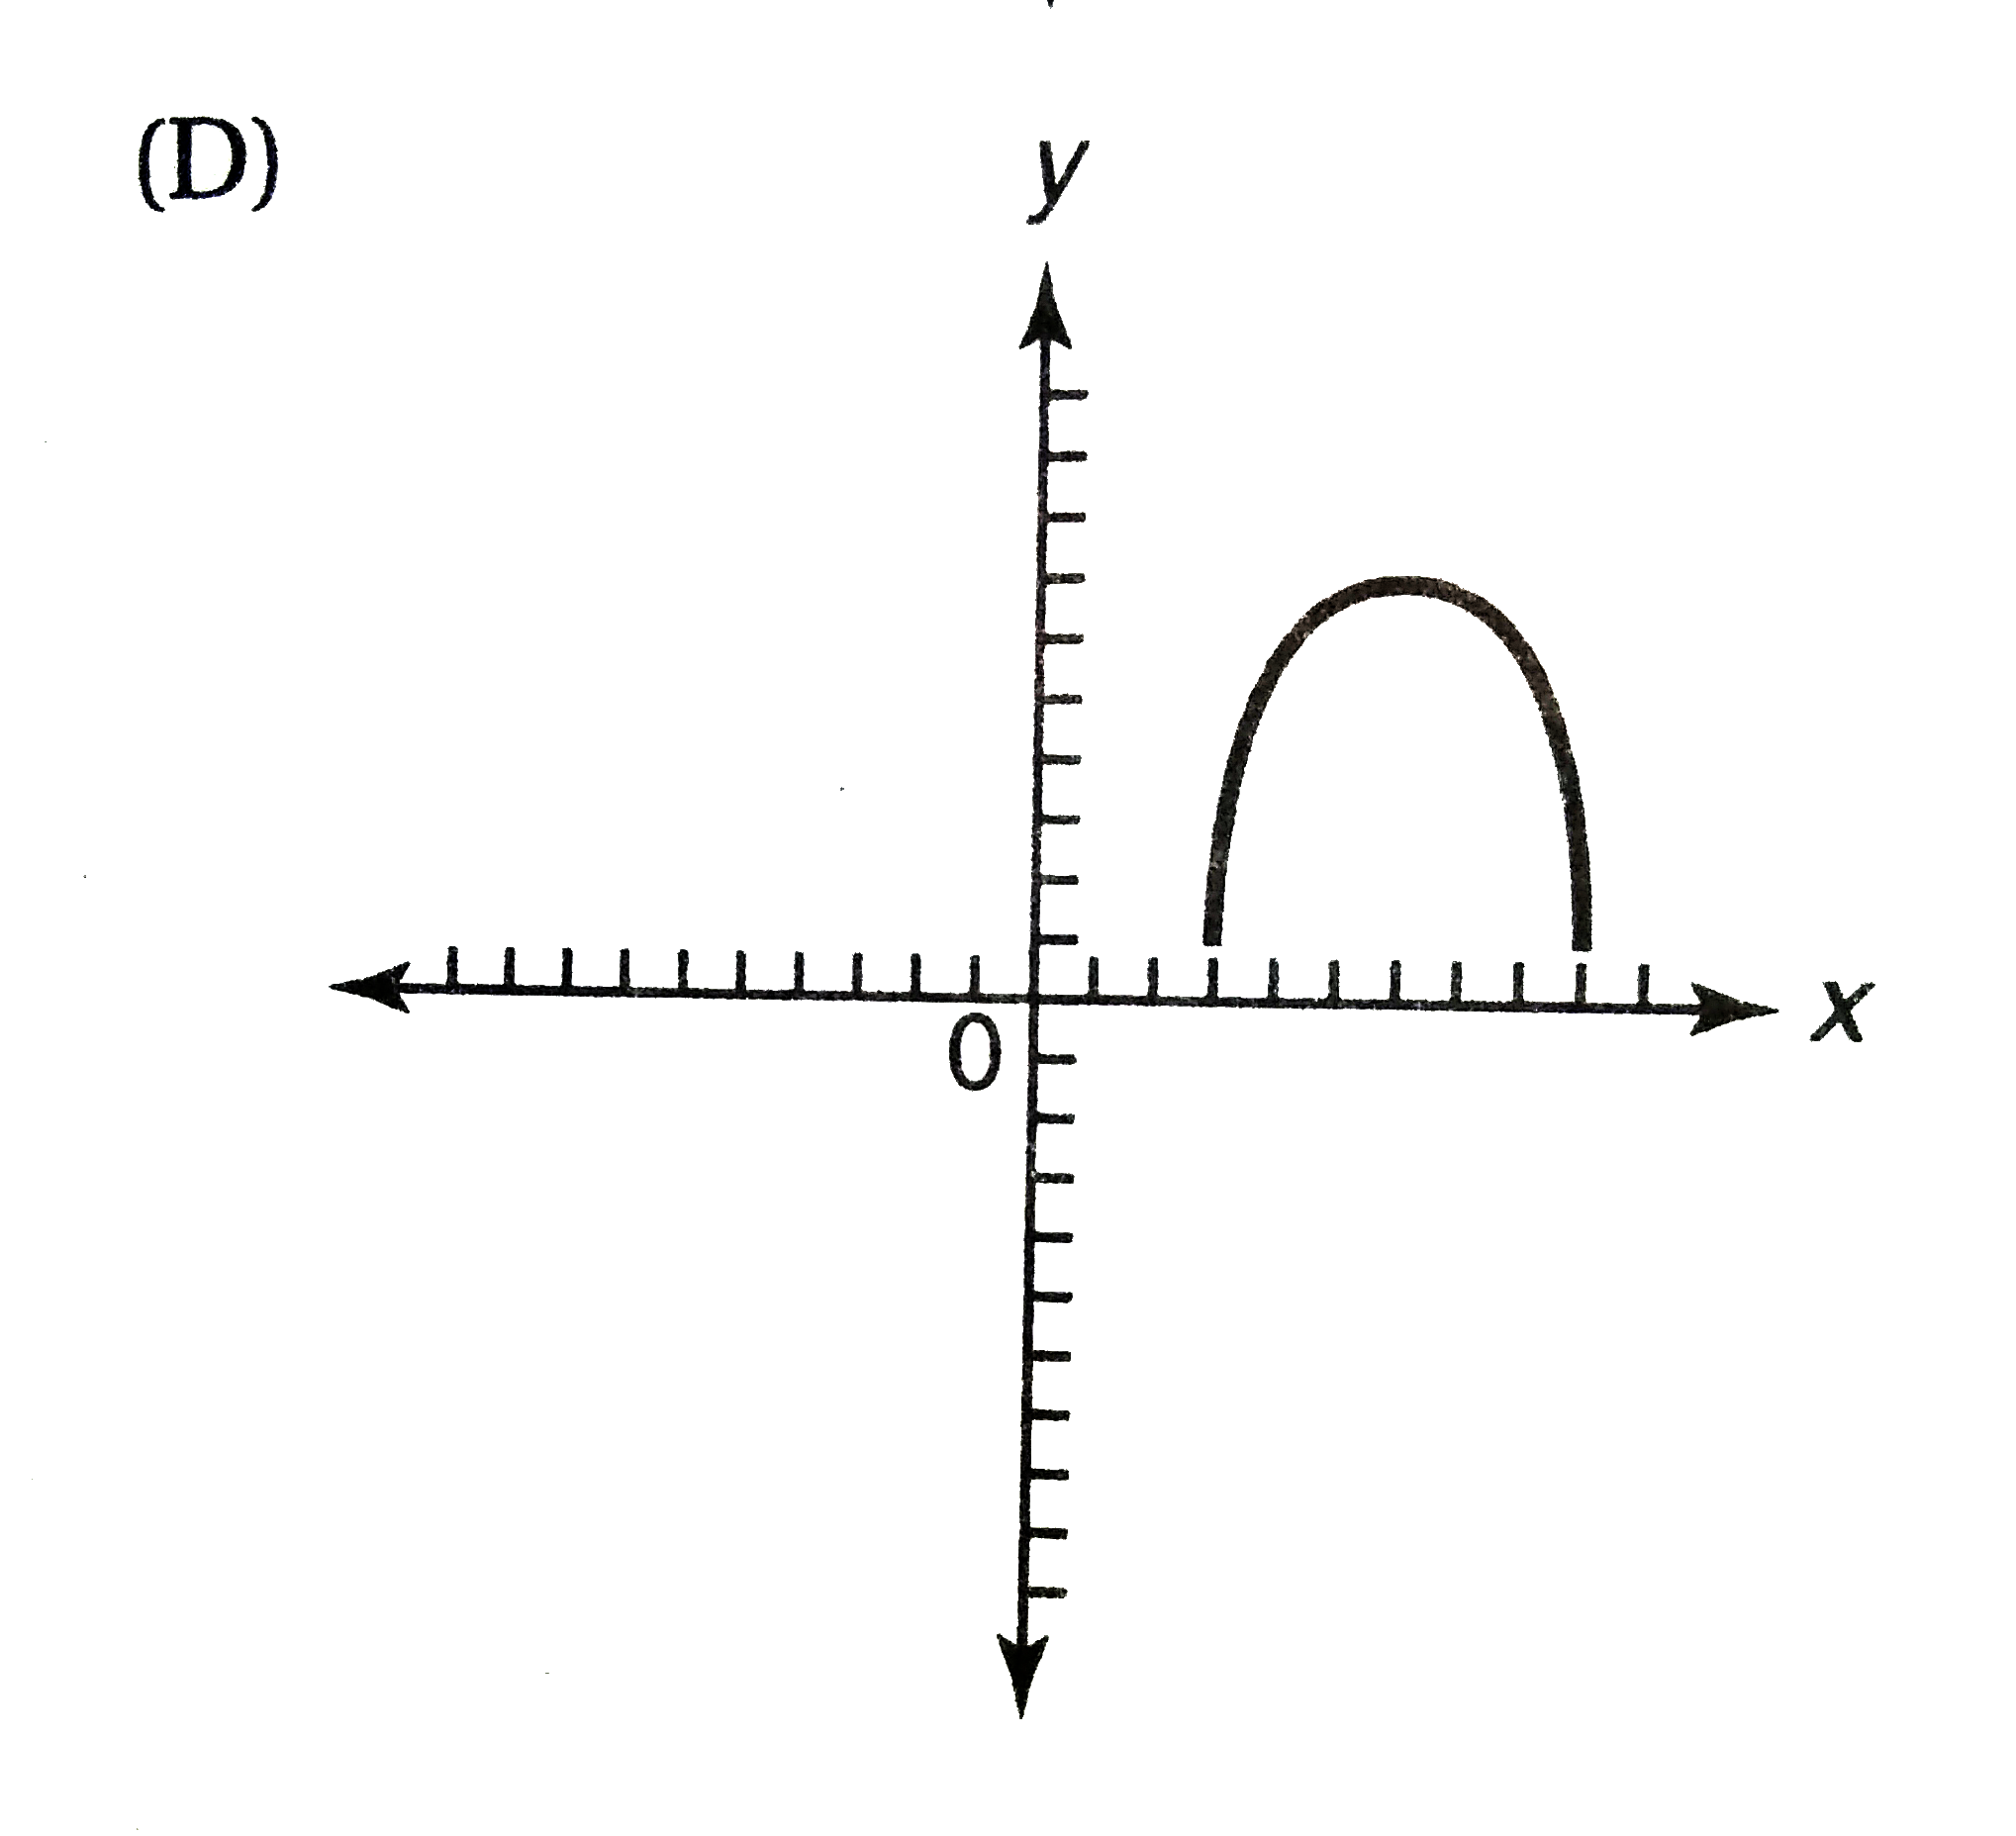
A function f(x) is defined as even if and only if f(x)=f(−x) for all real values of x. Which one of the following graphs represents an even function f(x) ?
View Solution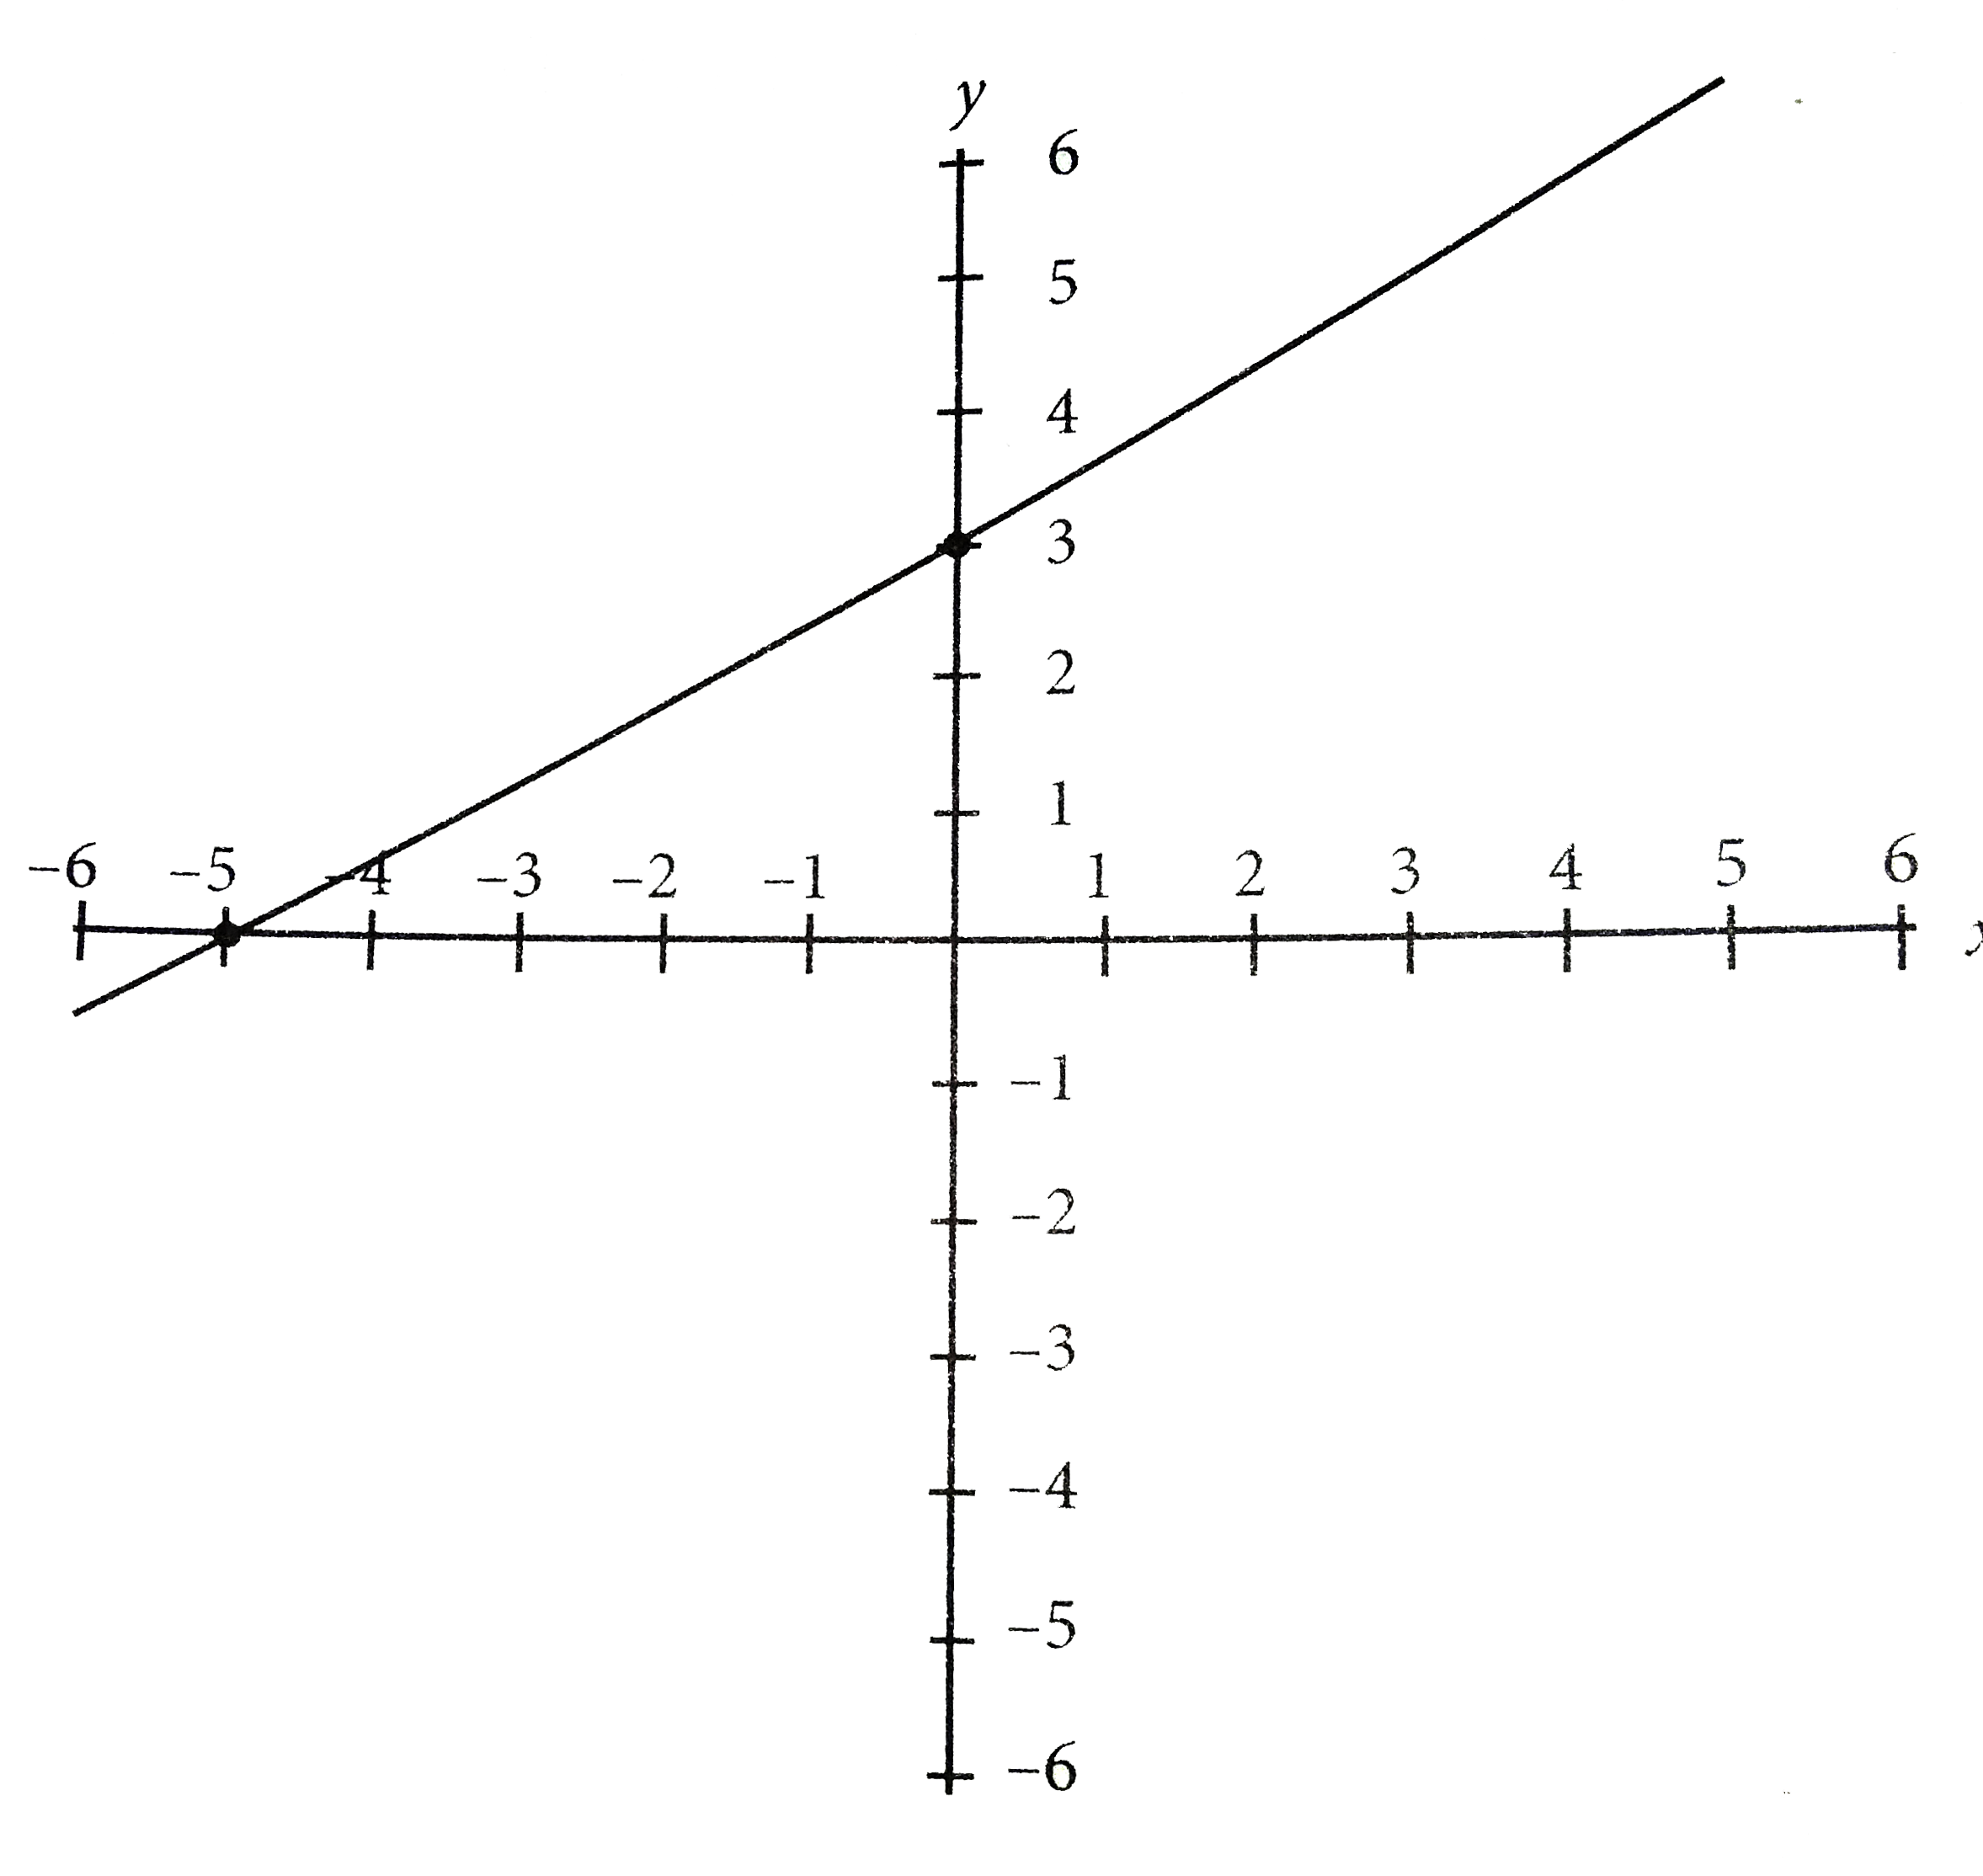
In the figure above, of y=f(x) is shown. Which of the following could be the equation of f(x)?
View SolutionThe graph of y=f(x) is shown in the standard (x,y) coordinate plane below with points V,W,X,Y,and Z labeled .
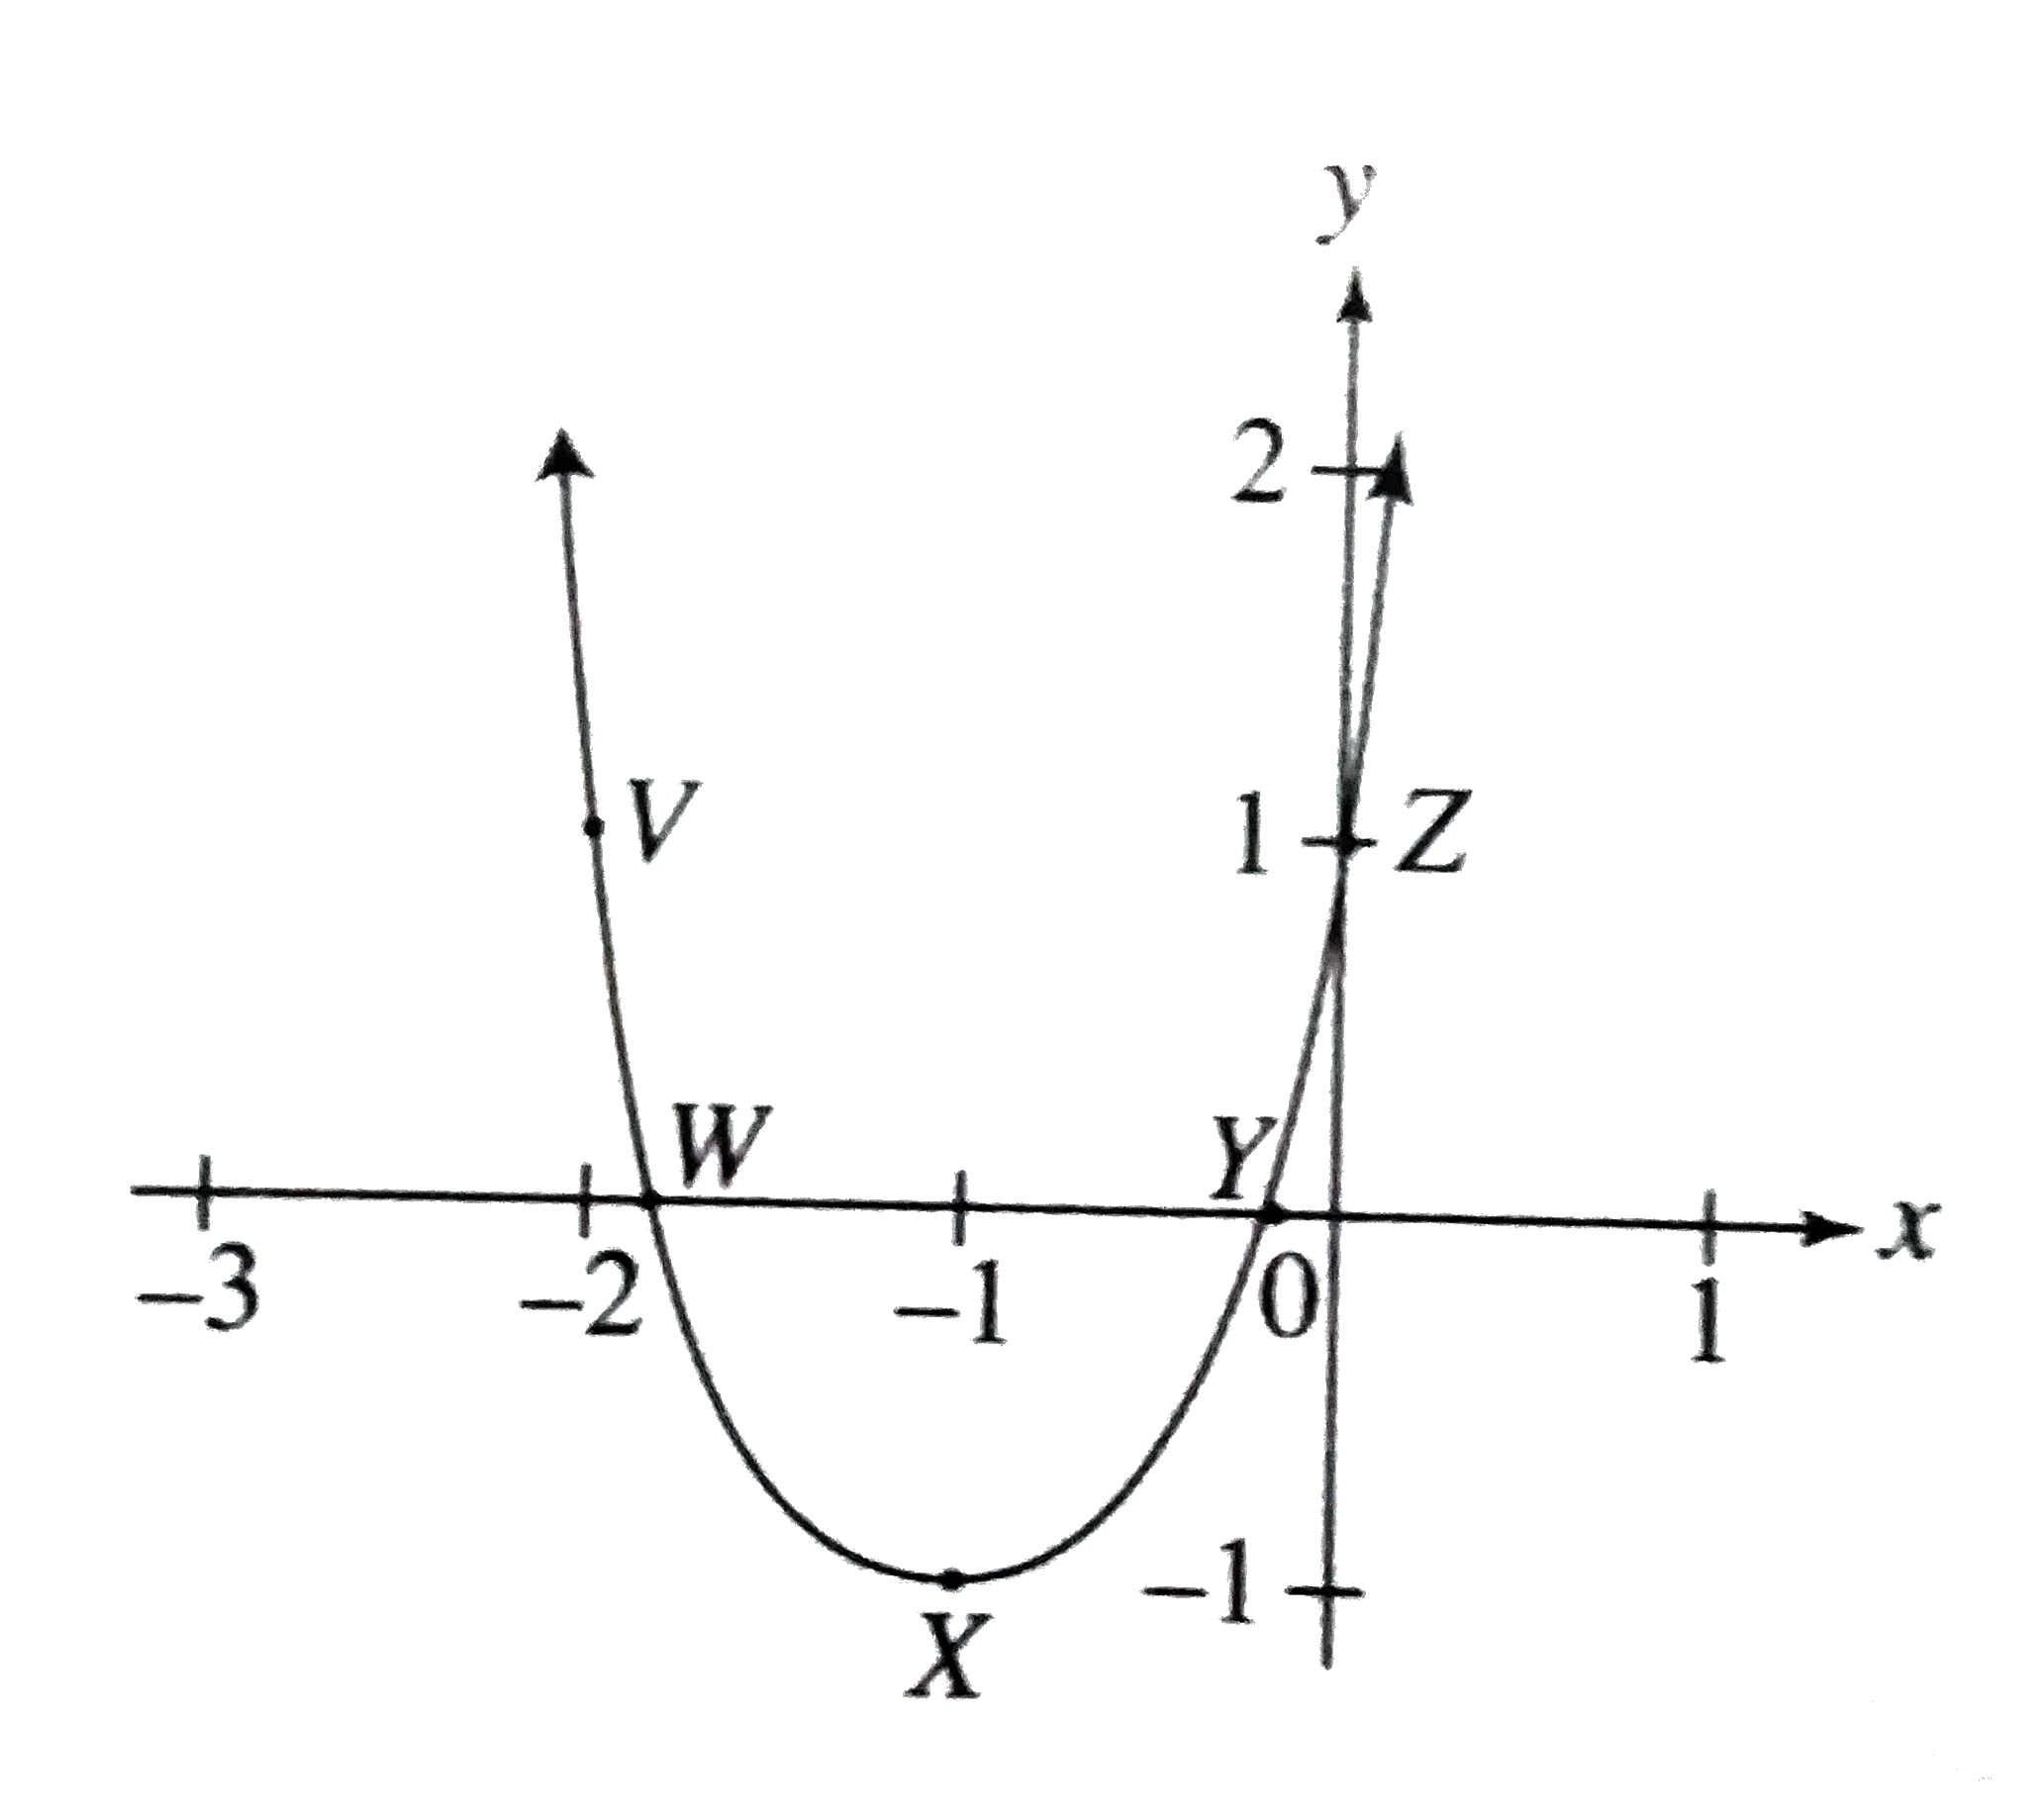
If y=f(x) is to be reflected across the line y=x , which of the following graphs represents the result?
View SolutionThe table shows the values of the quadratic functions f for several values of x. Which one of the following best represents f?
x−101 2f(x) 131−5
View Solution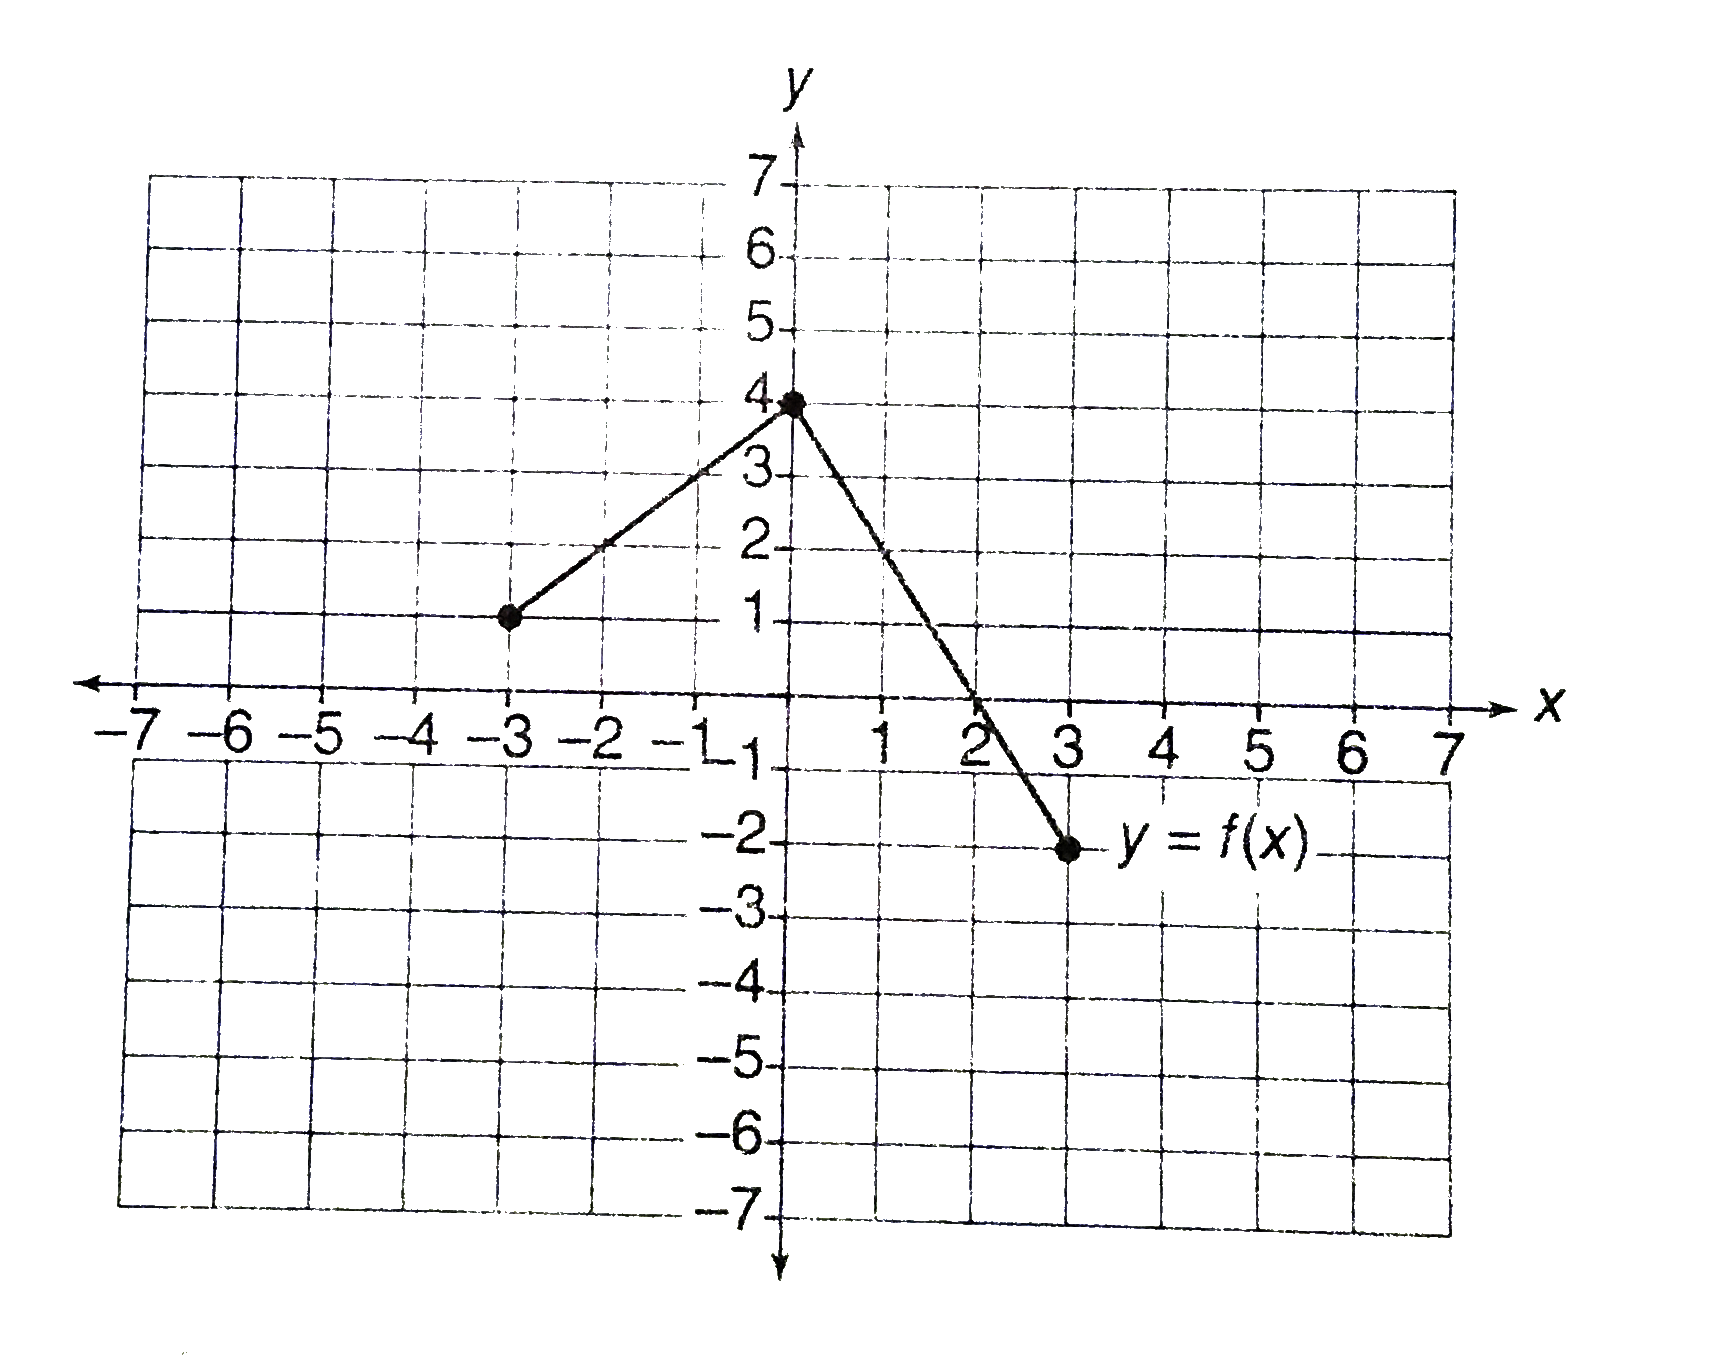
If the accomanying figure above shows the graph of function f, which of the following could represent the graph of y=f(x+1)?
View Solution

