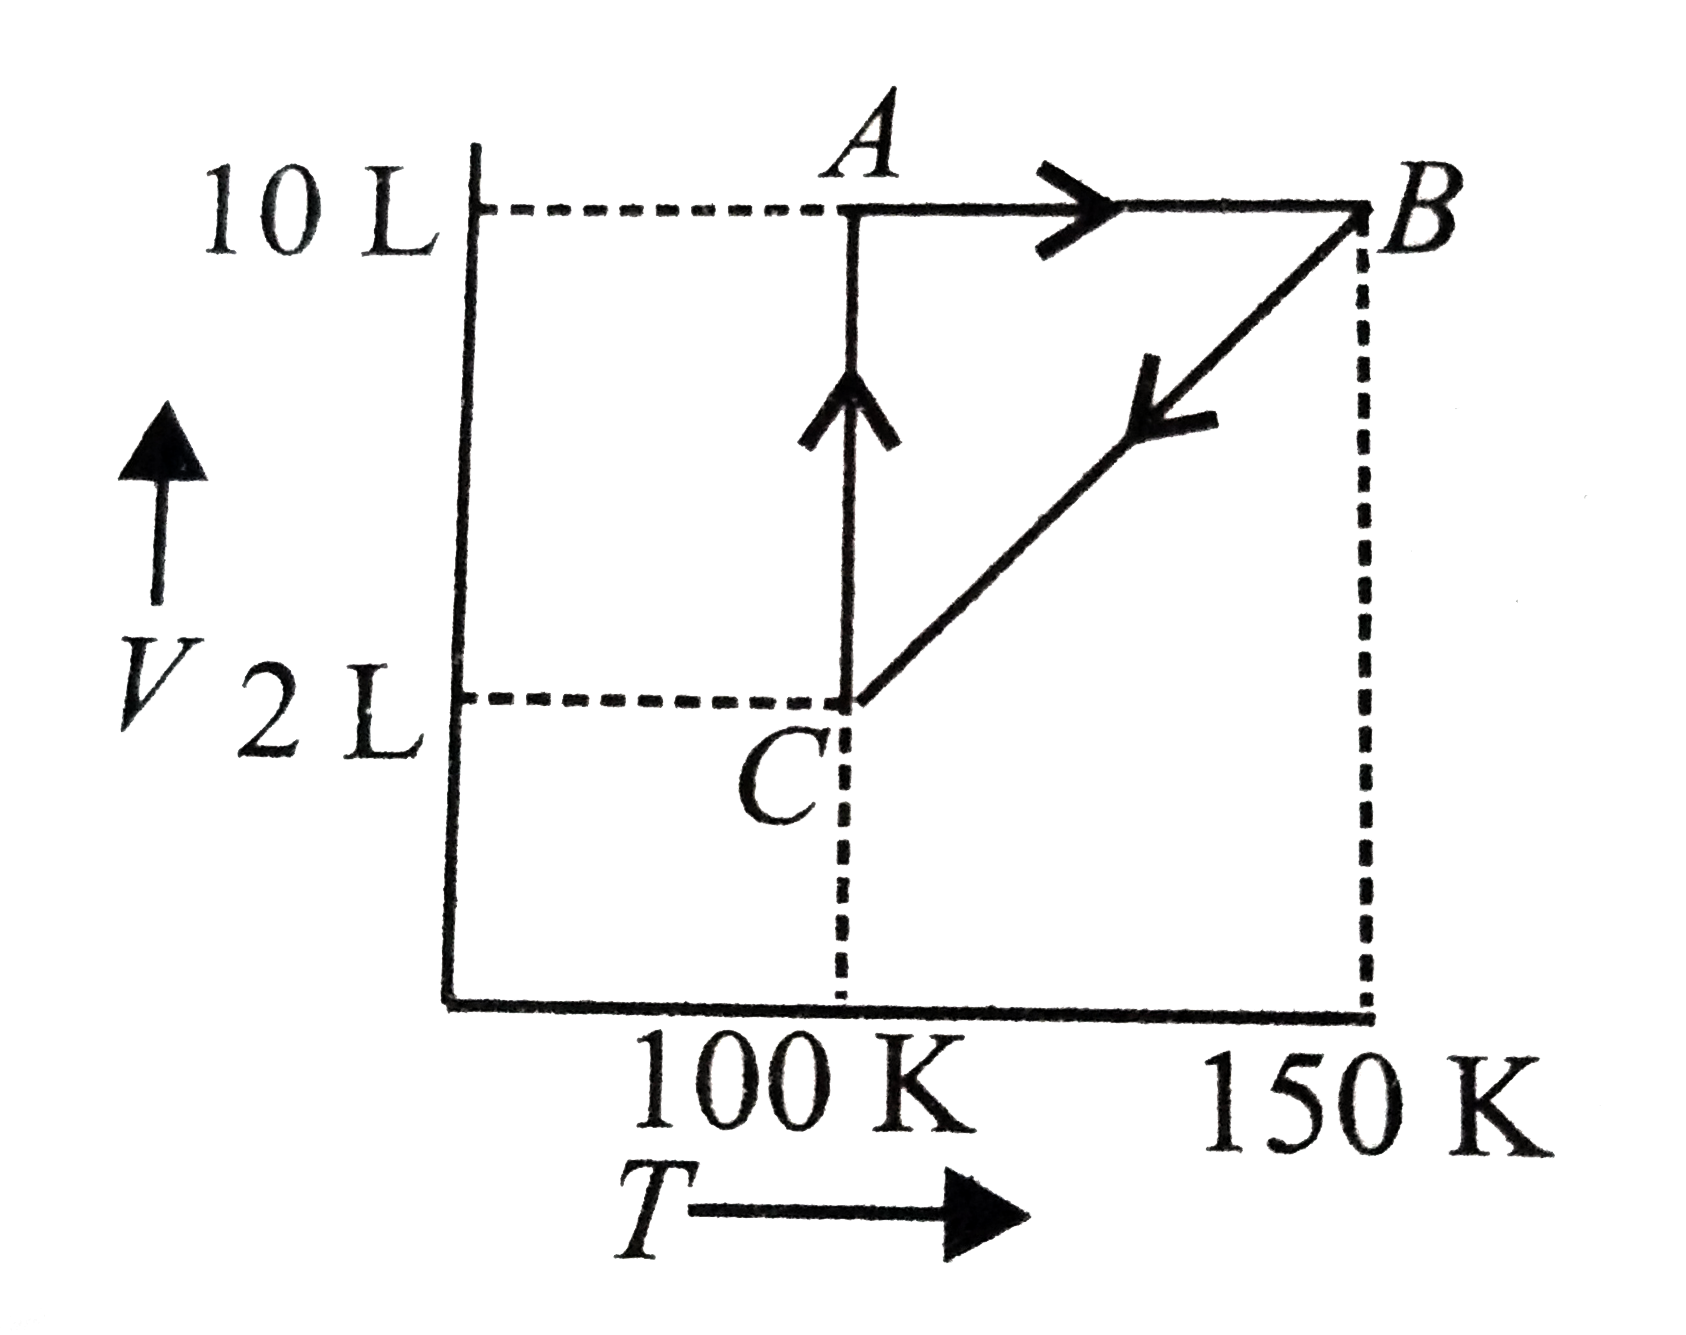
Graph for one mole gas is given below
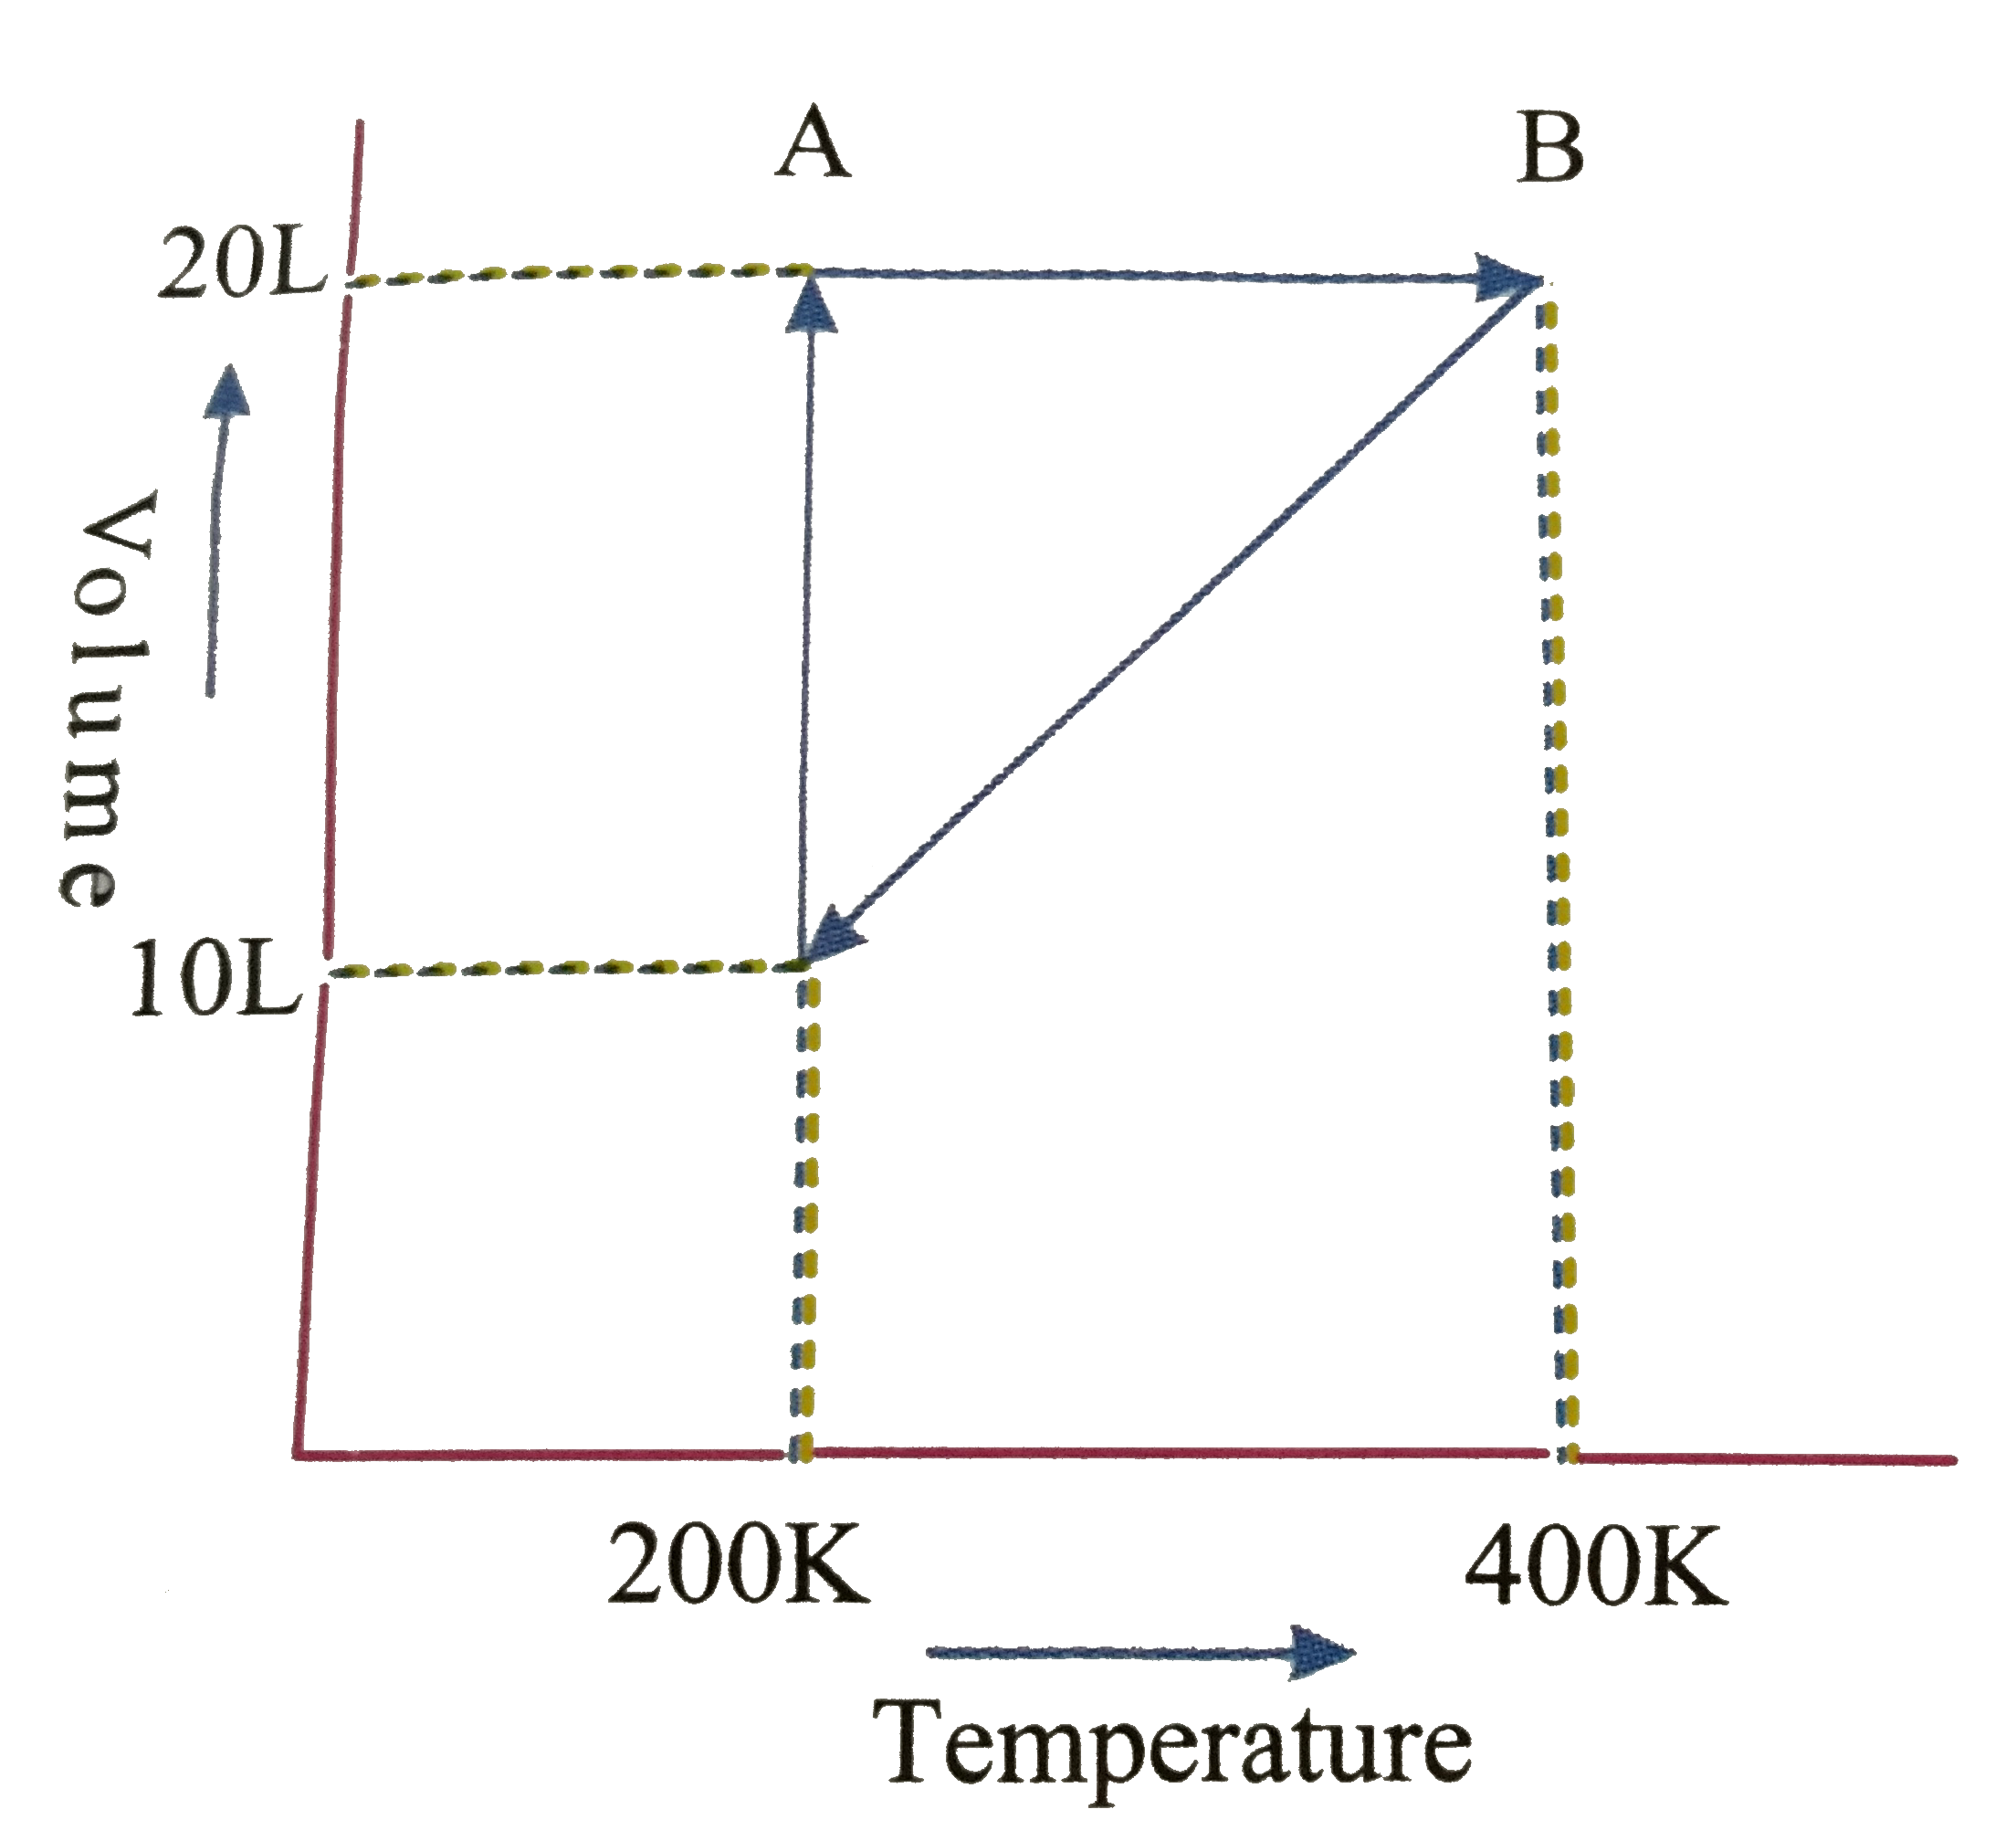
Process, represents
Isobaric
Isochoric
Isothermal
Adiabatic
The correct Answer is:B
Step by step video, text & image solution for Graph for one mole gas is given below Process, A rarr B represents by Chemistry experts to help you in doubts & scoring excellent marks in Class 11 exams.
Topper's Solved these Questions
- BOOK - NARAYNACHAPTER - THERMODYNAMICSEXERCISE - Matching type6videos
THERMODYNAMICS
- BOOK - NARAYNACHAPTER - THERMODYNAMICSEXERCISE - Assertion- Reason5videos
THERMODYNAMICS
- BOOK - NARAYNACHAPTER - THERMODYNAMICSEXERCISE - Level-VI150videos
THERMODYNAMICS
- BOOK - NARAYNACHAPTER - STRUCTURE OF ATOMEXERCISE - EXERCISE - IV EXEMPLAR PROBLEMS24videos
STRUCTURE OF ATOM
Similar Questions
Knowledge Check
- Question 1 - Select One
Graph for one mole gas is given below
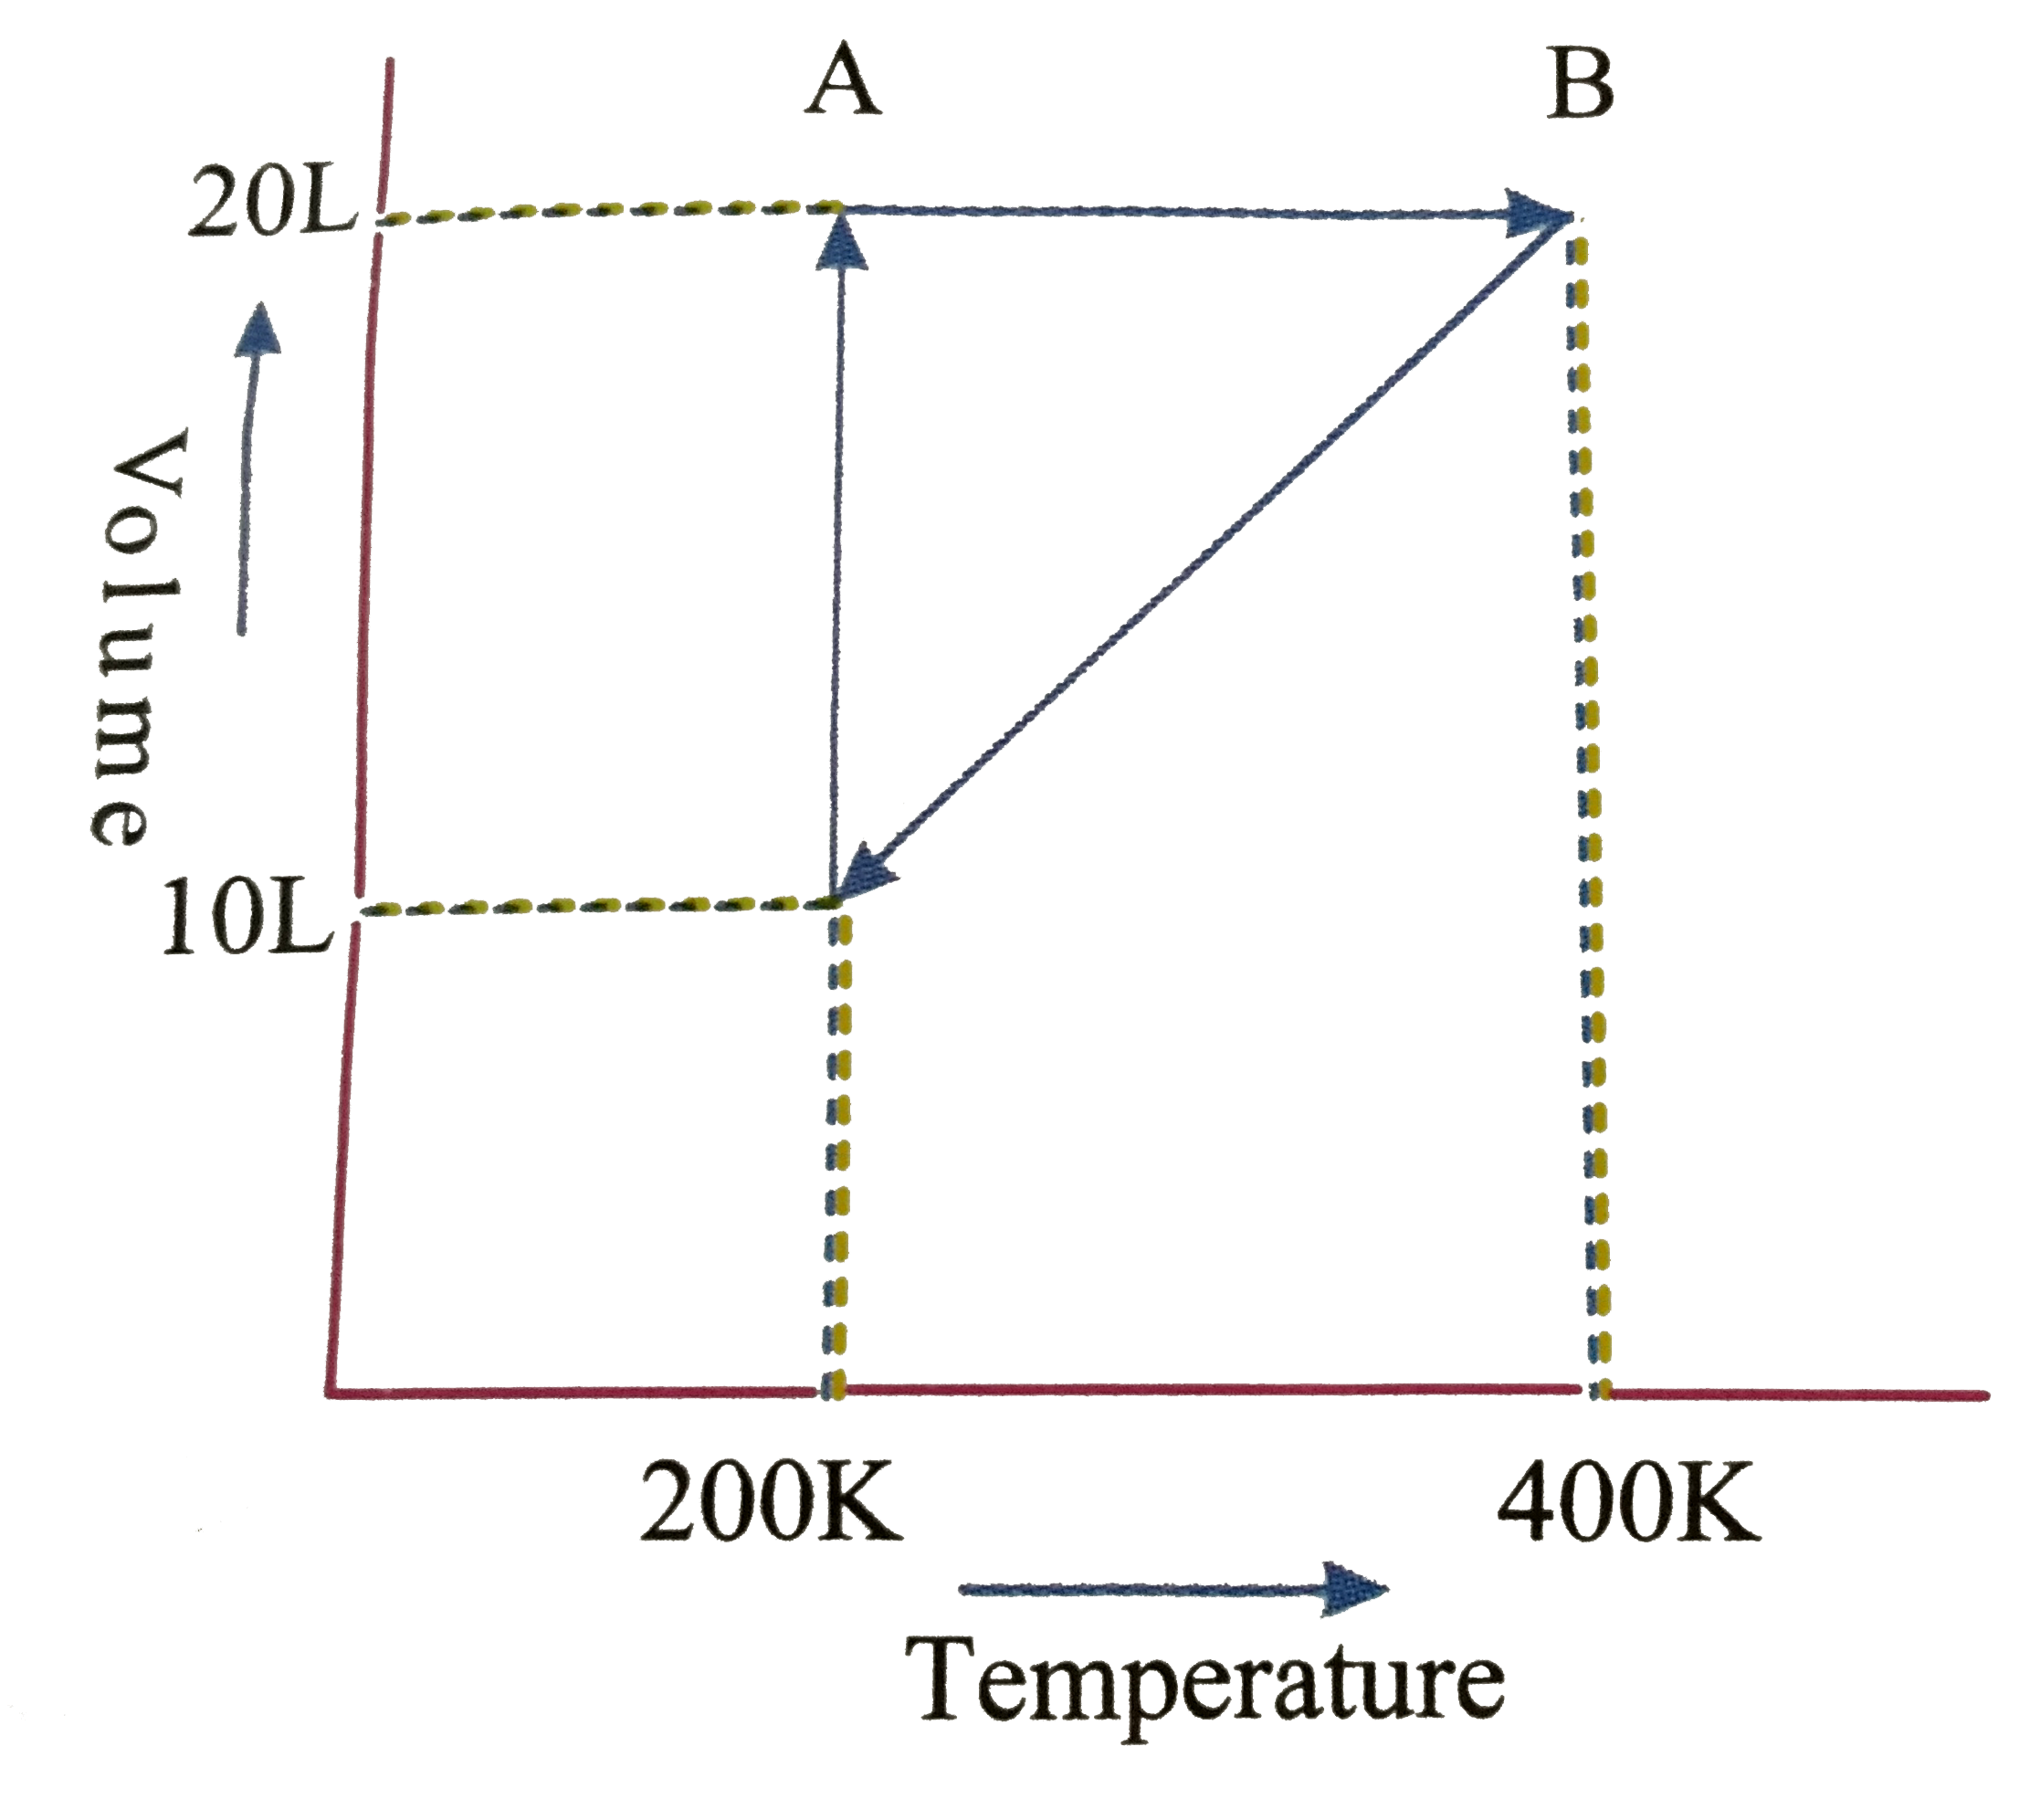
The pressure at C isAZeroB1.642 atmC0.0821 atmD0.821 atm - Question 2 - Select One
Graph for one mole gas is given below
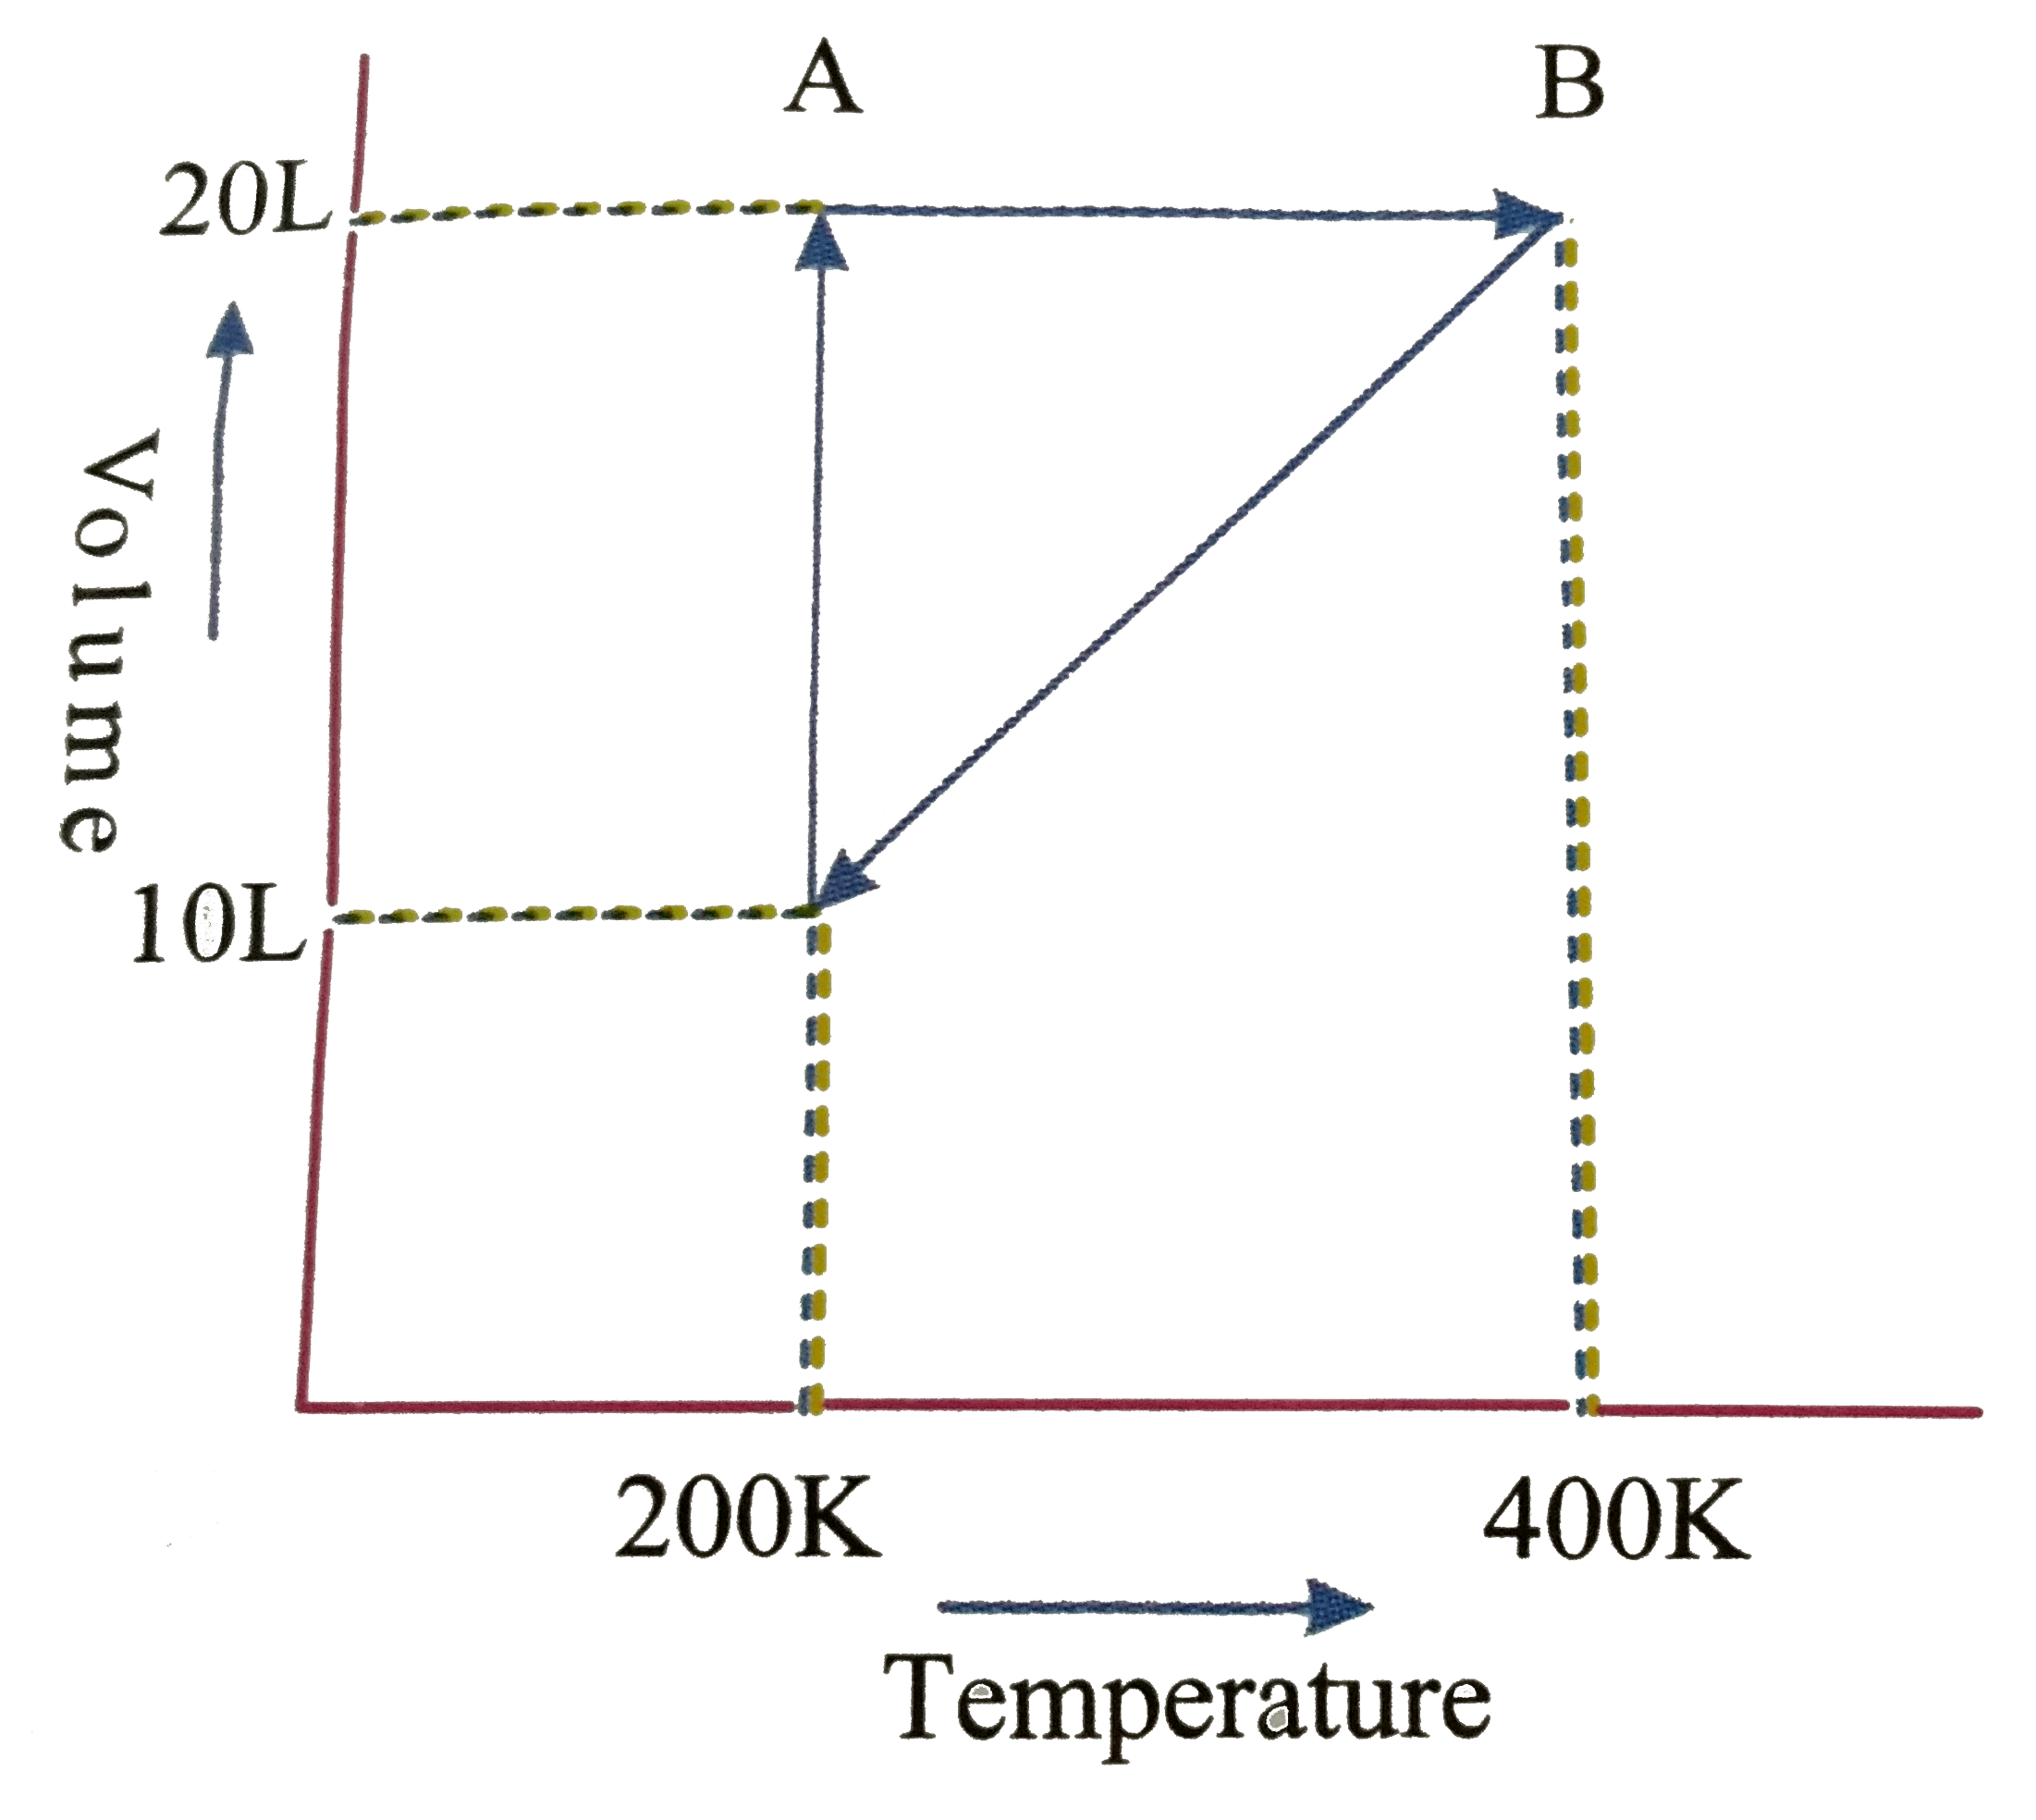
Work done in the process C→A isAZeroB8.21 L atmC16.2 L atmDUnpredictable - Question 3 - Select One
Graph for one mole gas is given below
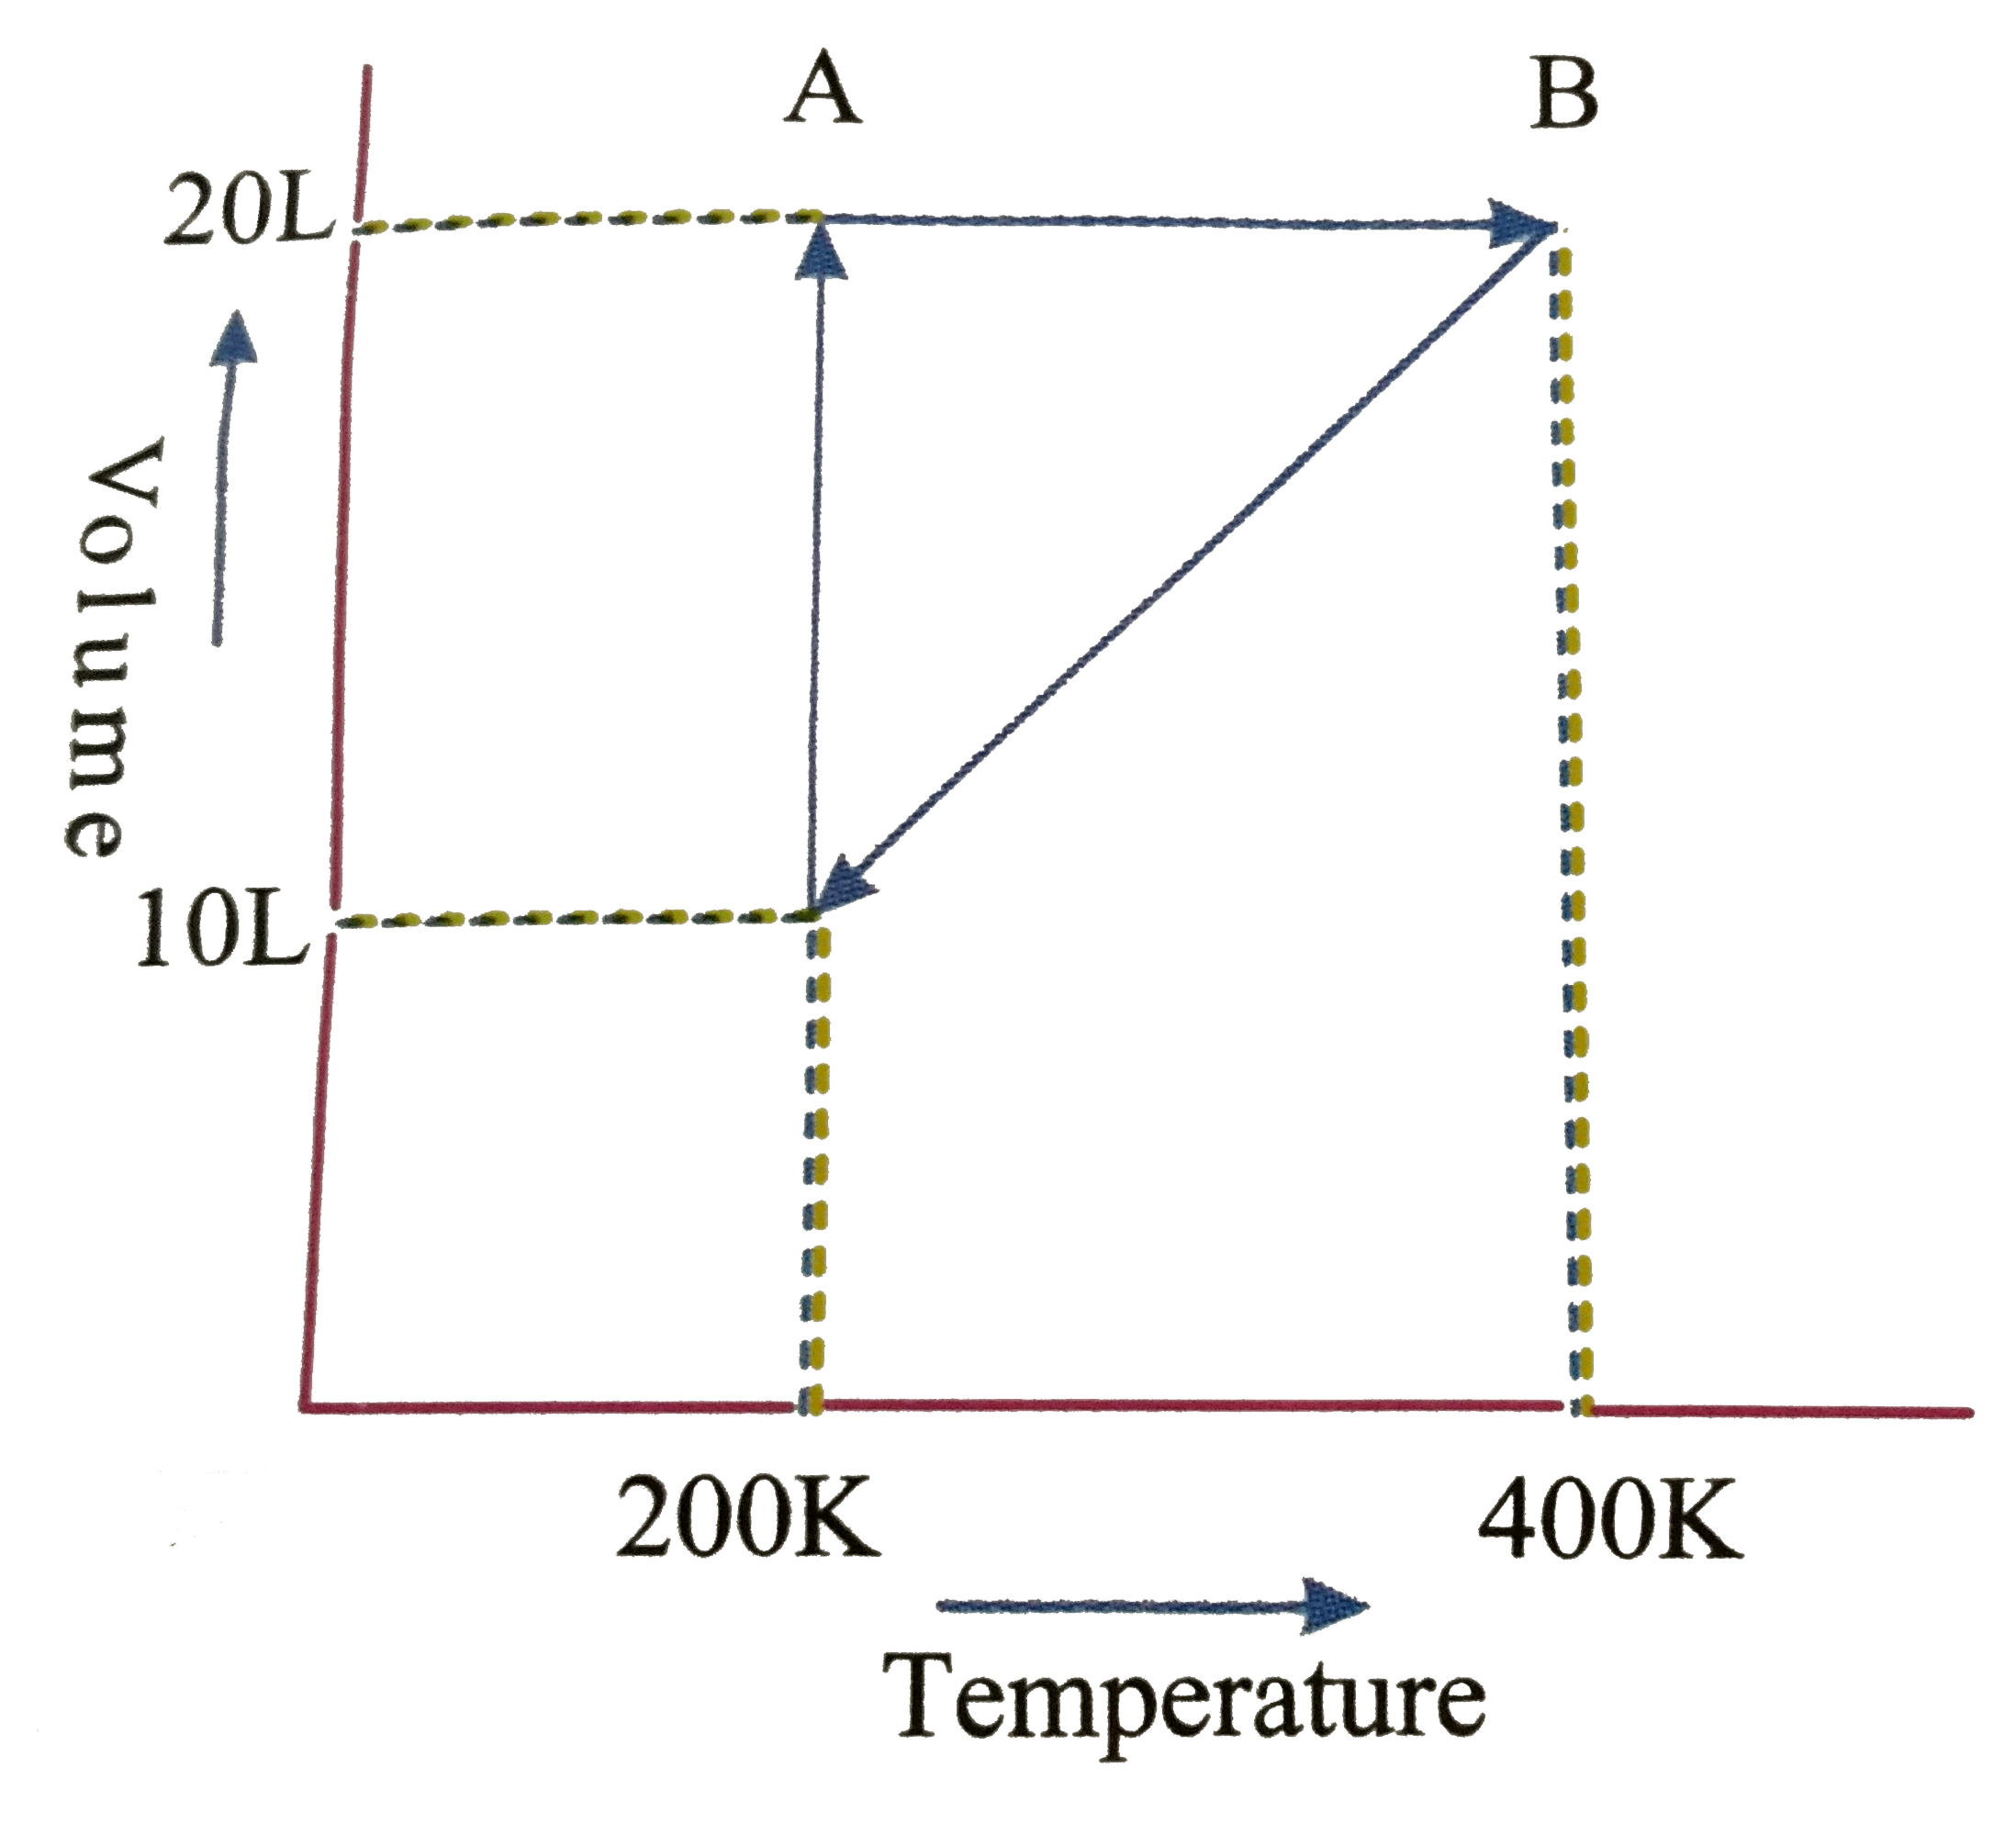
the process which occurs in going from, B→C isAIsothermalBAdiabaticCIsobaricDIsochoric
P-V curve of a diatomic gas is shown in the Fig. Find the total heat given to the gas in the process A→B→C
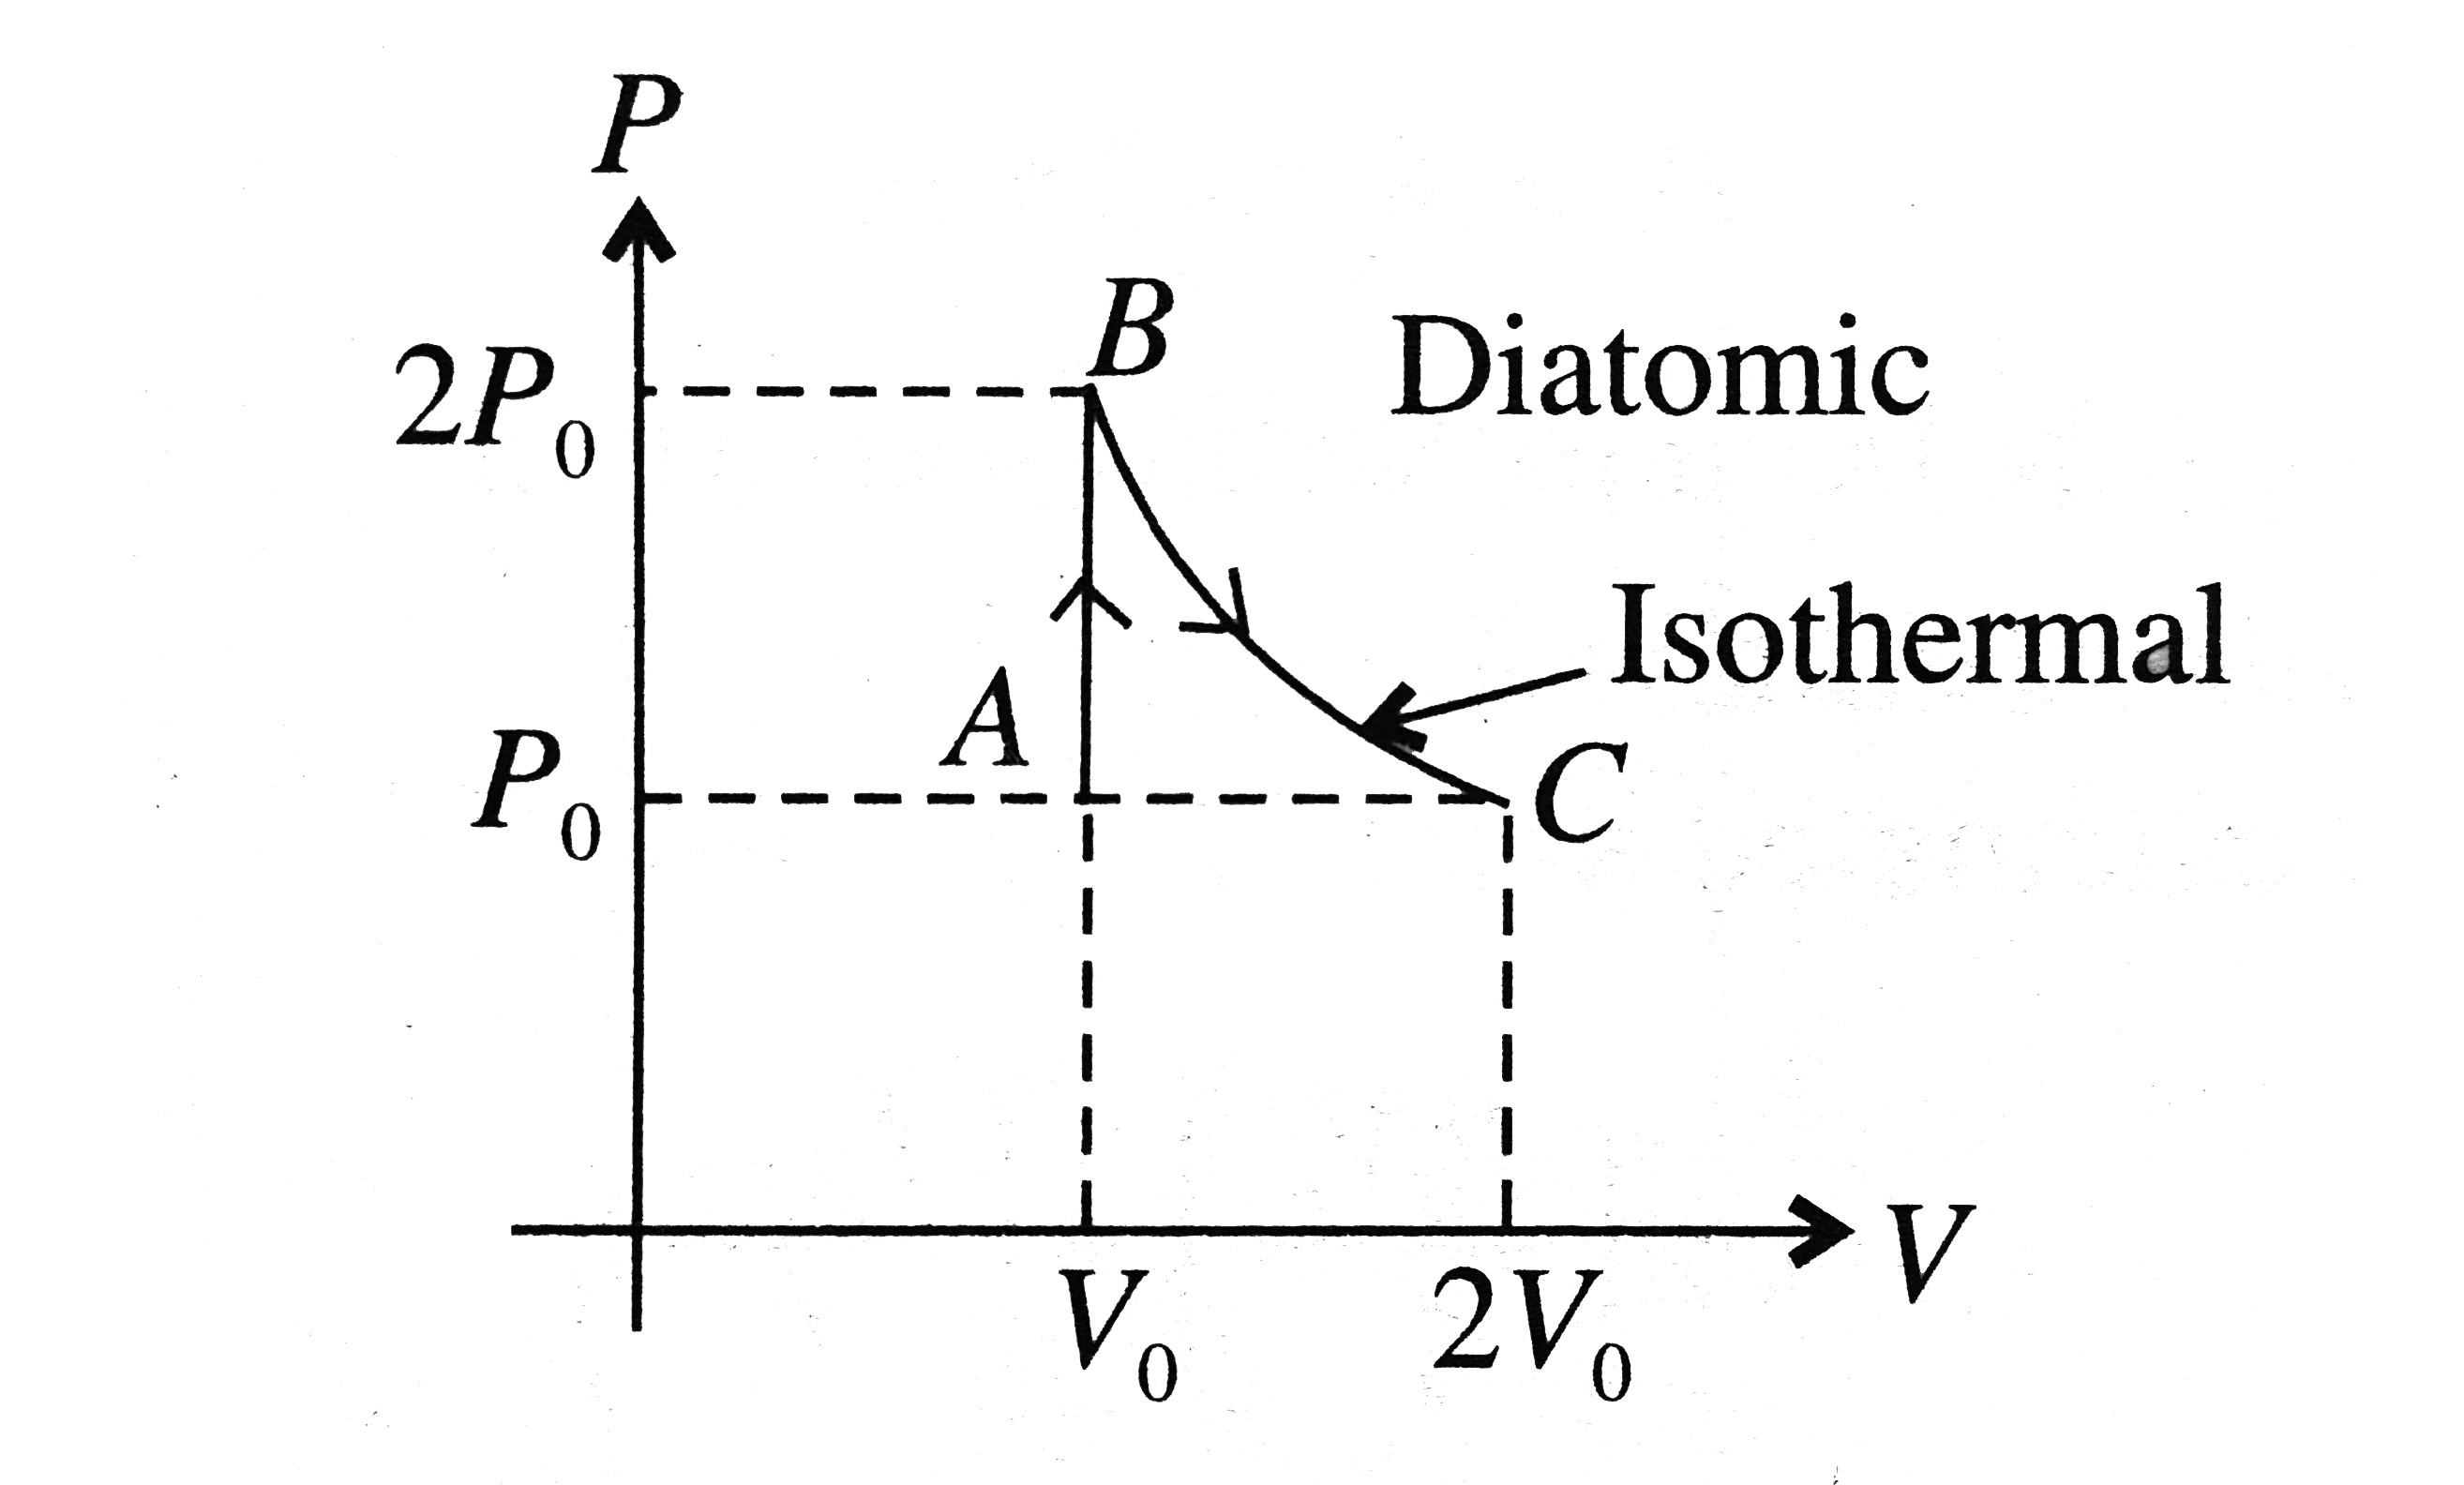 View Solution
An ideal gas undergoes a series of processes represented bya→B→C→D on the P-V diagram. Answer the following questions.
(a) Is the internal energy of the gas at B and D equal?
(b) Find work done by the gas in the process A rarr B rarr C rarr D.
(c) Is it right to say that point B and D lie on an isotherm?
(d) Find the ratio of internal energy of the gas in state A to that in state D.
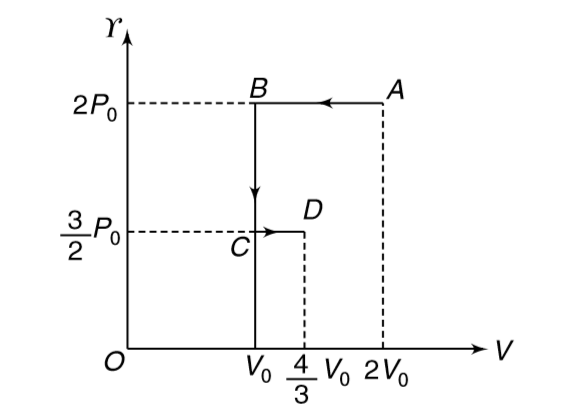 View Solution
The volume vs. temperature graph of 1 mole of an ideal gas is given below
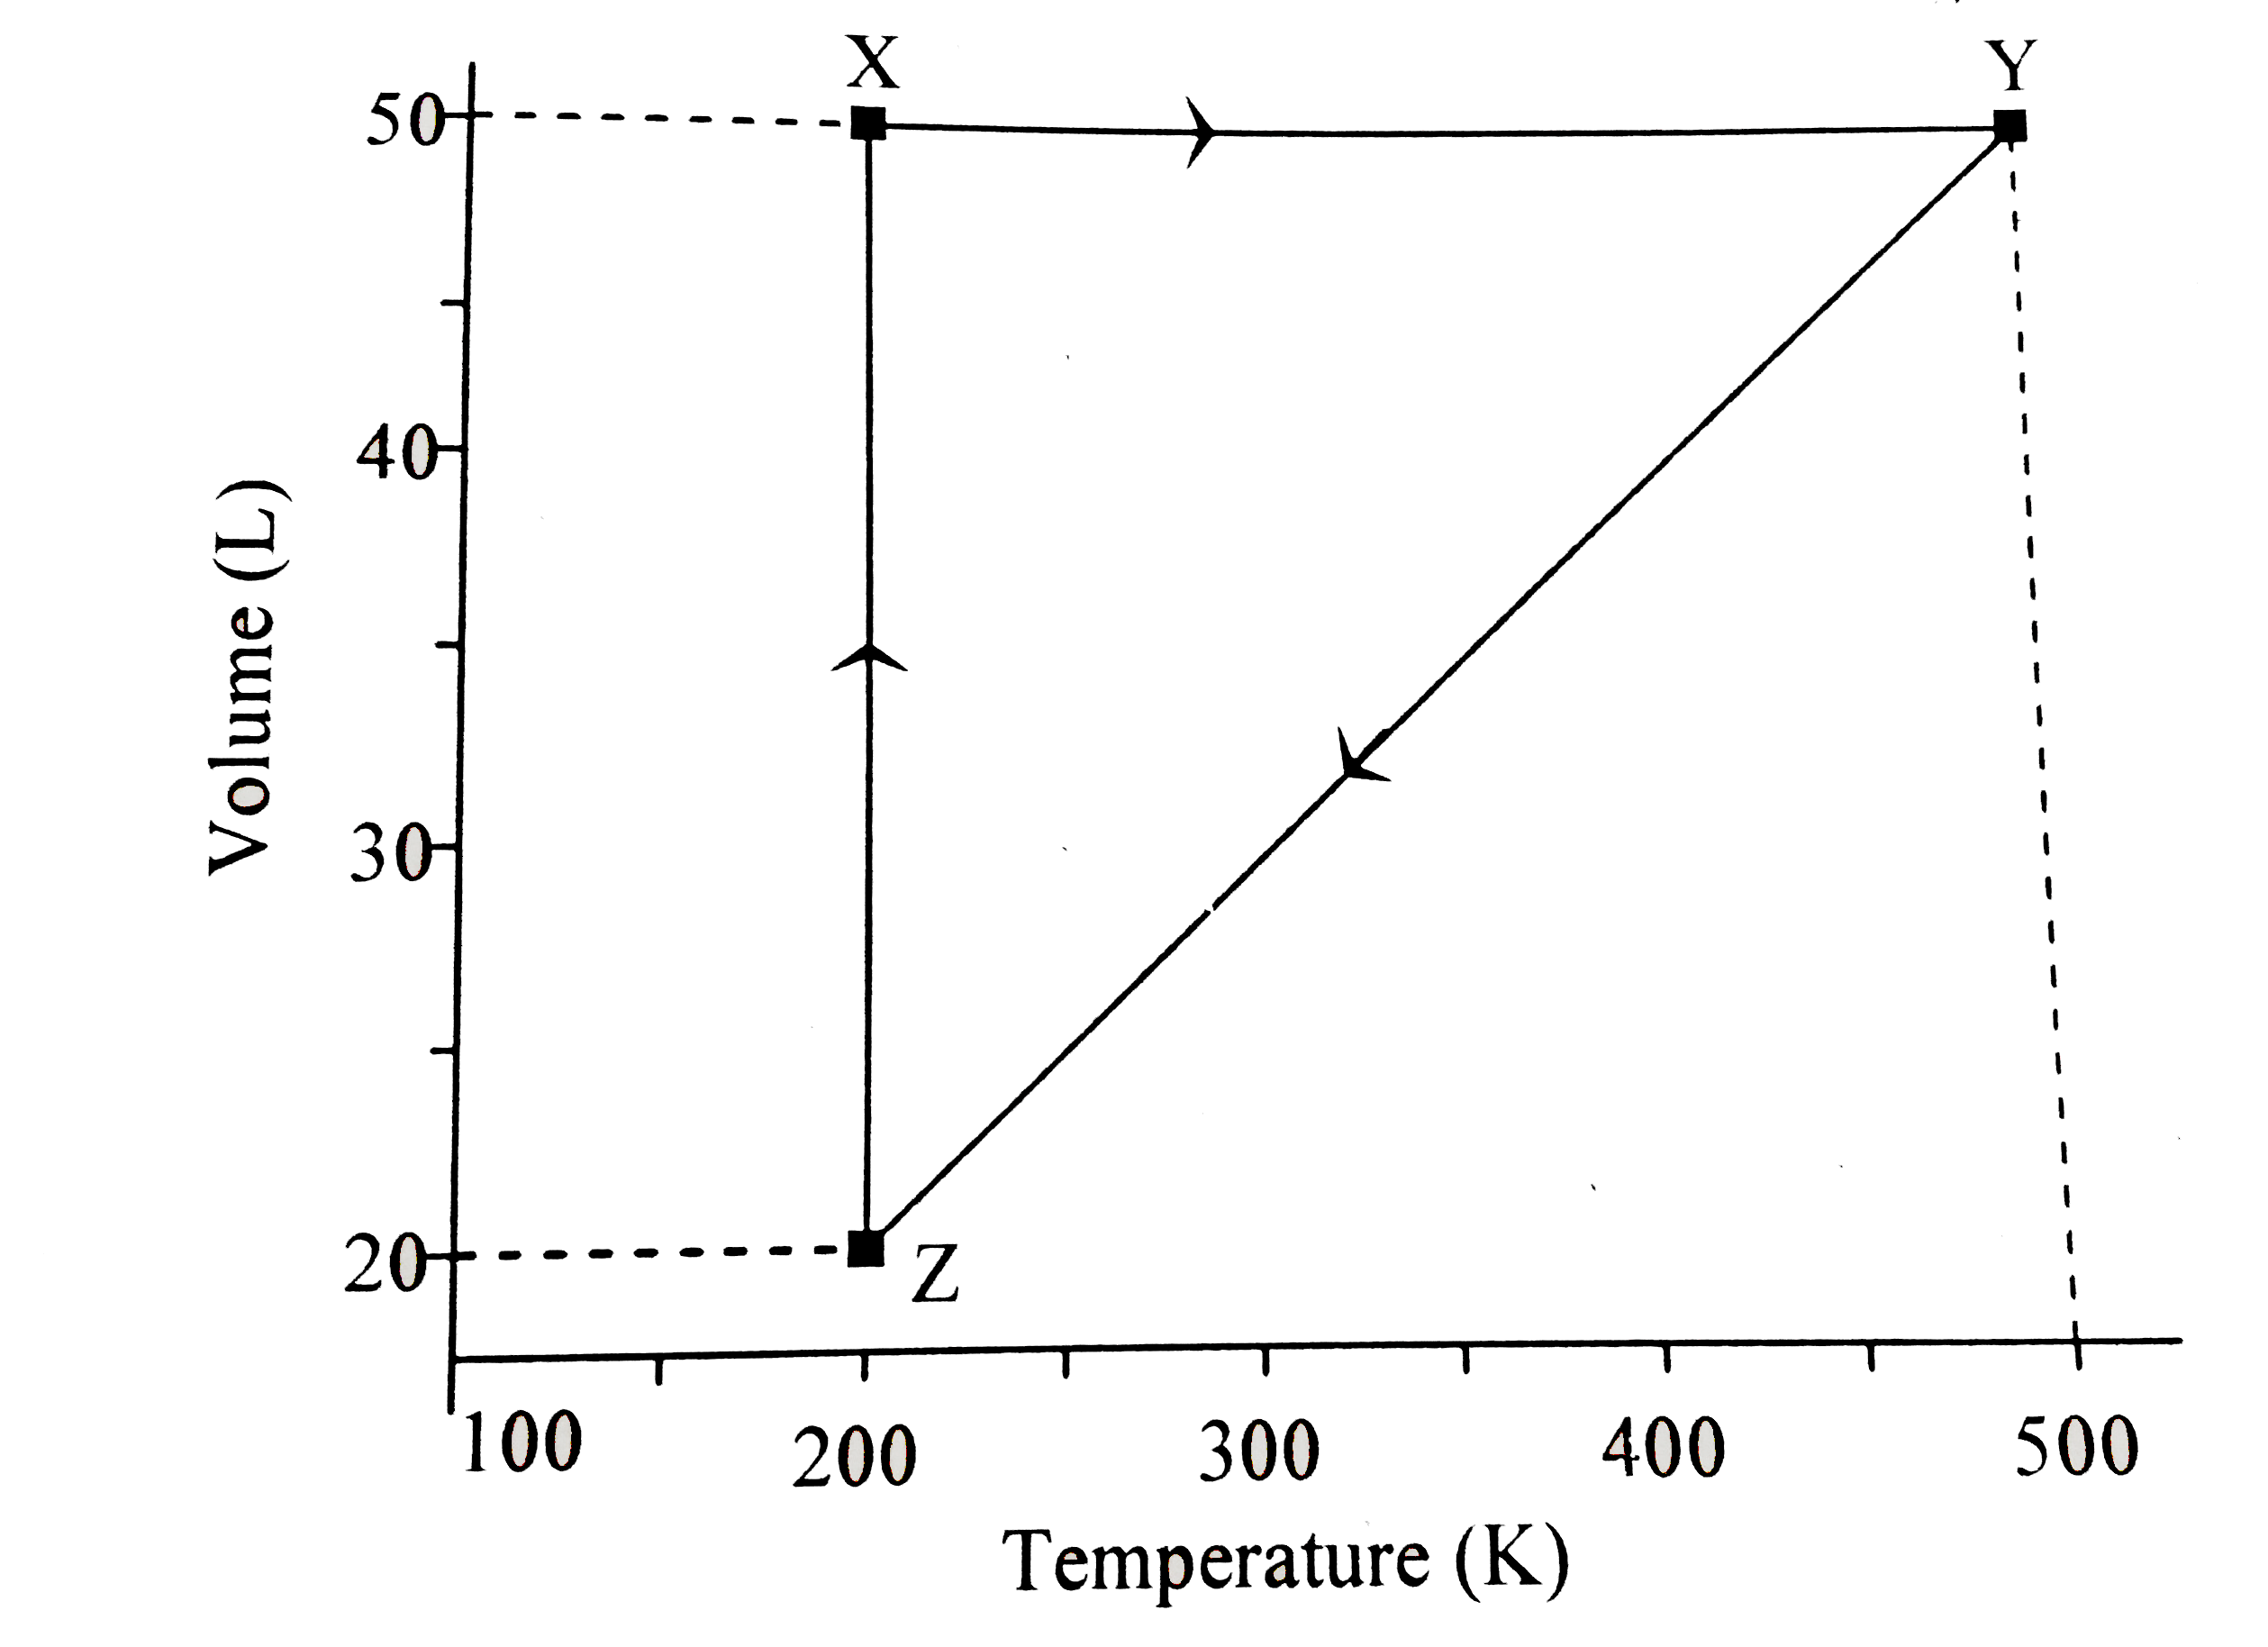
The pressure of the gas (in atm) at X, Y and Z, respectively, areView SolutionThe given graph shows the variation of velocity with displacement. Which one of the graphs given below correctly represents the variation of acceleration with displacement ?
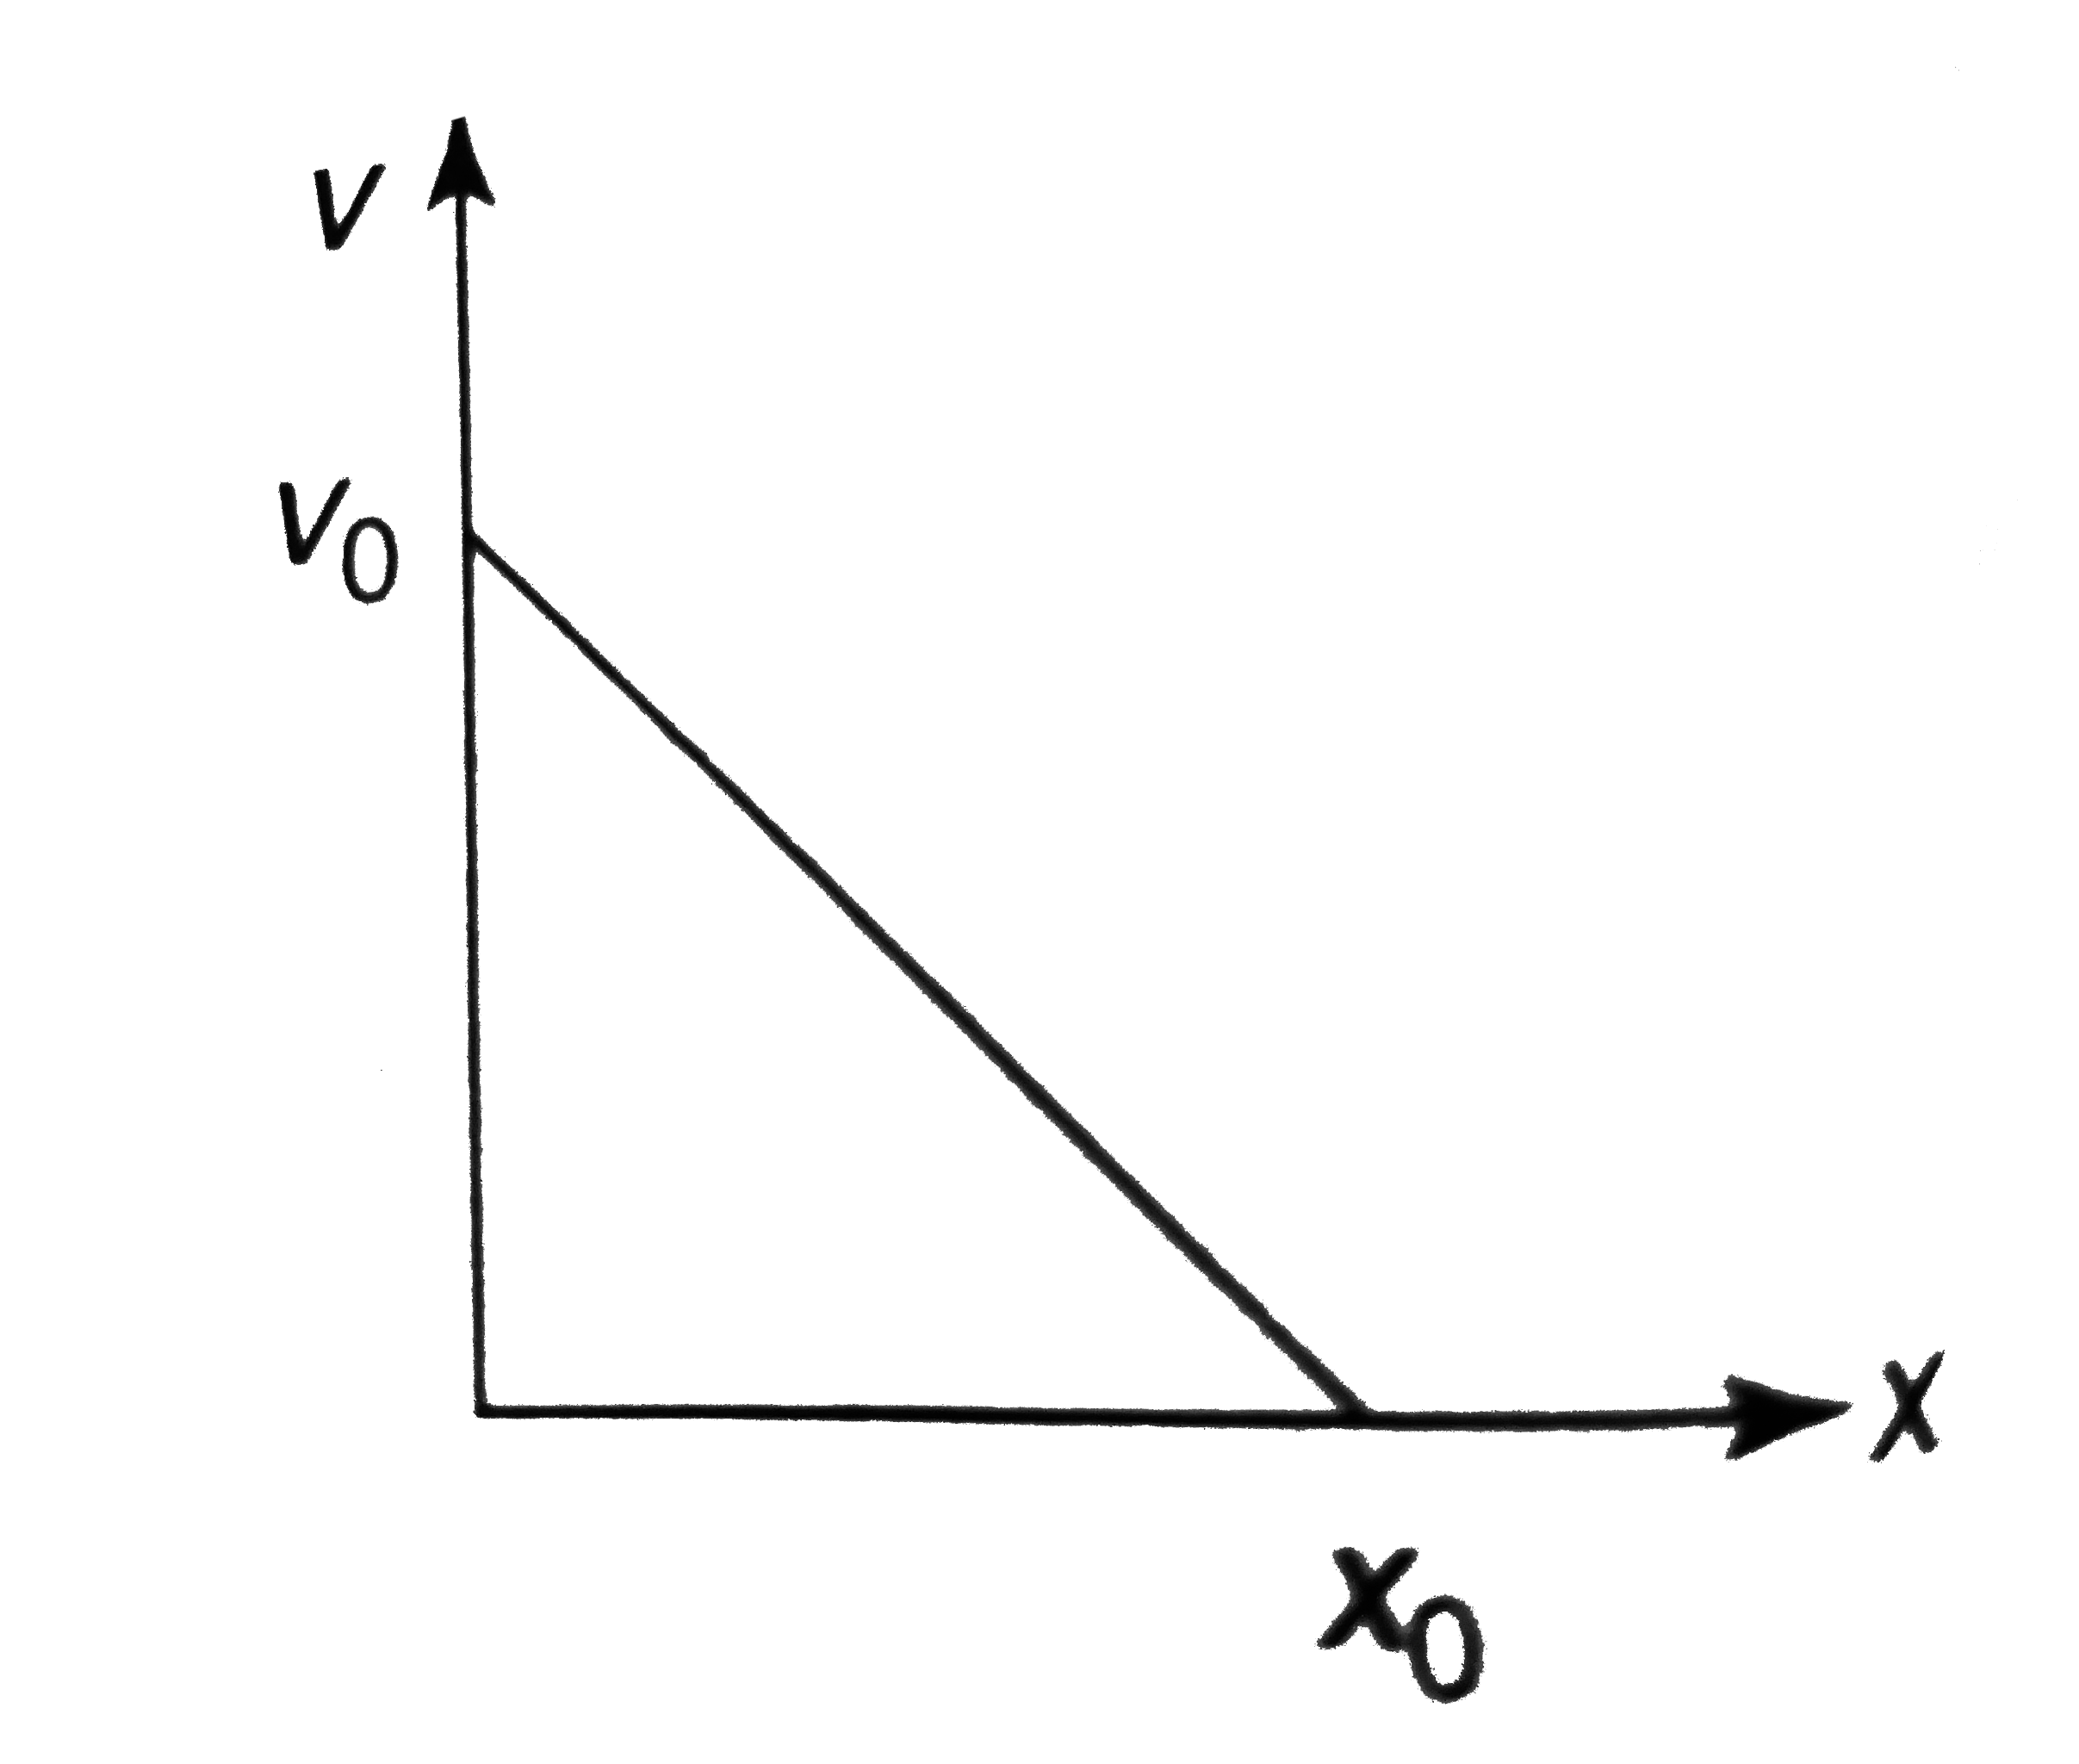 View Solution
A sample of mono-atomic ideal gas is taken through a cyclic process ABCDA. A graph is plotted in which heat exchanged by the gas upto an instant is shown on x-axis and work done by the gas upto that instant is shown on y-axis.
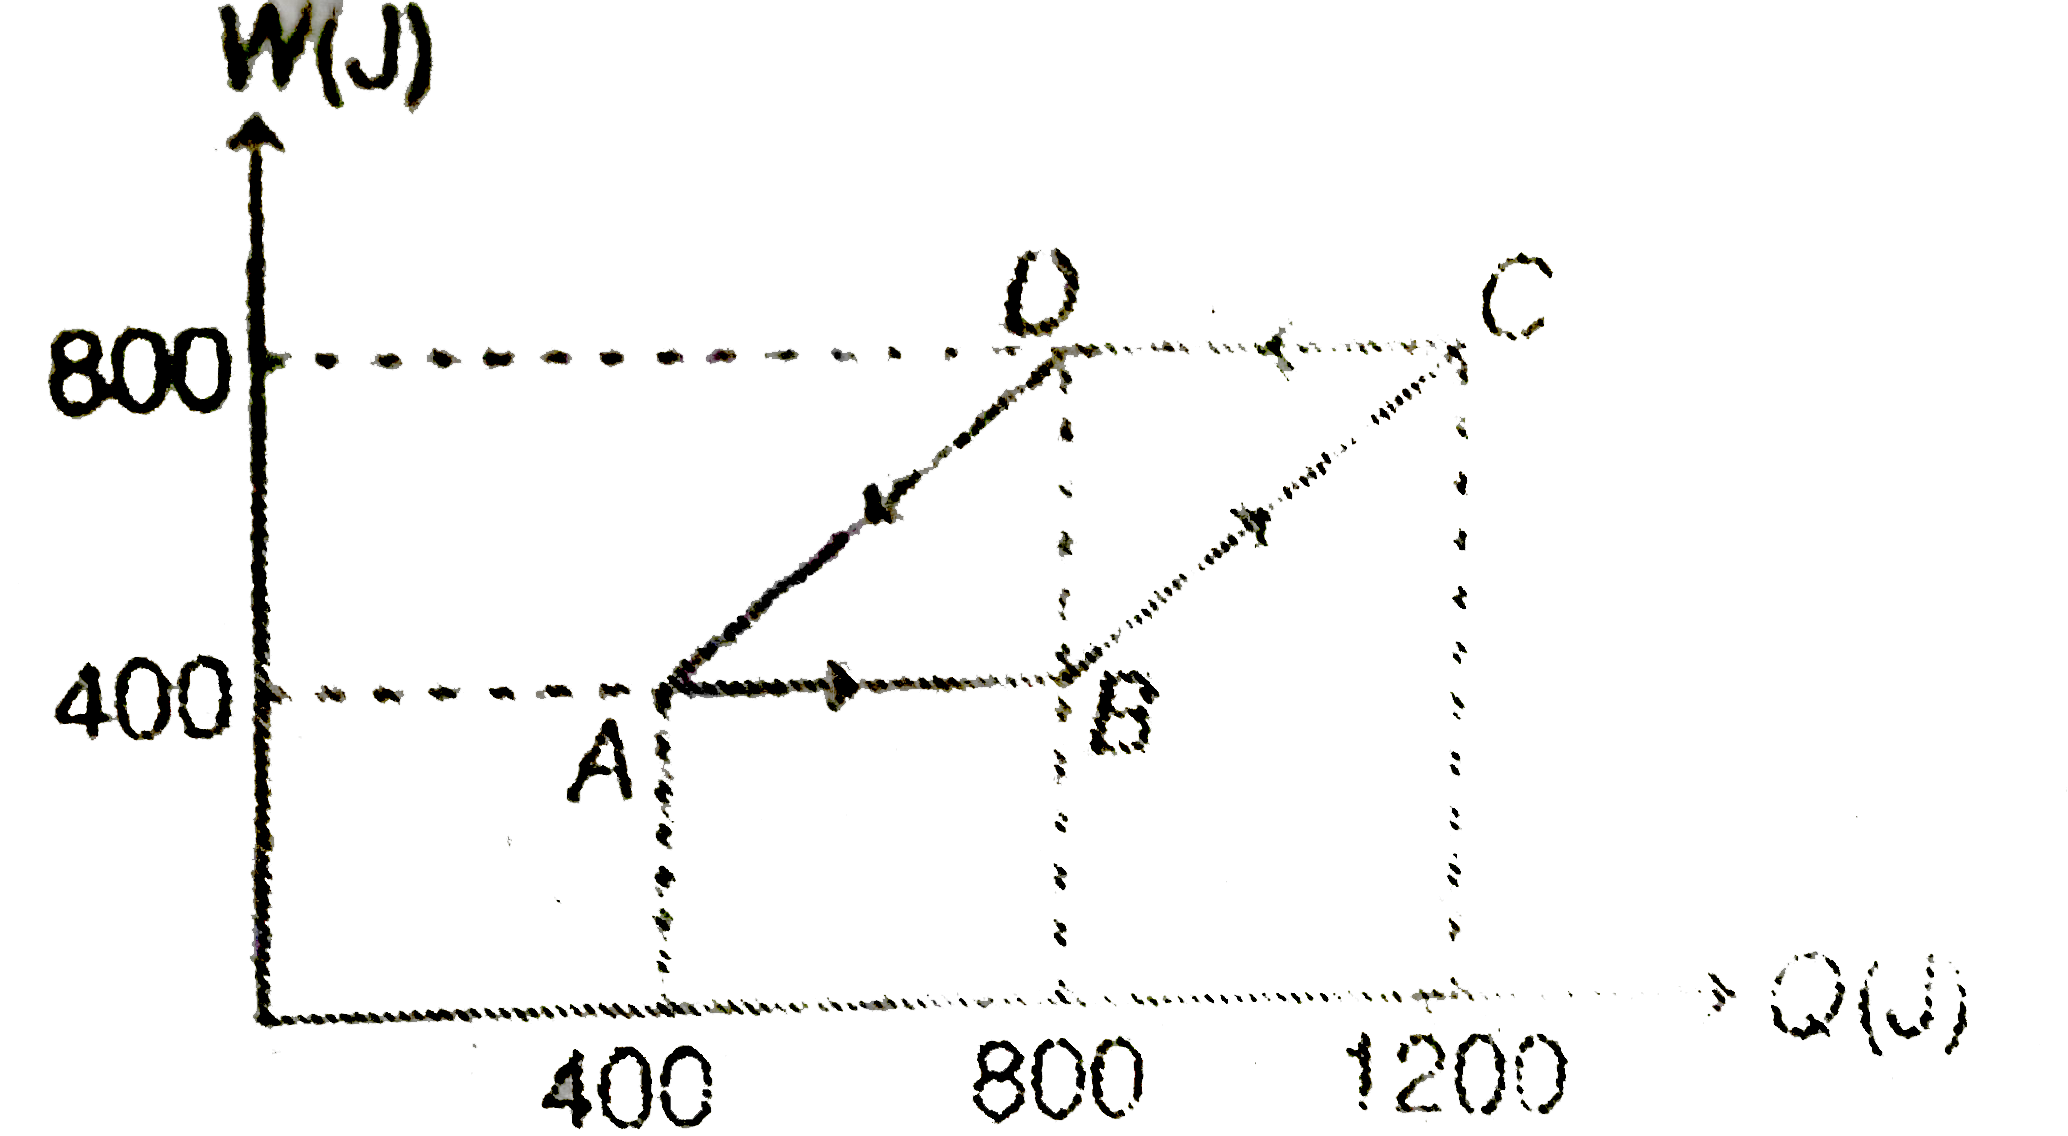
The given cyclic process can be represented on a pressure-volume graph as:View Solution


