The volume vs. temperature graph of 1 mole of an ideal gas is given below
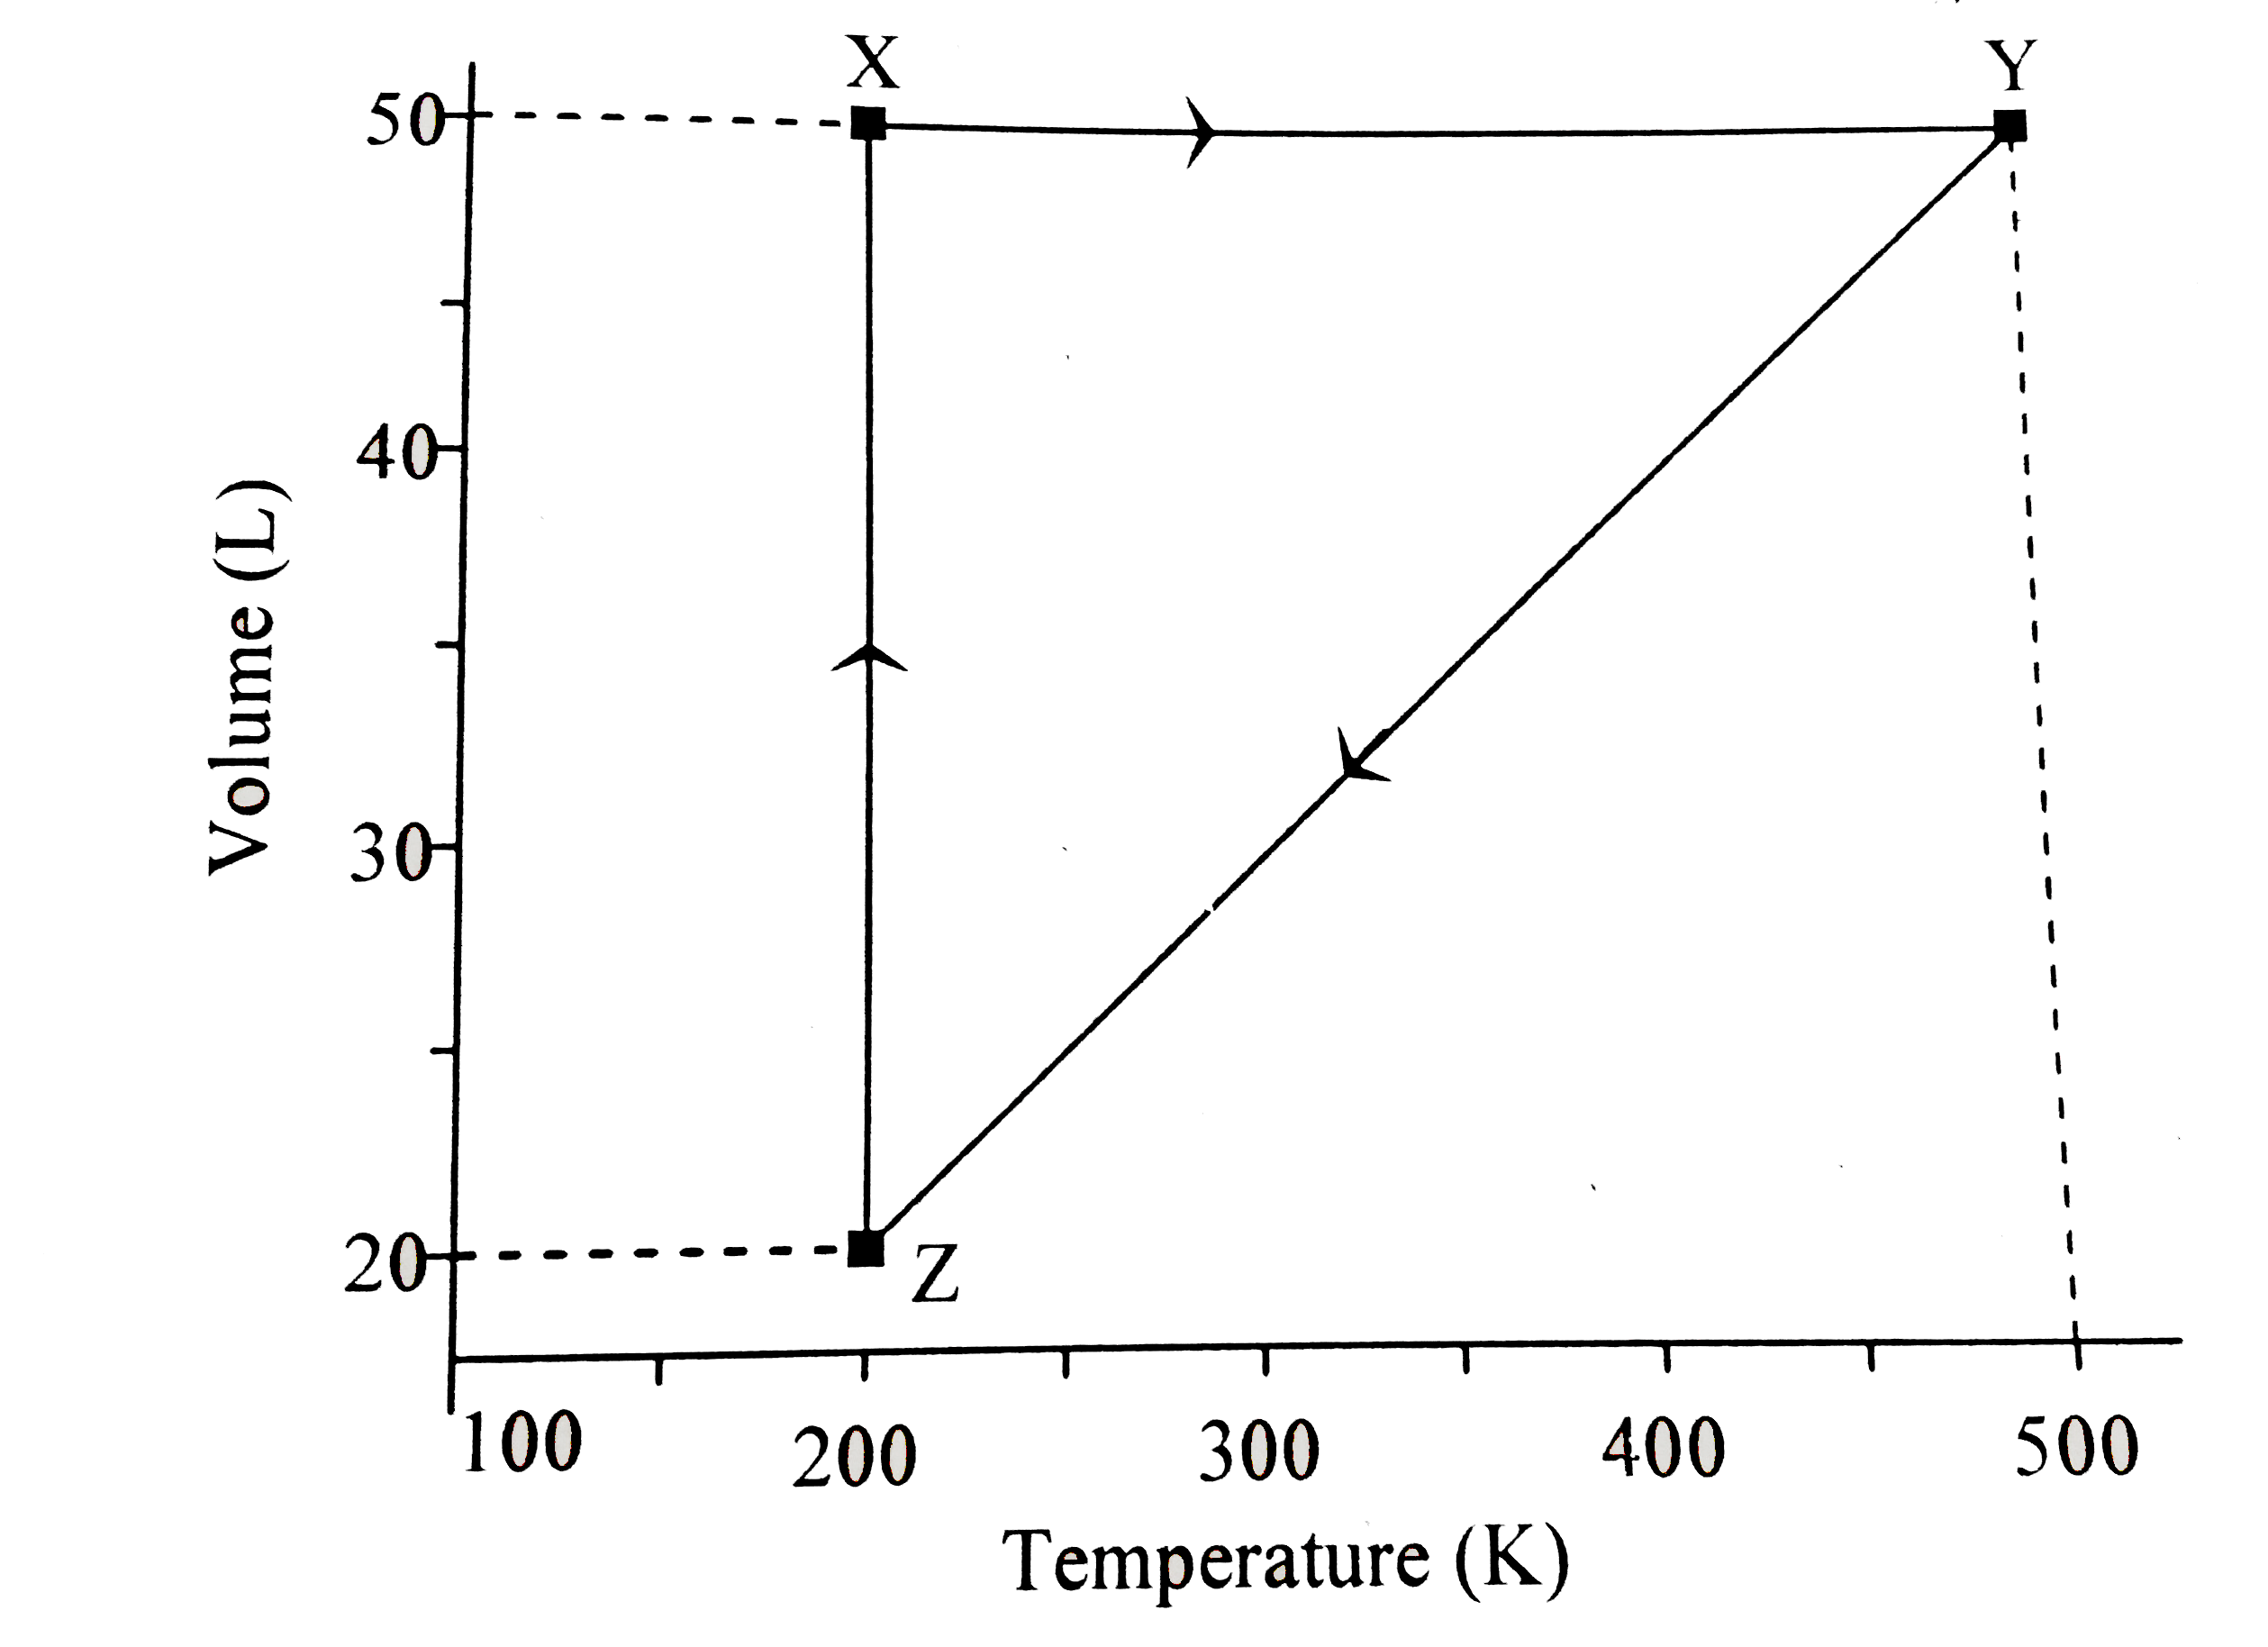
The pressure of the gas (in atm) at X, Y and Z, respectively, are
0.328,0.820,0.820
3.28,8.20,3.28
0.238,0.280,0.280
32.8,0.280,82.0
The correct Answer is:A
AtXV=50LT=200K
n=1
px=nRTV=1×0.0821×20050
=0.328
At Z Pz=1×0.0821×20020=0.821
At Y py=1×0.0821×50050=0.821
Similar Questions
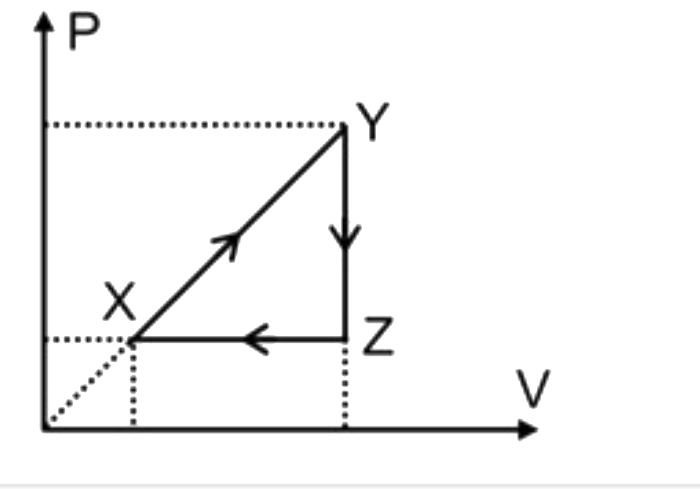
In the show indicator diagram over pressure - volume scales 'n' moles of an ideal gas is cycled . If the temperature of the gas in the state X and Y are respectively TXandTY . Temperature of the gas in the state Z is the (All temperature are in absolute scale )
 View Solution
Pressure temperature (p-1) graph of n moles of an ideal gas is shown in the figure. Among the following four graphs, which are the corresponding pressure volume (p-V) and density pressure (p-p) graphs?
 View Solution
Knowledge Check
- Question 1 - Select One
Graph for one mole gas is given below
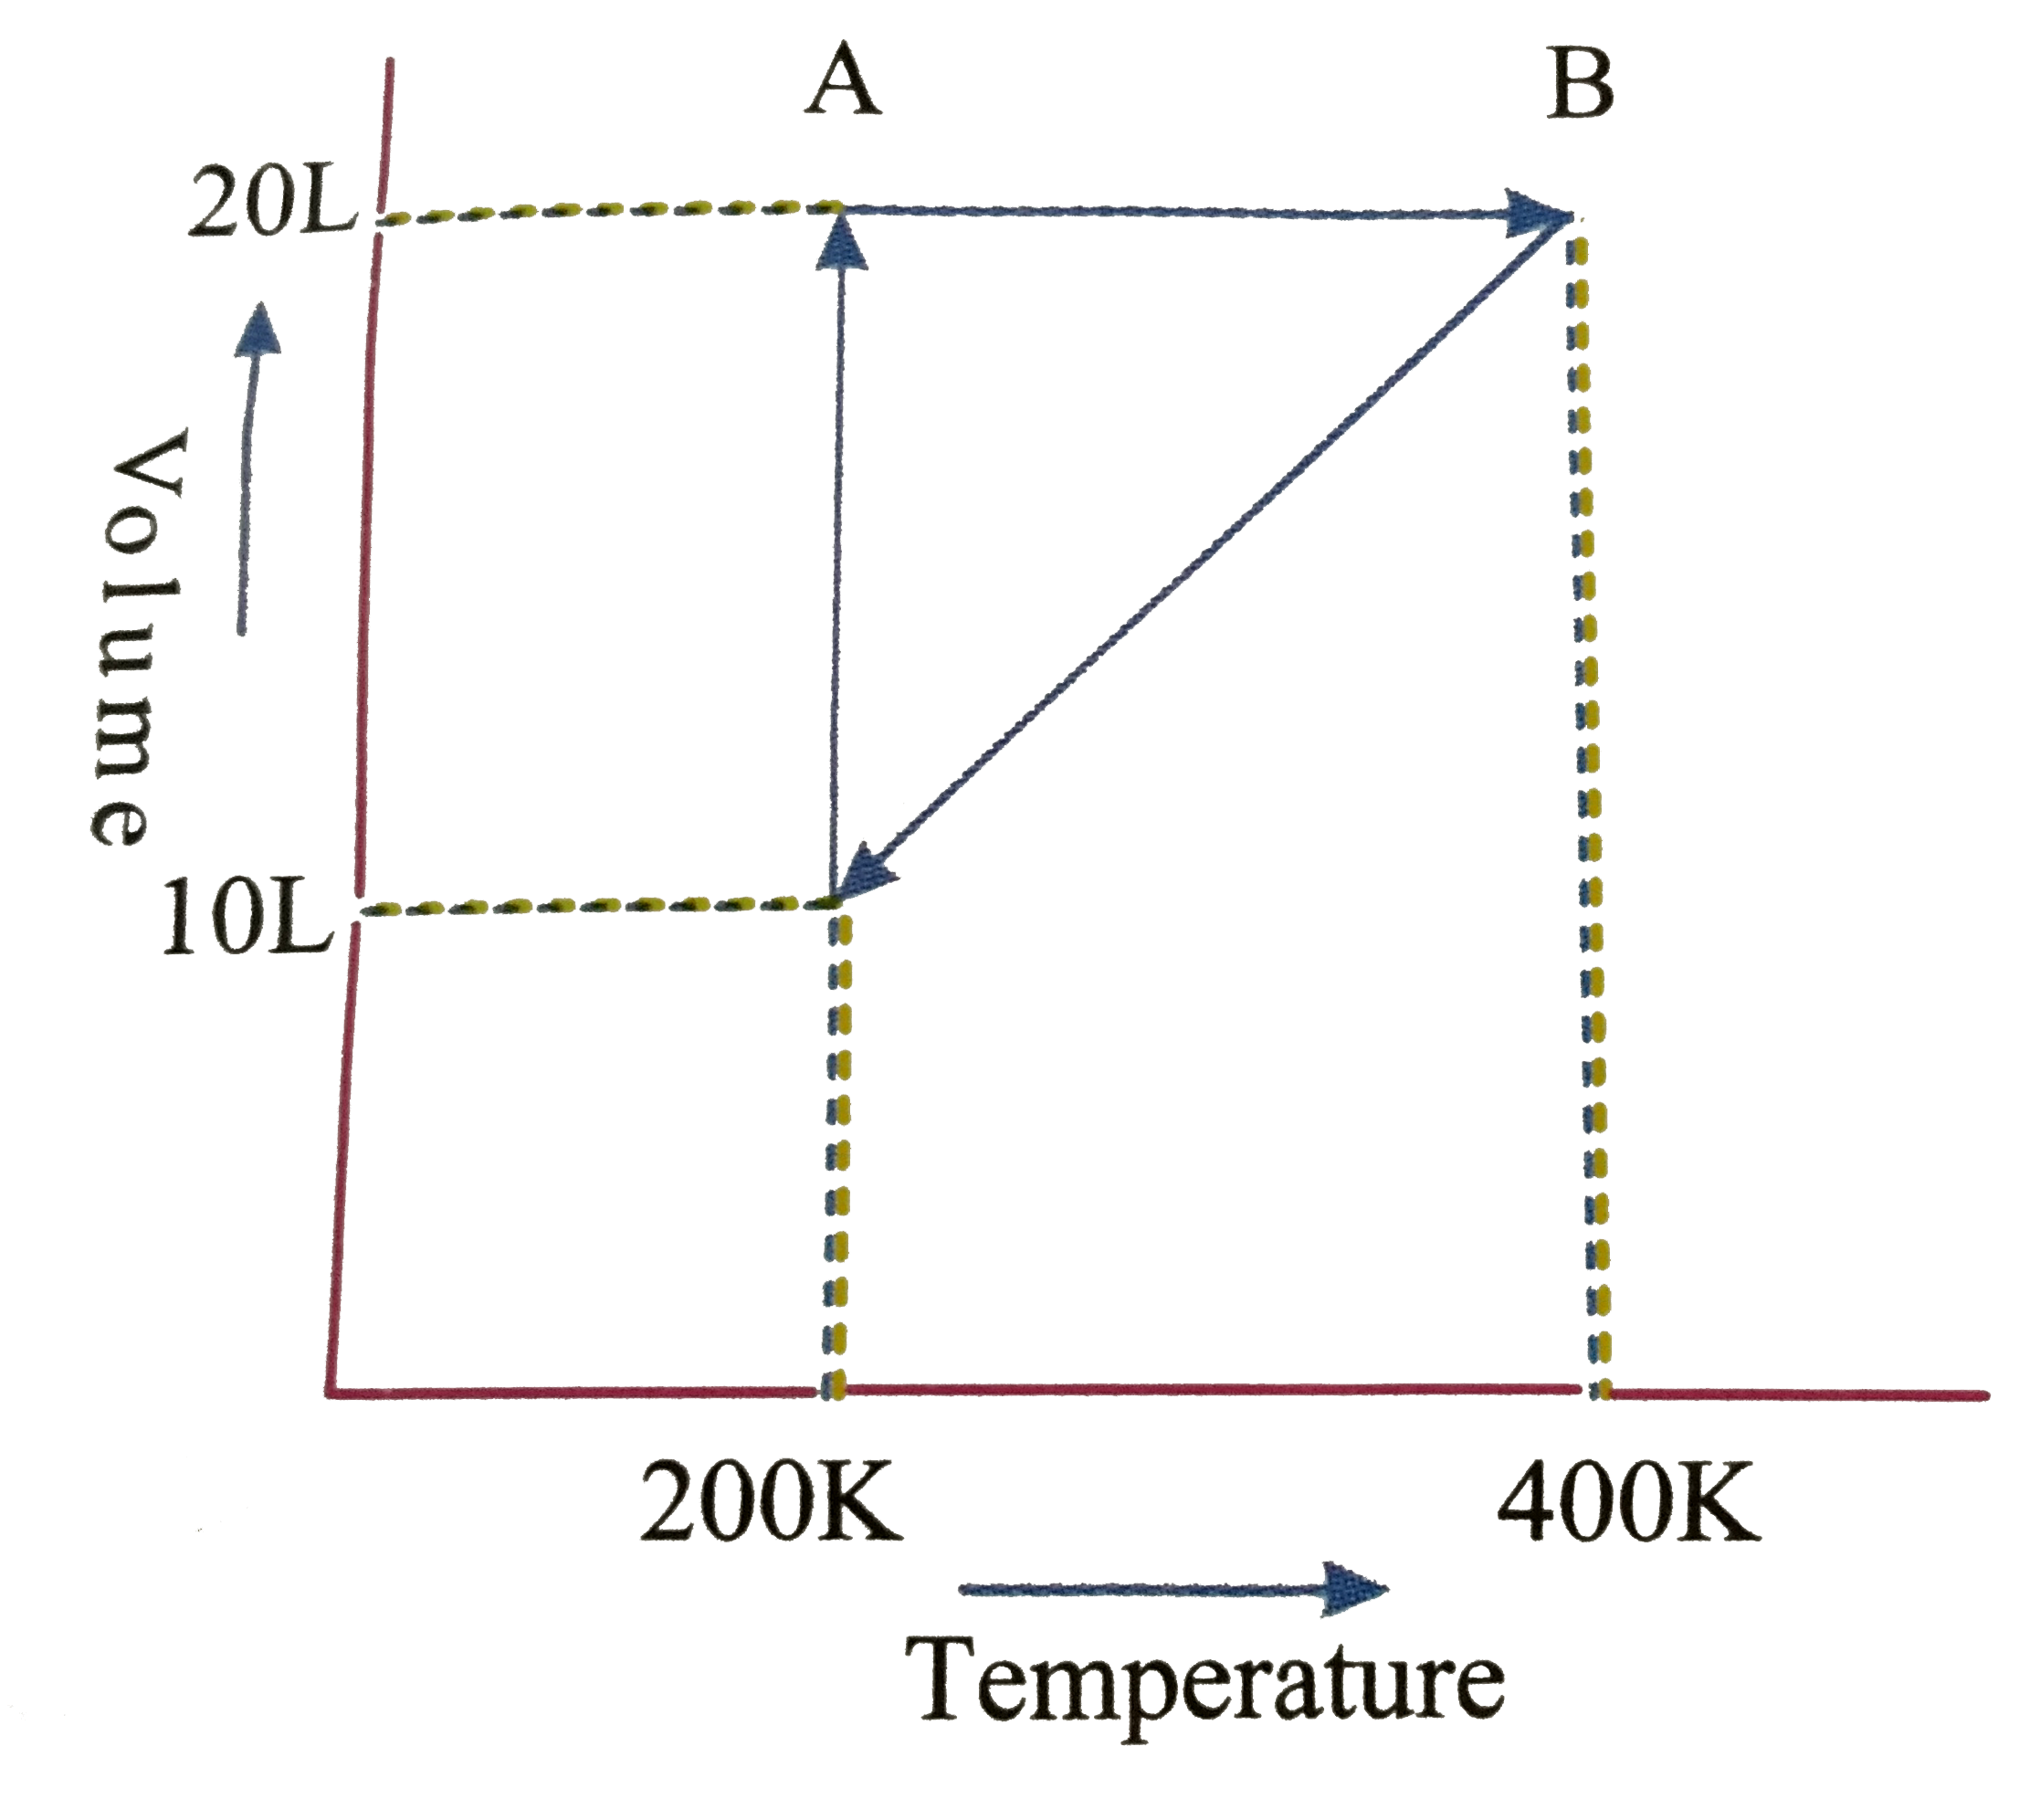
The pressure at C isAZeroB1.642 atmC0.0821 atmD0.821 atm - Question 2 - Select One
If both the temperature and the volume of an ideal gas are doubled, the pressure
AIncreases by a factor of 4BIs also doubledCRemains unchangedDIs diminished by a factor of 4 - Question 3 - Select One
The volume of 10moles of an ideal gas at 10atm and 500K is
A82LB41LC20.5LD823L
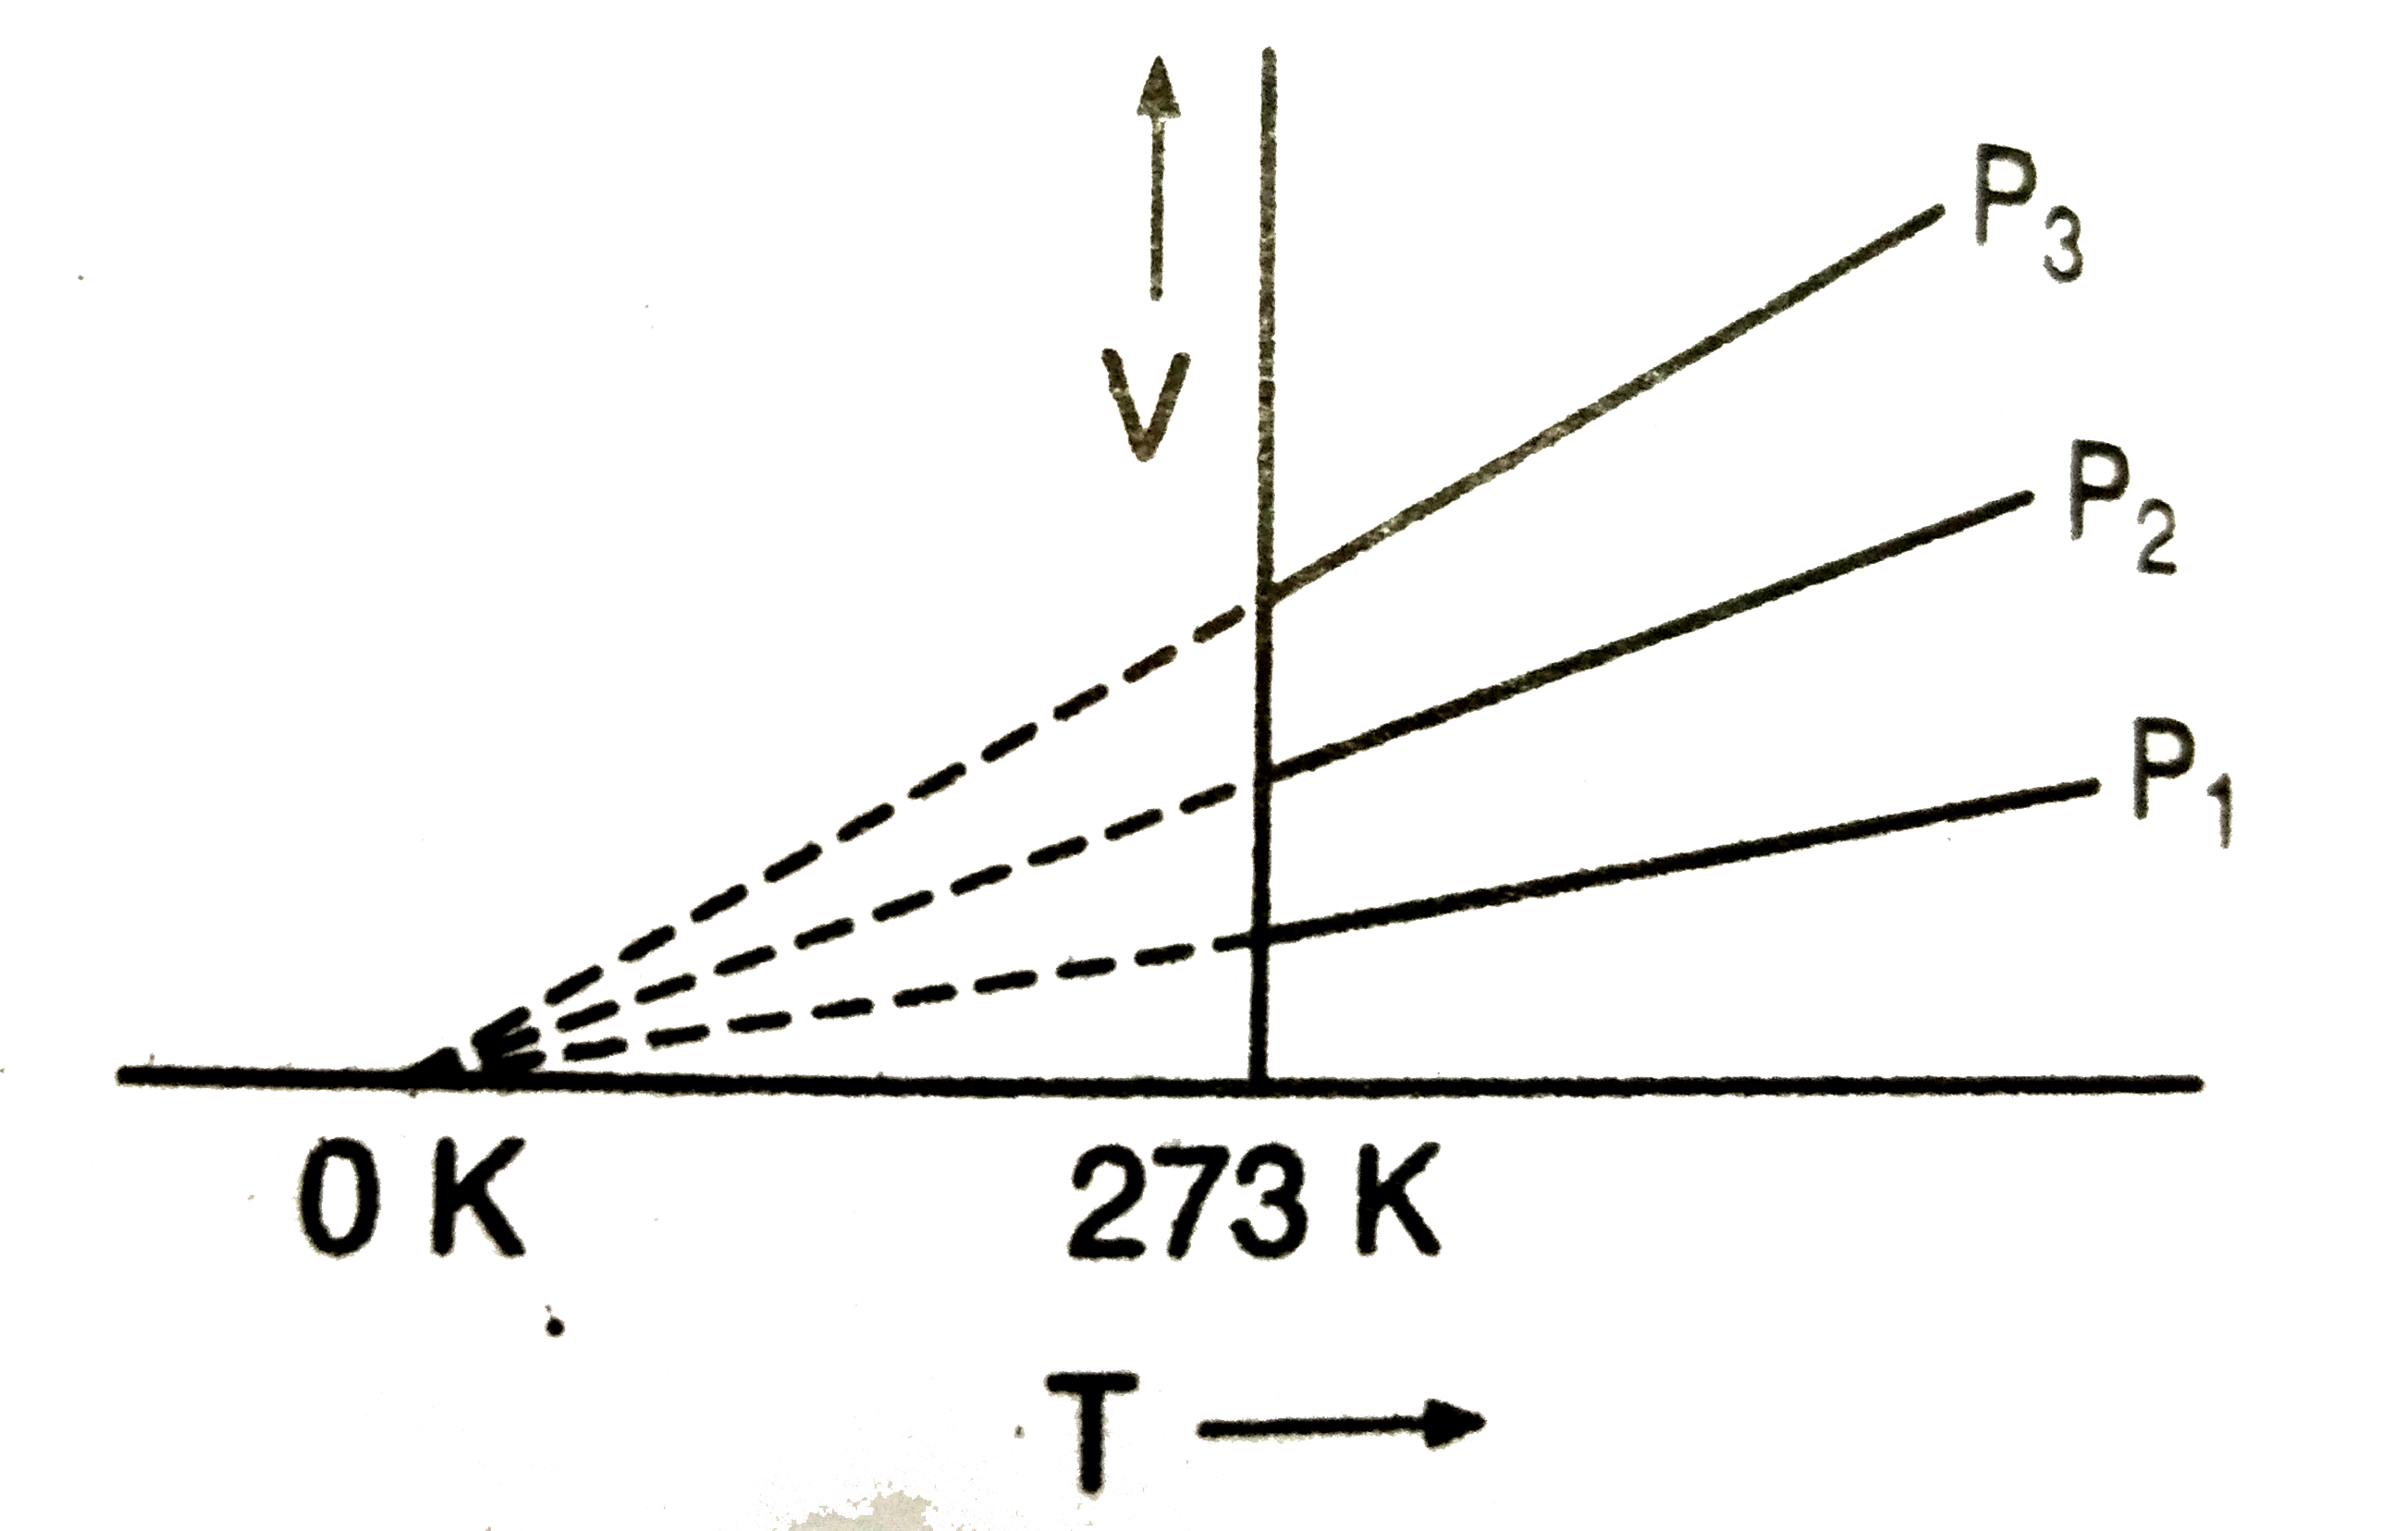
The volume-temperature graphs of a given mass of an ideal gas at constant pressure are shown below. What is the correct order of pressure ?
 View Solution
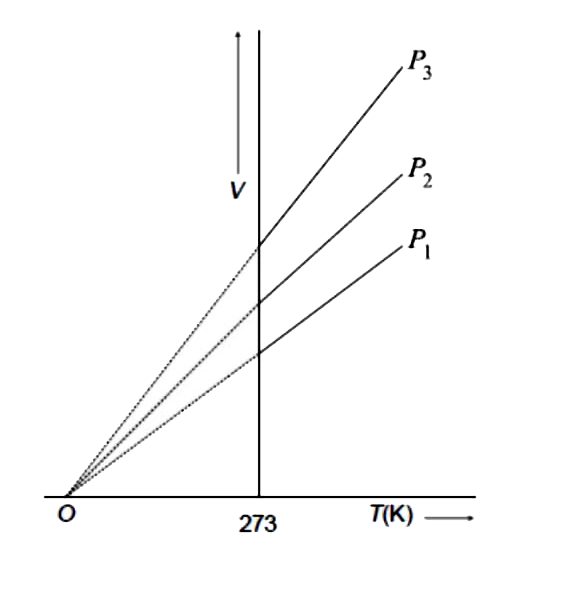
The volume-temperature graphs of a given mass of an ideal gas at constant pressures are shown below. What is the correct order of pressures ?
 View Solution
At a given volume and temperature the pressure of a gas
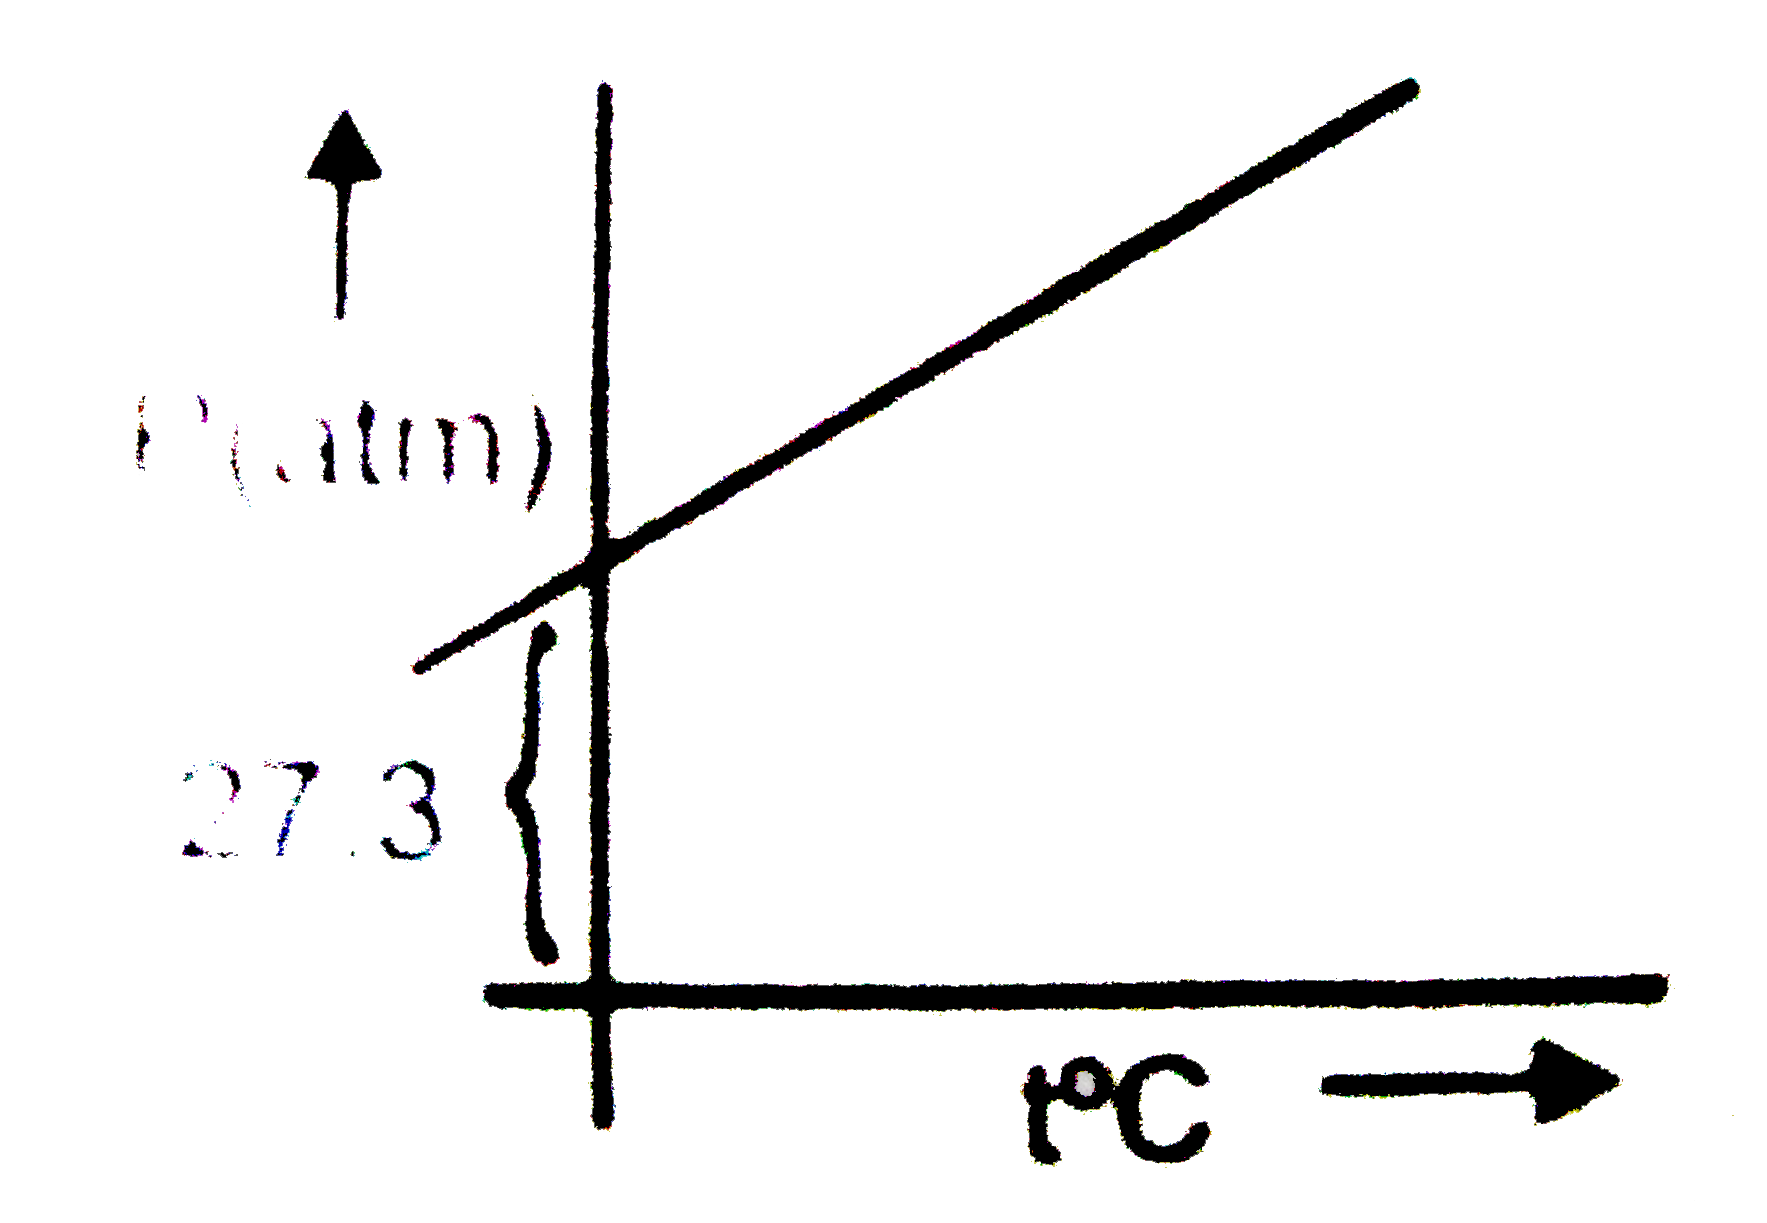
View SolutionA graph is plotted between p (atm) vs t∘C for 10 mol of an ideal gas as follows:
Then slope of curve and volume of container (L) respectively, are:
 View Solution
At a given volume and temperature ,the pressure of a gas
View Solution
