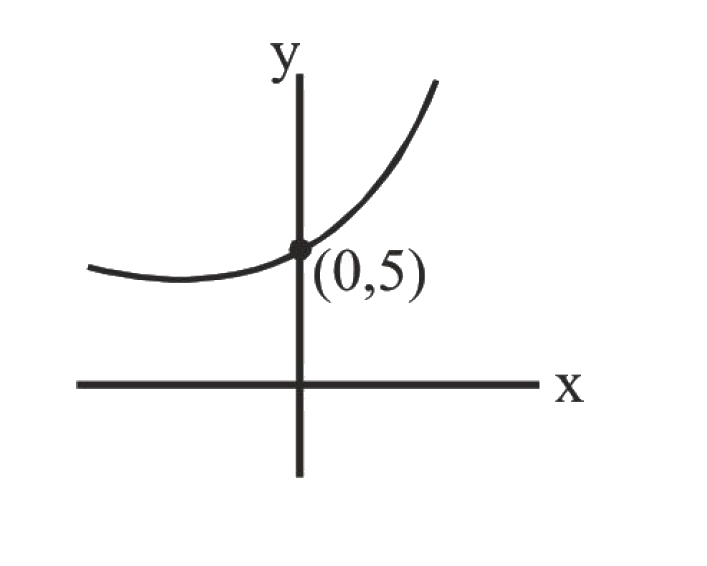
If the equation for graph shown in figure is y=aex then value of a is:-
−5
5
1
cannot be determined
The correct Answer is:B
Topper's Solved these Questions
Similar Questions
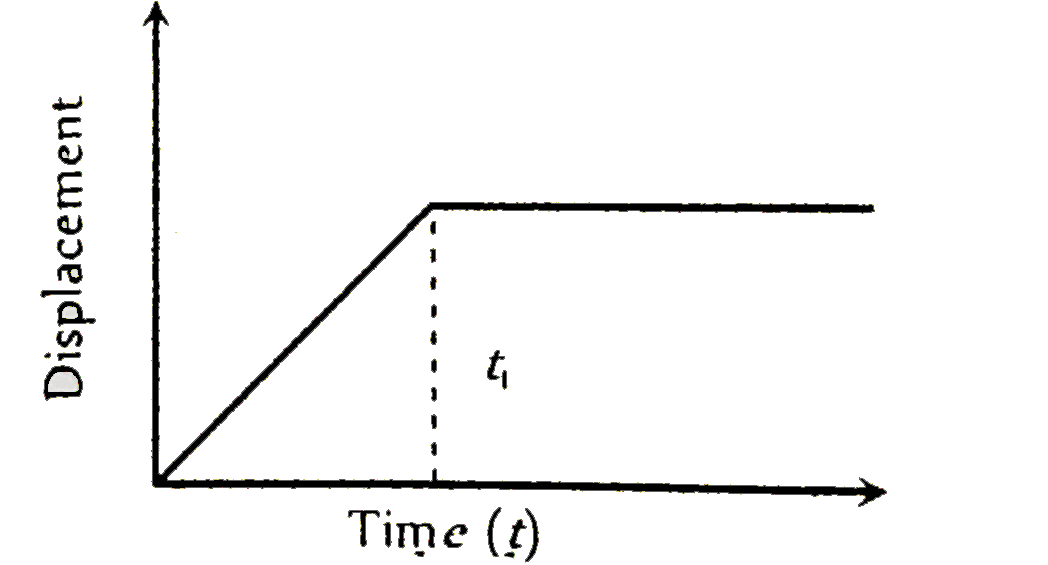
The x -t graph shown in figure represents

View SolutionThe x-t graph shown in figure represents

View SolutionThe x-t graph shown in figure represents.

View SolutionDraw the graph of the equation x+2y =4, use graph to find :
(a) X1, the value of x when y=4(b)Y1 the value of y when x= -2
View SolutionDraw the graph of the equation x+2y =4, use graph to find :
(a) X1, the value of x when y=4(b)Y1 the value of y when x= -2
View SolutionDraw the graph of the equation
4x+3y+6=0
From the graph find
(i) y1 the value of y, when x=12
(ii) y2 the value of y, when x=-6
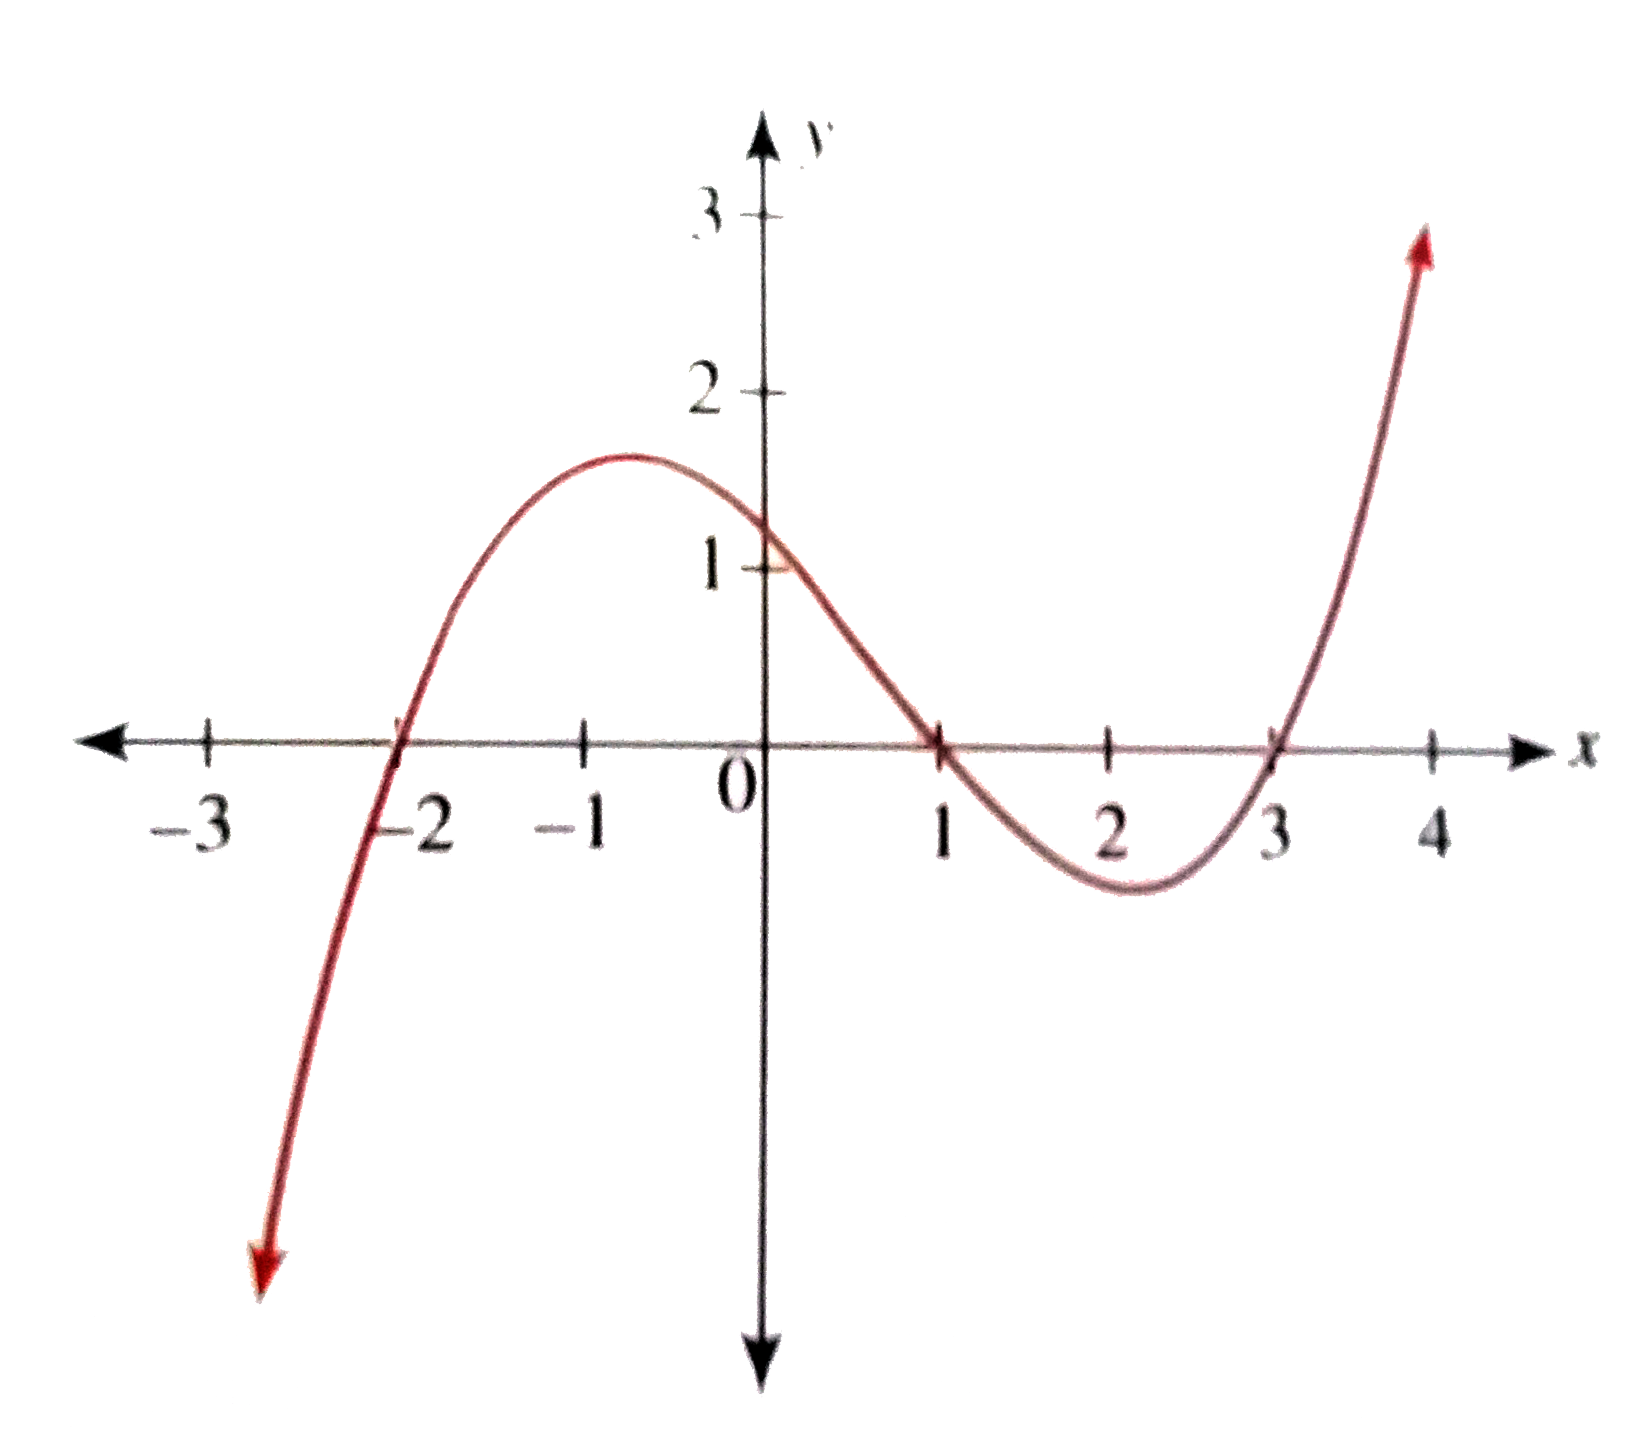
View SolutionThe graph of the function y=f(x) is as shown in the figure.

Then draw the graphs of
(i) |y|=sgn(f(x)) (ii) |y|=|f(x∣)|
(iii) y=xsgn(f(x))
View SolutionThe graph of the function y=f(x) is as shown in the figure.

Then draw the graphs of
(i) |y|=sgn(f(x)) (ii) |y|=|f(x∣)|
(iii) y=xsgn(f(x))
View SolutionDraw the graph of the equation 3x+2y−5=0. Use this graph to find:
(i) x1 the value of x, when y=7
(ii) y1 the value of y, when x=3
View SolutionDraw the graph of the equation
2x−3y−5=0
Find the graph find
(i) x1 the value of x, when y=7
(ii) x2,the value of x, when y=-5
View Solution
