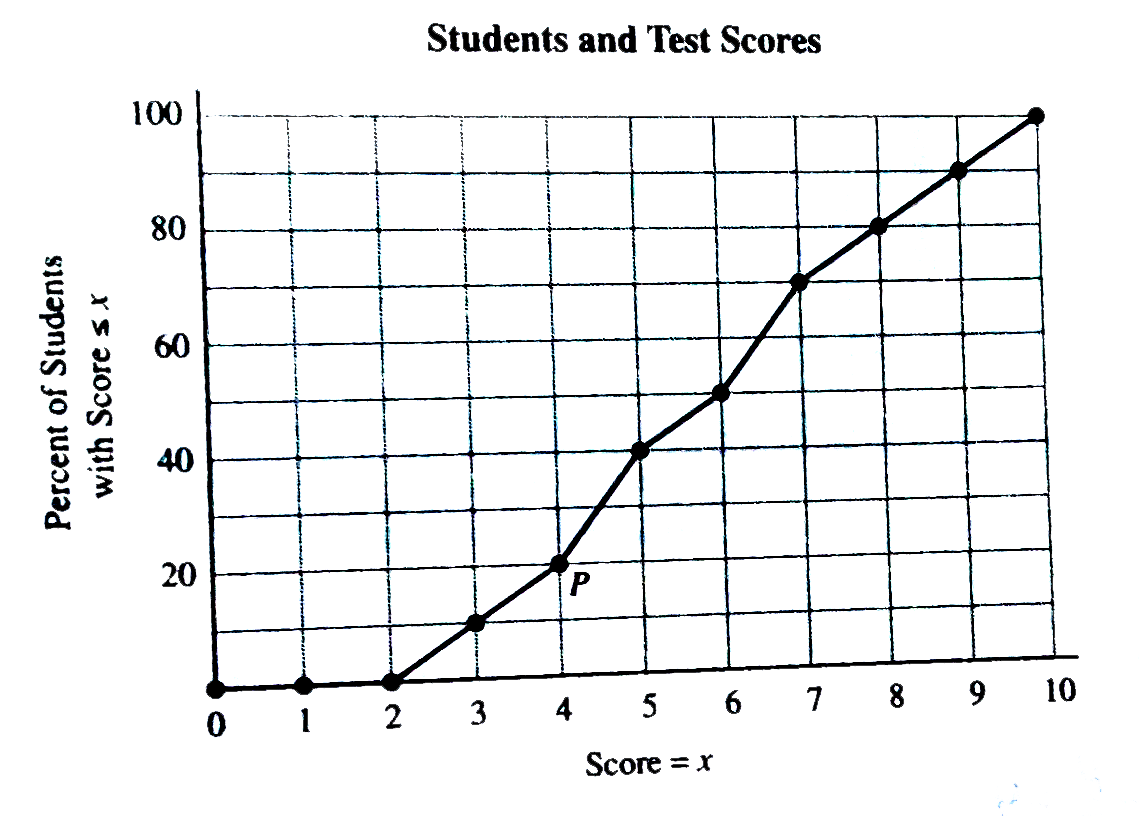
When a 10-question true -false quiz was given to 50 students , the number of correct answer ranged from 3 to 10 , as shown on the graph above . Each point on the graph shows the percent of students who earned scores less than or equal to x . For example , point P shows that 20 percent of the students received scores of 4 or less. According to the graph , how many students got scores of 6 ?
5
10
15
20
The correct Answer is:A
Similar Questions
Knowledge Check
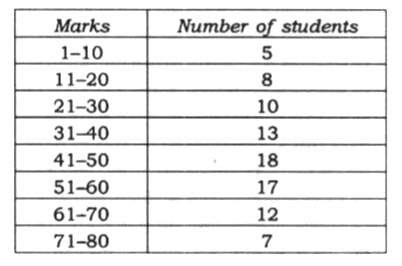
From the given table, what is the percentage of students scoring 40 or more, but less than 70.
 A0.08B0.56C0.48D0.96
Study the given graph and answer the question that follows .
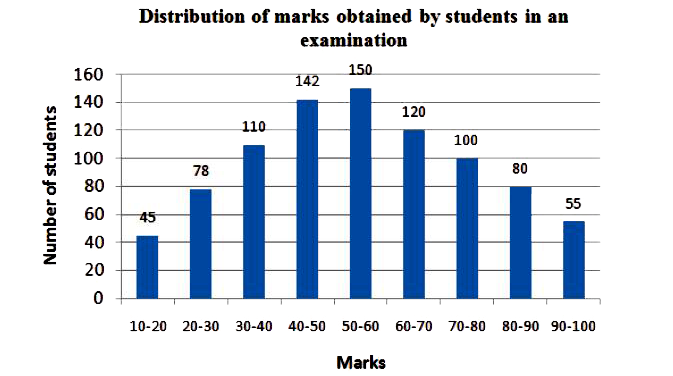
The number of students who obtained 20 marks or more but less than 60 marks is :A402B600C480D522What is the rank of Nitya ?
Statements :
1. There are 25 students in a class .
2 . There are 15 students who have scored less than Nitya .AStatement 1 alone is sufficientBStatement 1 and 2 together are not sufficientCStatement 1 and 2 together are sufficientDStatement 2 alone is sufficient
The graph shows the result of 10th class students of a school for 4 years. Study the graph and answer the questions :
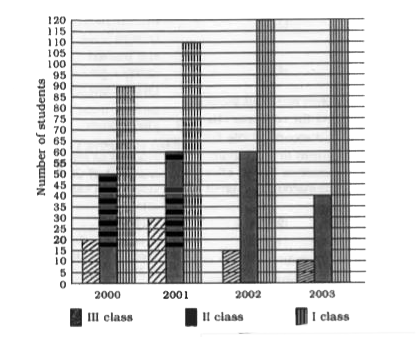
The ratio of students who scored seconds class to the total students appcarcd in the year 2000 is
View SolutionRead the bar graph shown in figure and answer the following questions.
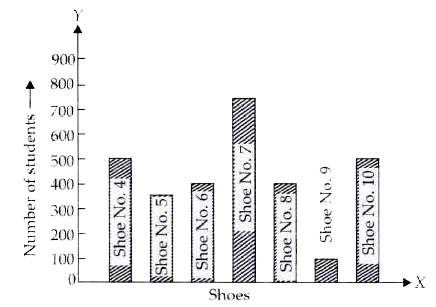
The number of students wearing shoe No. 10 is less than three times the number of students wearing shoe No. 9. Is it true ?
View SolutionThe graph shows the result of 10th class students of a school for 4 years. Study the graph and answer the questions :
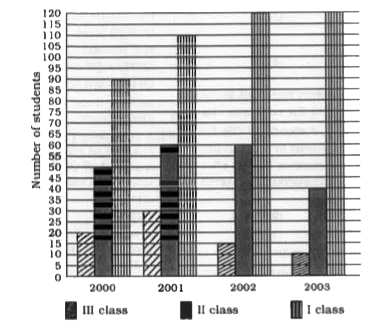
The number of students appeared for the 10th calss examin the year 2002 is
View SolutionThe given graph shows the weights of students in a school on a particular day.
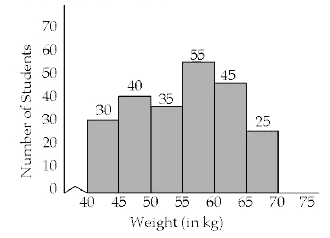
The number of students weighing less than 50kg is what percent less than the number of students weighing 55kg or more?
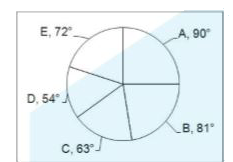
View SolutionThe pie chart given below shows the number of students in 5 sections .The number of students is 7200.
The number of students in section A is what percent of that of section B?
View Solution

