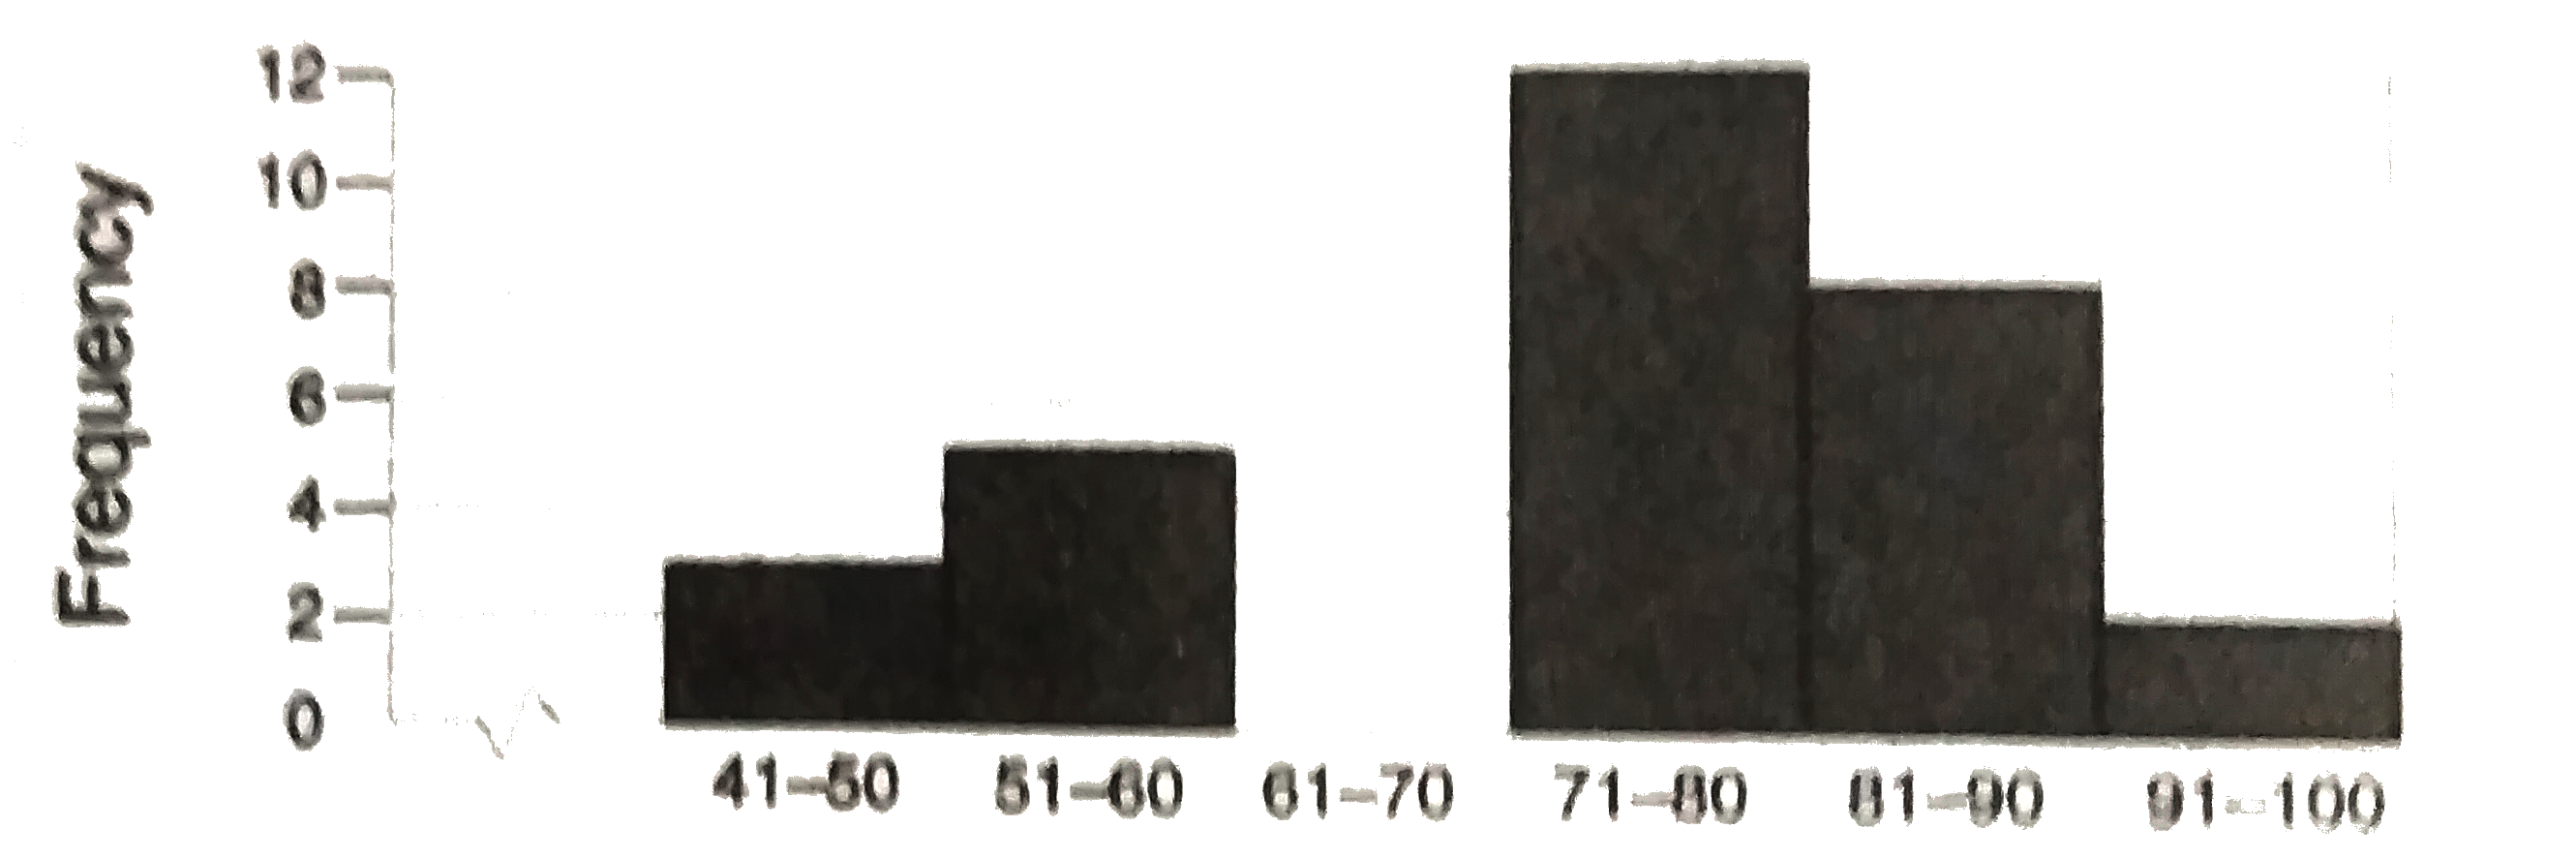
The frequency chart shows test scores for a certain class. The total number of student is 31. If a student in the class was picked at random , what is the probability that the student's score was below 71 ?
The correct Answer is:7/31
Step by step video, text & image solution for The frequency chart shows test scores for a certain class. The total number of student is 31. If a student in the class was picked at random , what is the probability that the student's score was below 71 ? by Maths experts to help you in doubts & scoring excellent marks in Class 12 exams.
Updated on:21/07/2023Similar Questions
A class has 20 girls and 16 boys. One student is selected at random. Find the probability that the student is a girl.
View SolutionThe following table shows the blood groups of 60 students of a class :
∣∣∣Blood groups A B O ABNumber of students 16 12 23 9∣∣∣
One student of the class is chosen at random. What is the probability that the chosen student has blood group?
(i) O (ii) AB (iii) A (iv) B
View Solution
Knowledge Check

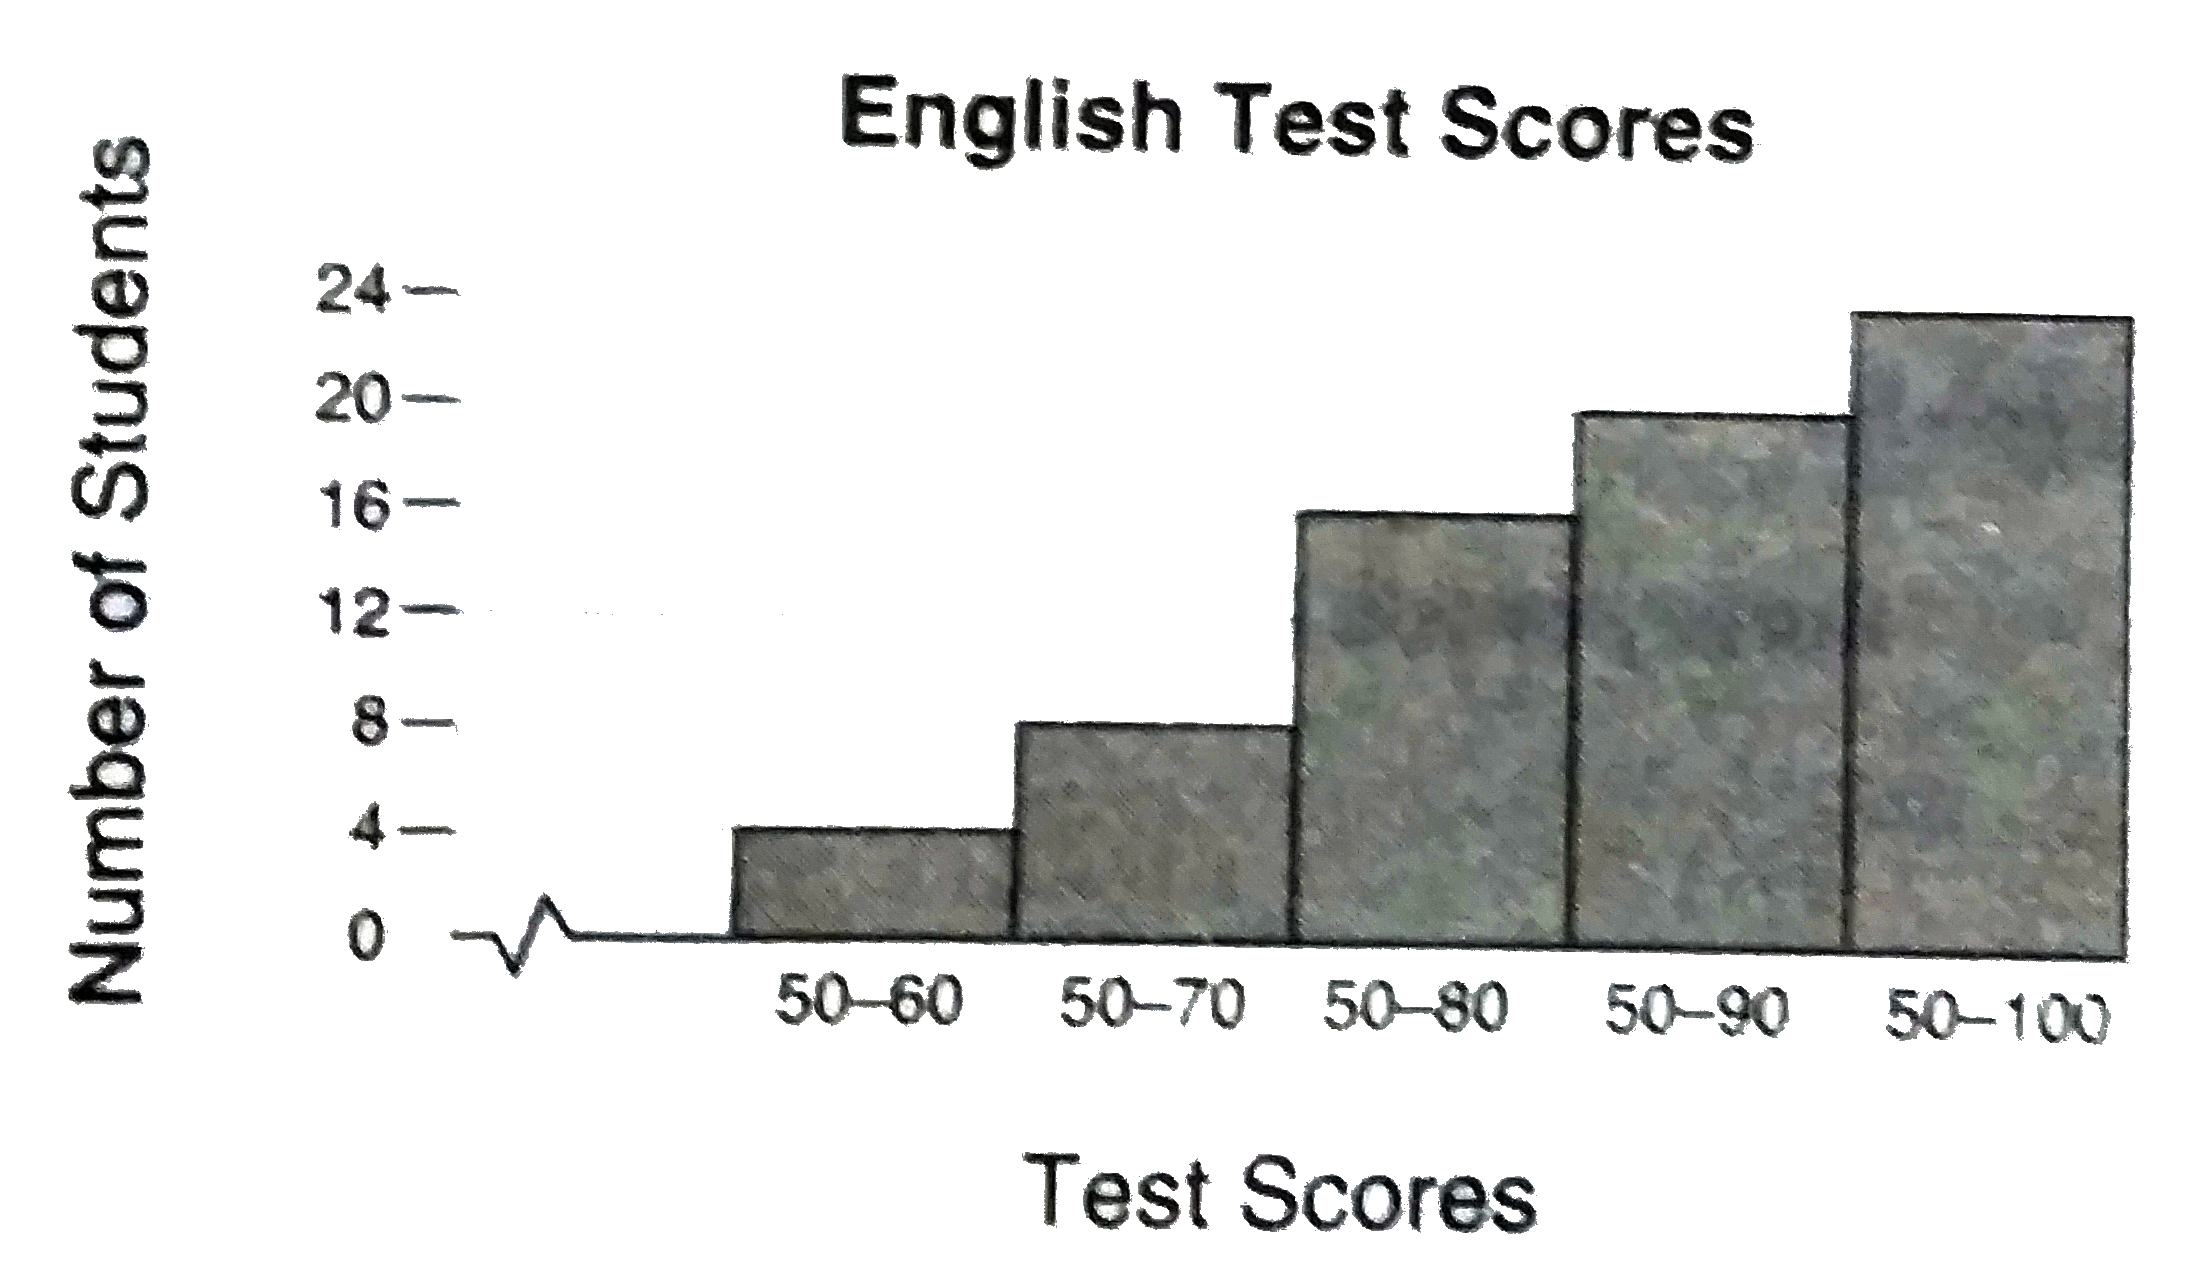
The cumulative histrogram above shows the distribution of scores that 24 students received on an English test. If a students is selected at random, what is the probability that the student will have a score between 71 and 80?A16B13C12D23A class has 12 boys and 4 girls. If three students are selected at random from the class,
what is the probability that all will be boys?A155B14C13D1128In a class , 45 % of students are girls, If there are 22 boys in the class, then the total number of students in the class is
A30B36C40D44

The student attendance record for a class in a one-semester course is shown above. If 2 students are chosen at random, what is the probability , to the nearest hundredth , that both students have fewer than 2 absences ?
View SolutionA class consists of 50 students out of which there are 10 girls. In the class 2 girls and 5 boys are rank holders in an examination. If a student is selected at random from the class and is found to be a rank holder, what is the probability that the student selected is a girl?
View SolutionIn a class, 5% of the boys and 10% of the girls have an IQ of more than 150. In this class 60% of the students are boys. If a student is selected at random and found to have an IQ of more than 150, find the probability that the student is a boy.
View SolutionIn a class of 25 students with roll numbers 1 to 25 , a students is pecked up at random to answer a question .Find students with roll numbers 1 to 25 , a student is picked up at random to answer a question . Find the probability that roll number of the selected students is either a multiple of 5 or 7.
View Solution
The histogram above shows the distribution of 30 test scores. If test score is selected at random, what is the probability that the score falls in the interval that contains the median score?
View Solution
