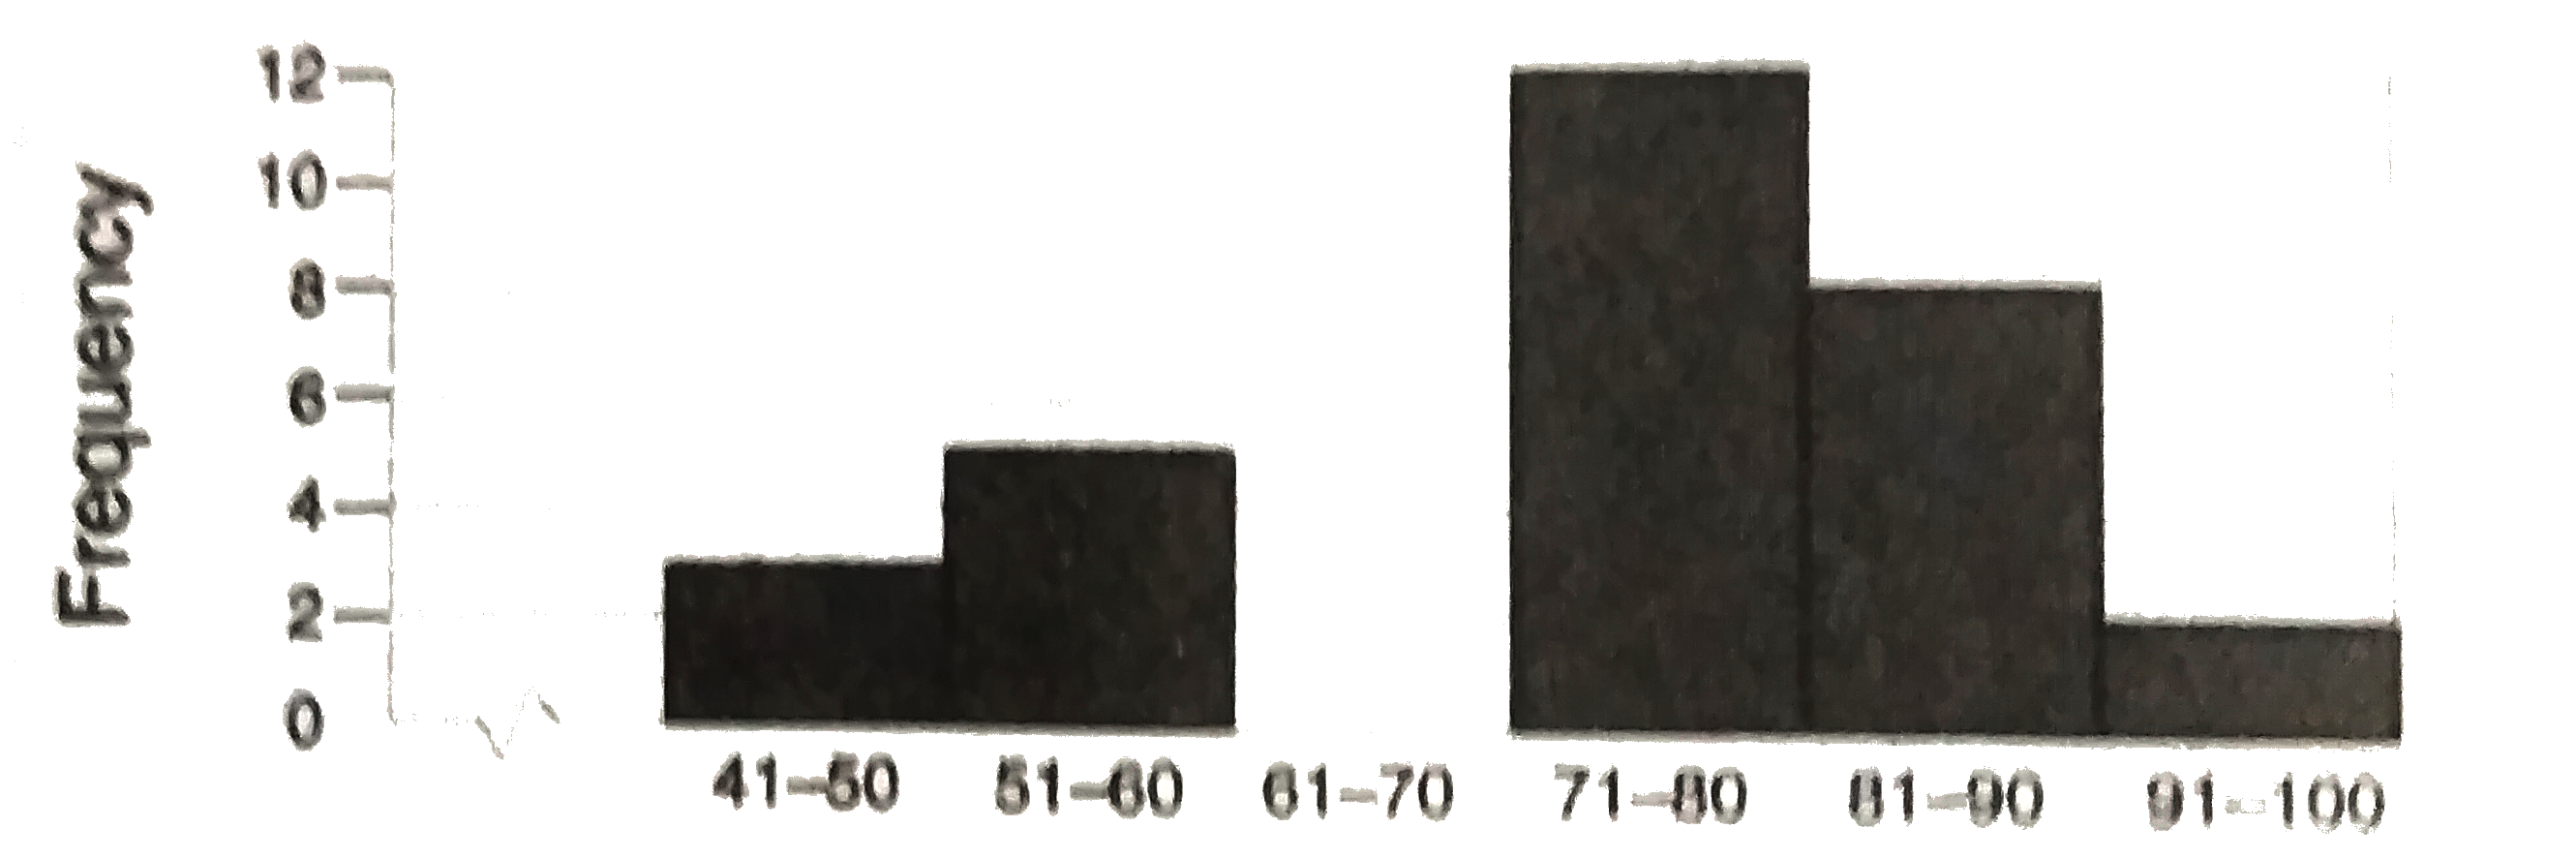
The histogram above shows the distribution of 30 test scores. If test score is selected at random, what is the probability that the score falls in the interval that contains the median score?
415
25
12
35
The correct Answer is:B
Step by step video, text & image solution for The histogram above shows the distribution of 30 test scores. If test score is selected at random, what is the probability that the score falls in the interval that contains the median score? by Maths experts to help you in doubts & scoring excellent marks in Class 12 exams.
Updated on:21/07/2023Topper's Solved these Questions
Similar Questions
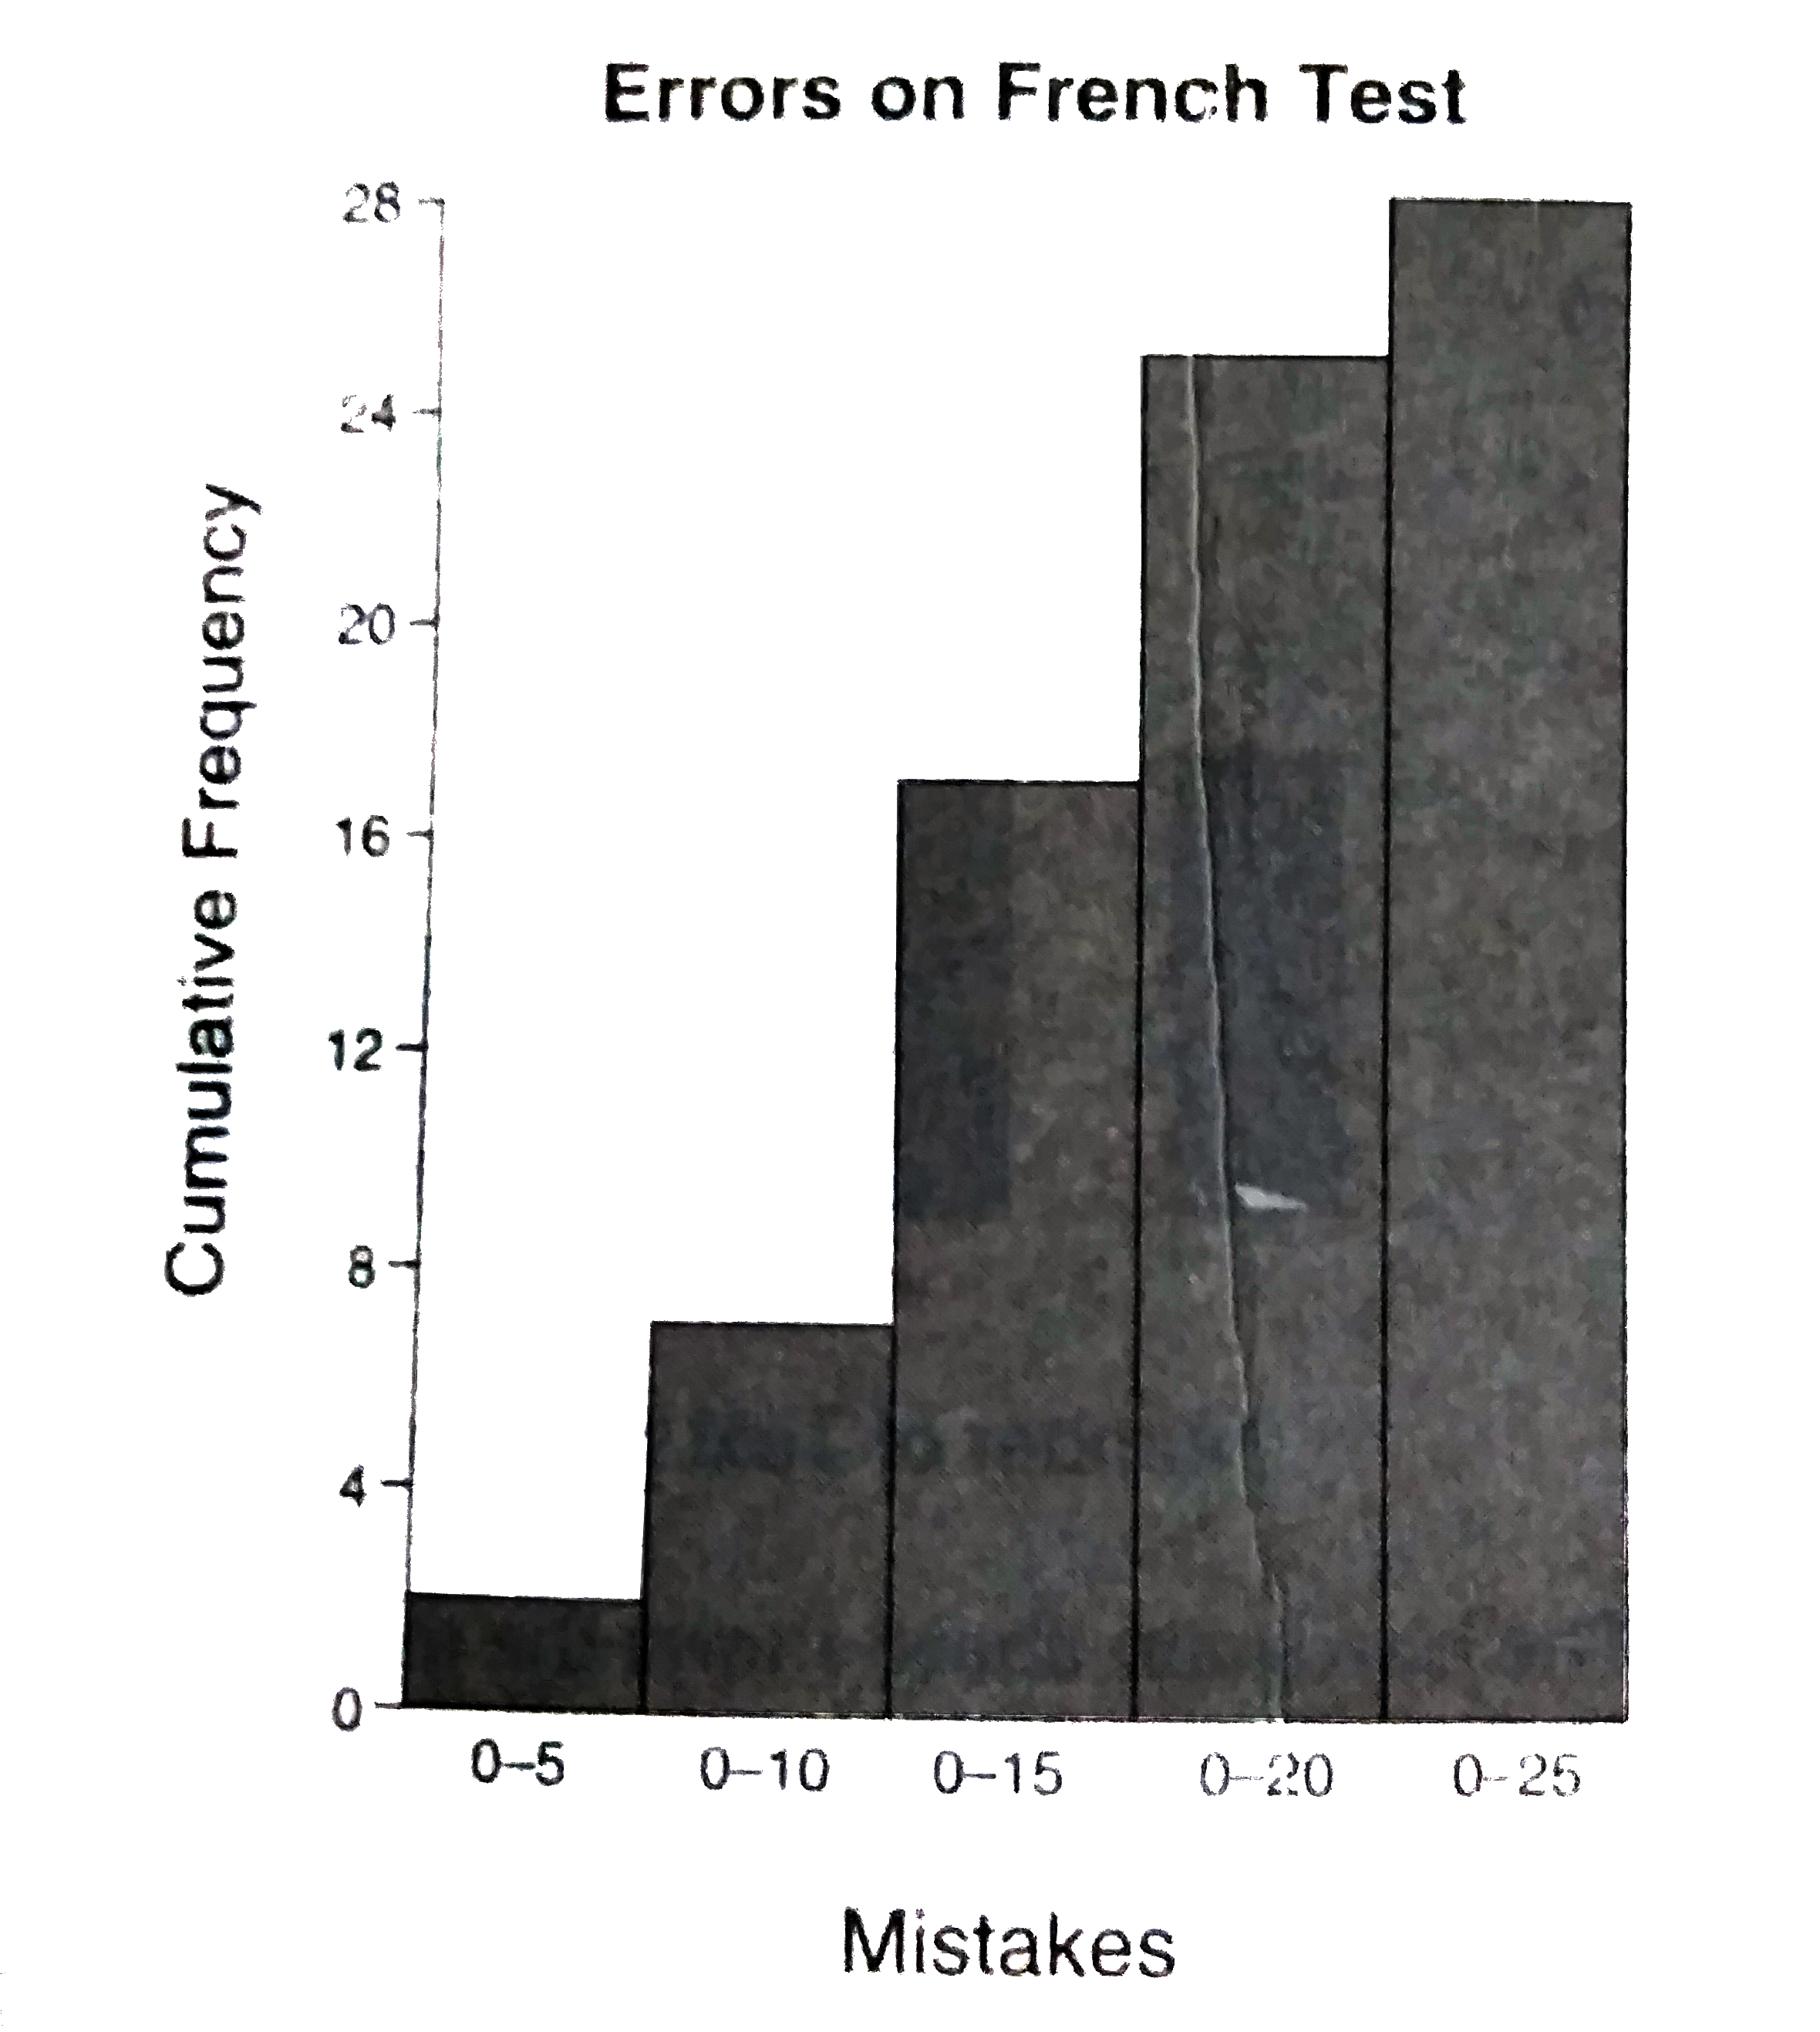
The cumulative histogram above shows the distribution of mistakes 28 students in a French languge class made on a test. What is the probability that a student selected at random made more than 10 mistakes?
View Solution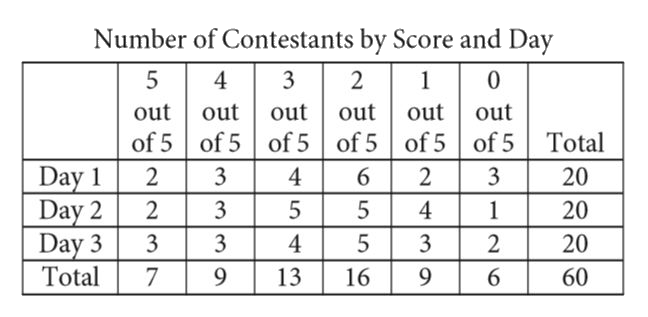
The same 20 contestants, on each of 3 days, answered 5 questions in order to win a prize. Each contestant received 1 point for each correct answer. The number of contestants receiving a given score on each day is shown in the table above.
No contestant received the same score on two different days. If a contestant is selected at random, what is the probability that the selected contestant received a score of 5 on Day 2 or Day 3, given that the contestant received a score of 5 on one of the three days?
View Solution
Knowledge Check
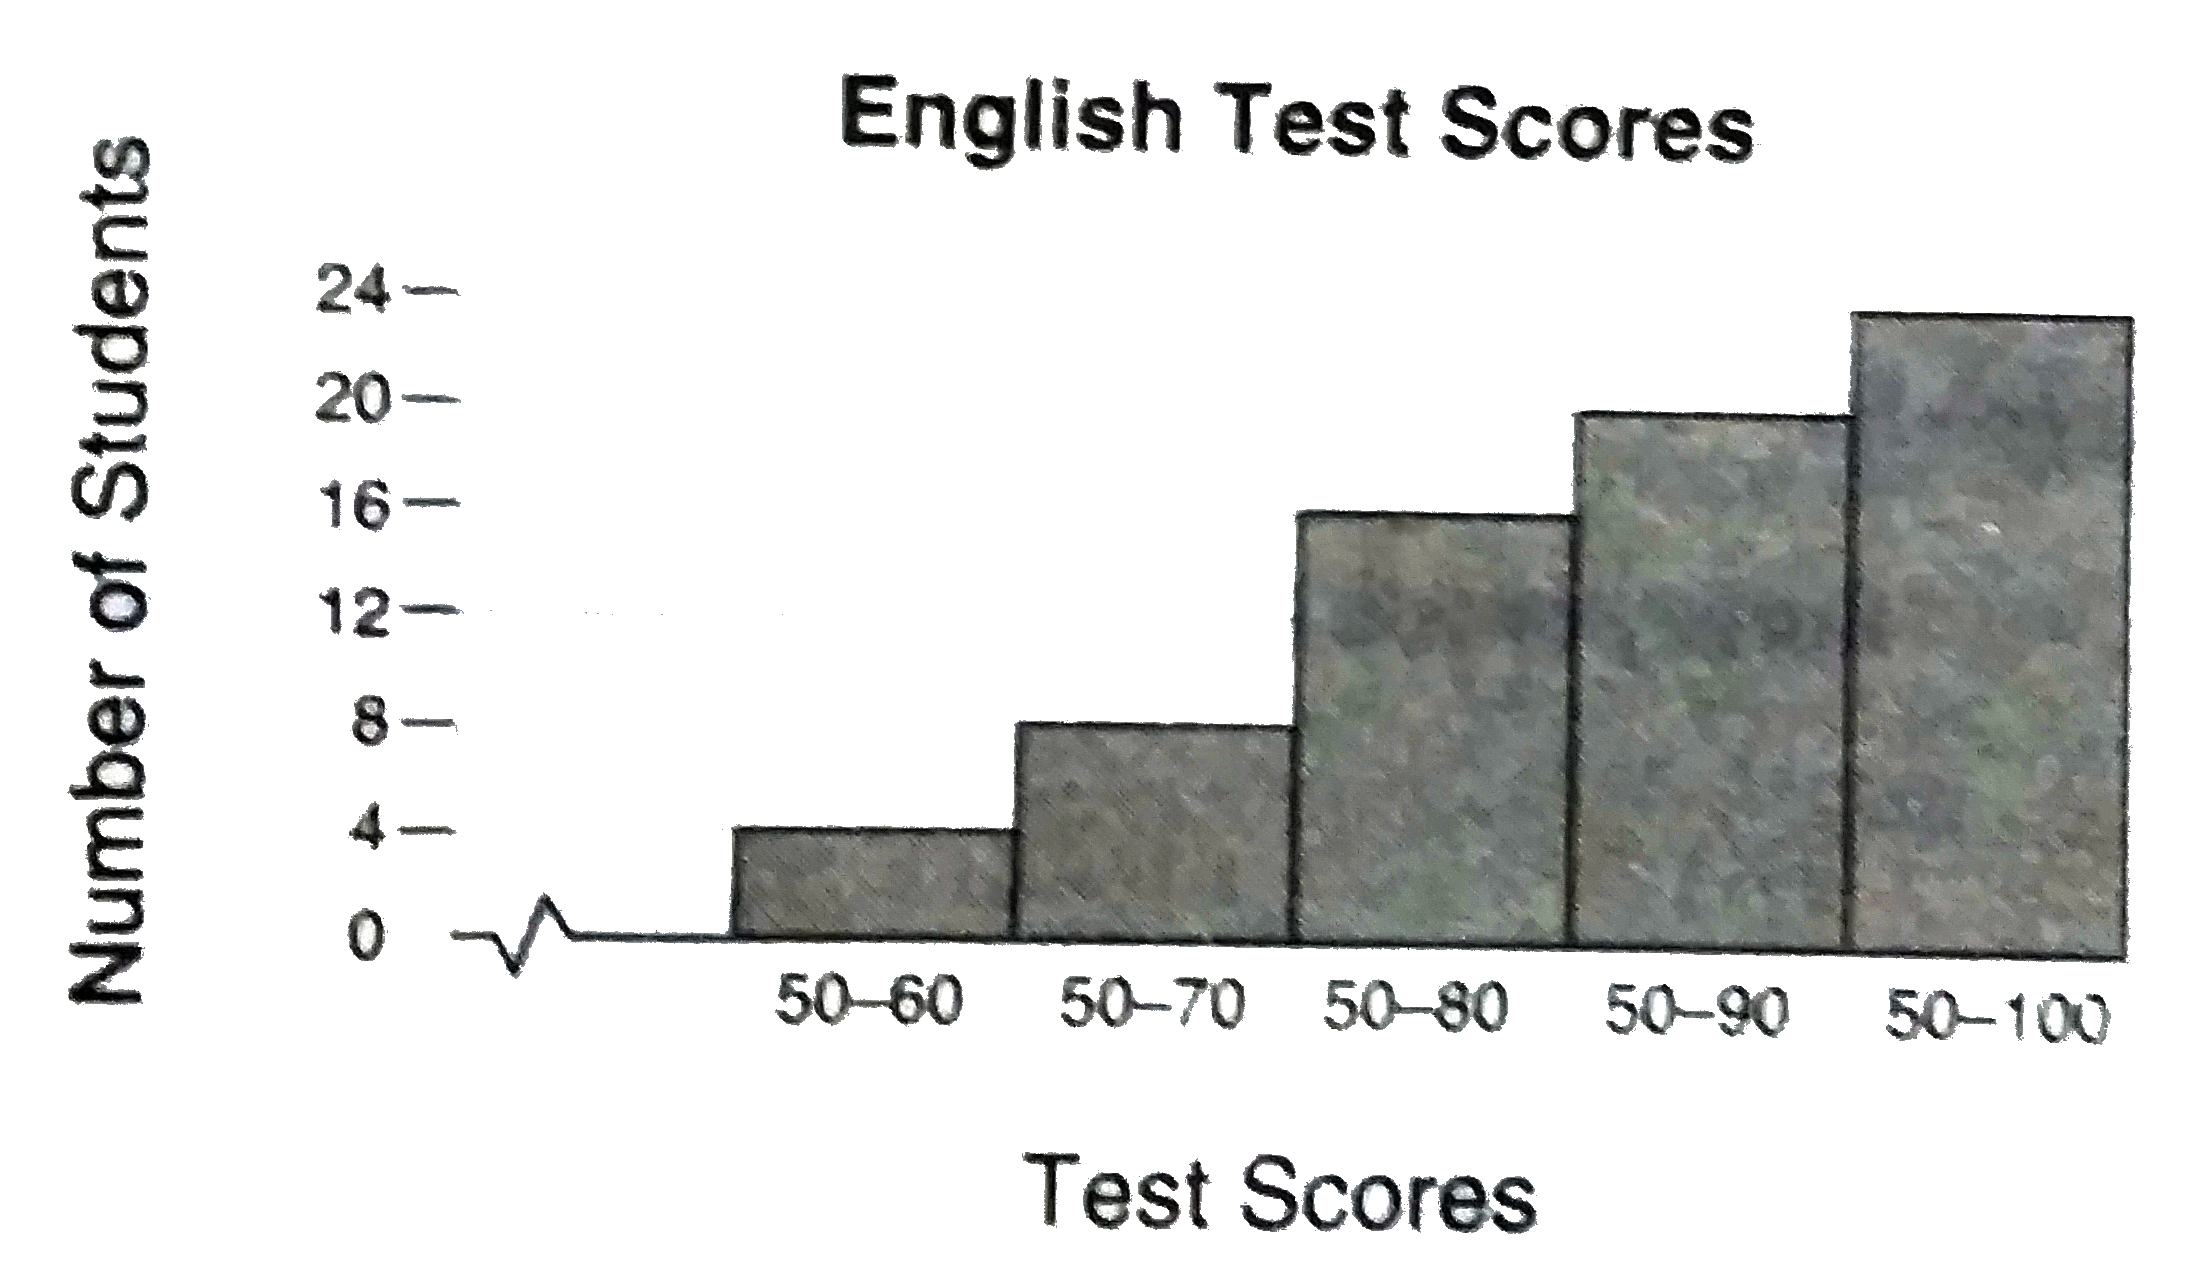
The cumulative histrogram above shows the distribution of scores that 24 students received on an English test. If a students is selected at random, what is the probability that the student will have a score between 71 and 80?A16B13C12D23For 20 quiz scores in a typing class, the table below gives the frequency of the scores in each score interval. Which score interval contains the median of the scores?
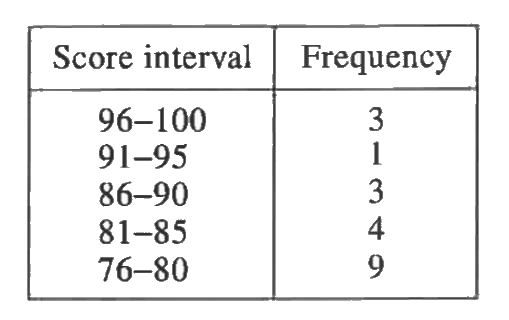 A96-100B91-95C86-90D81-85
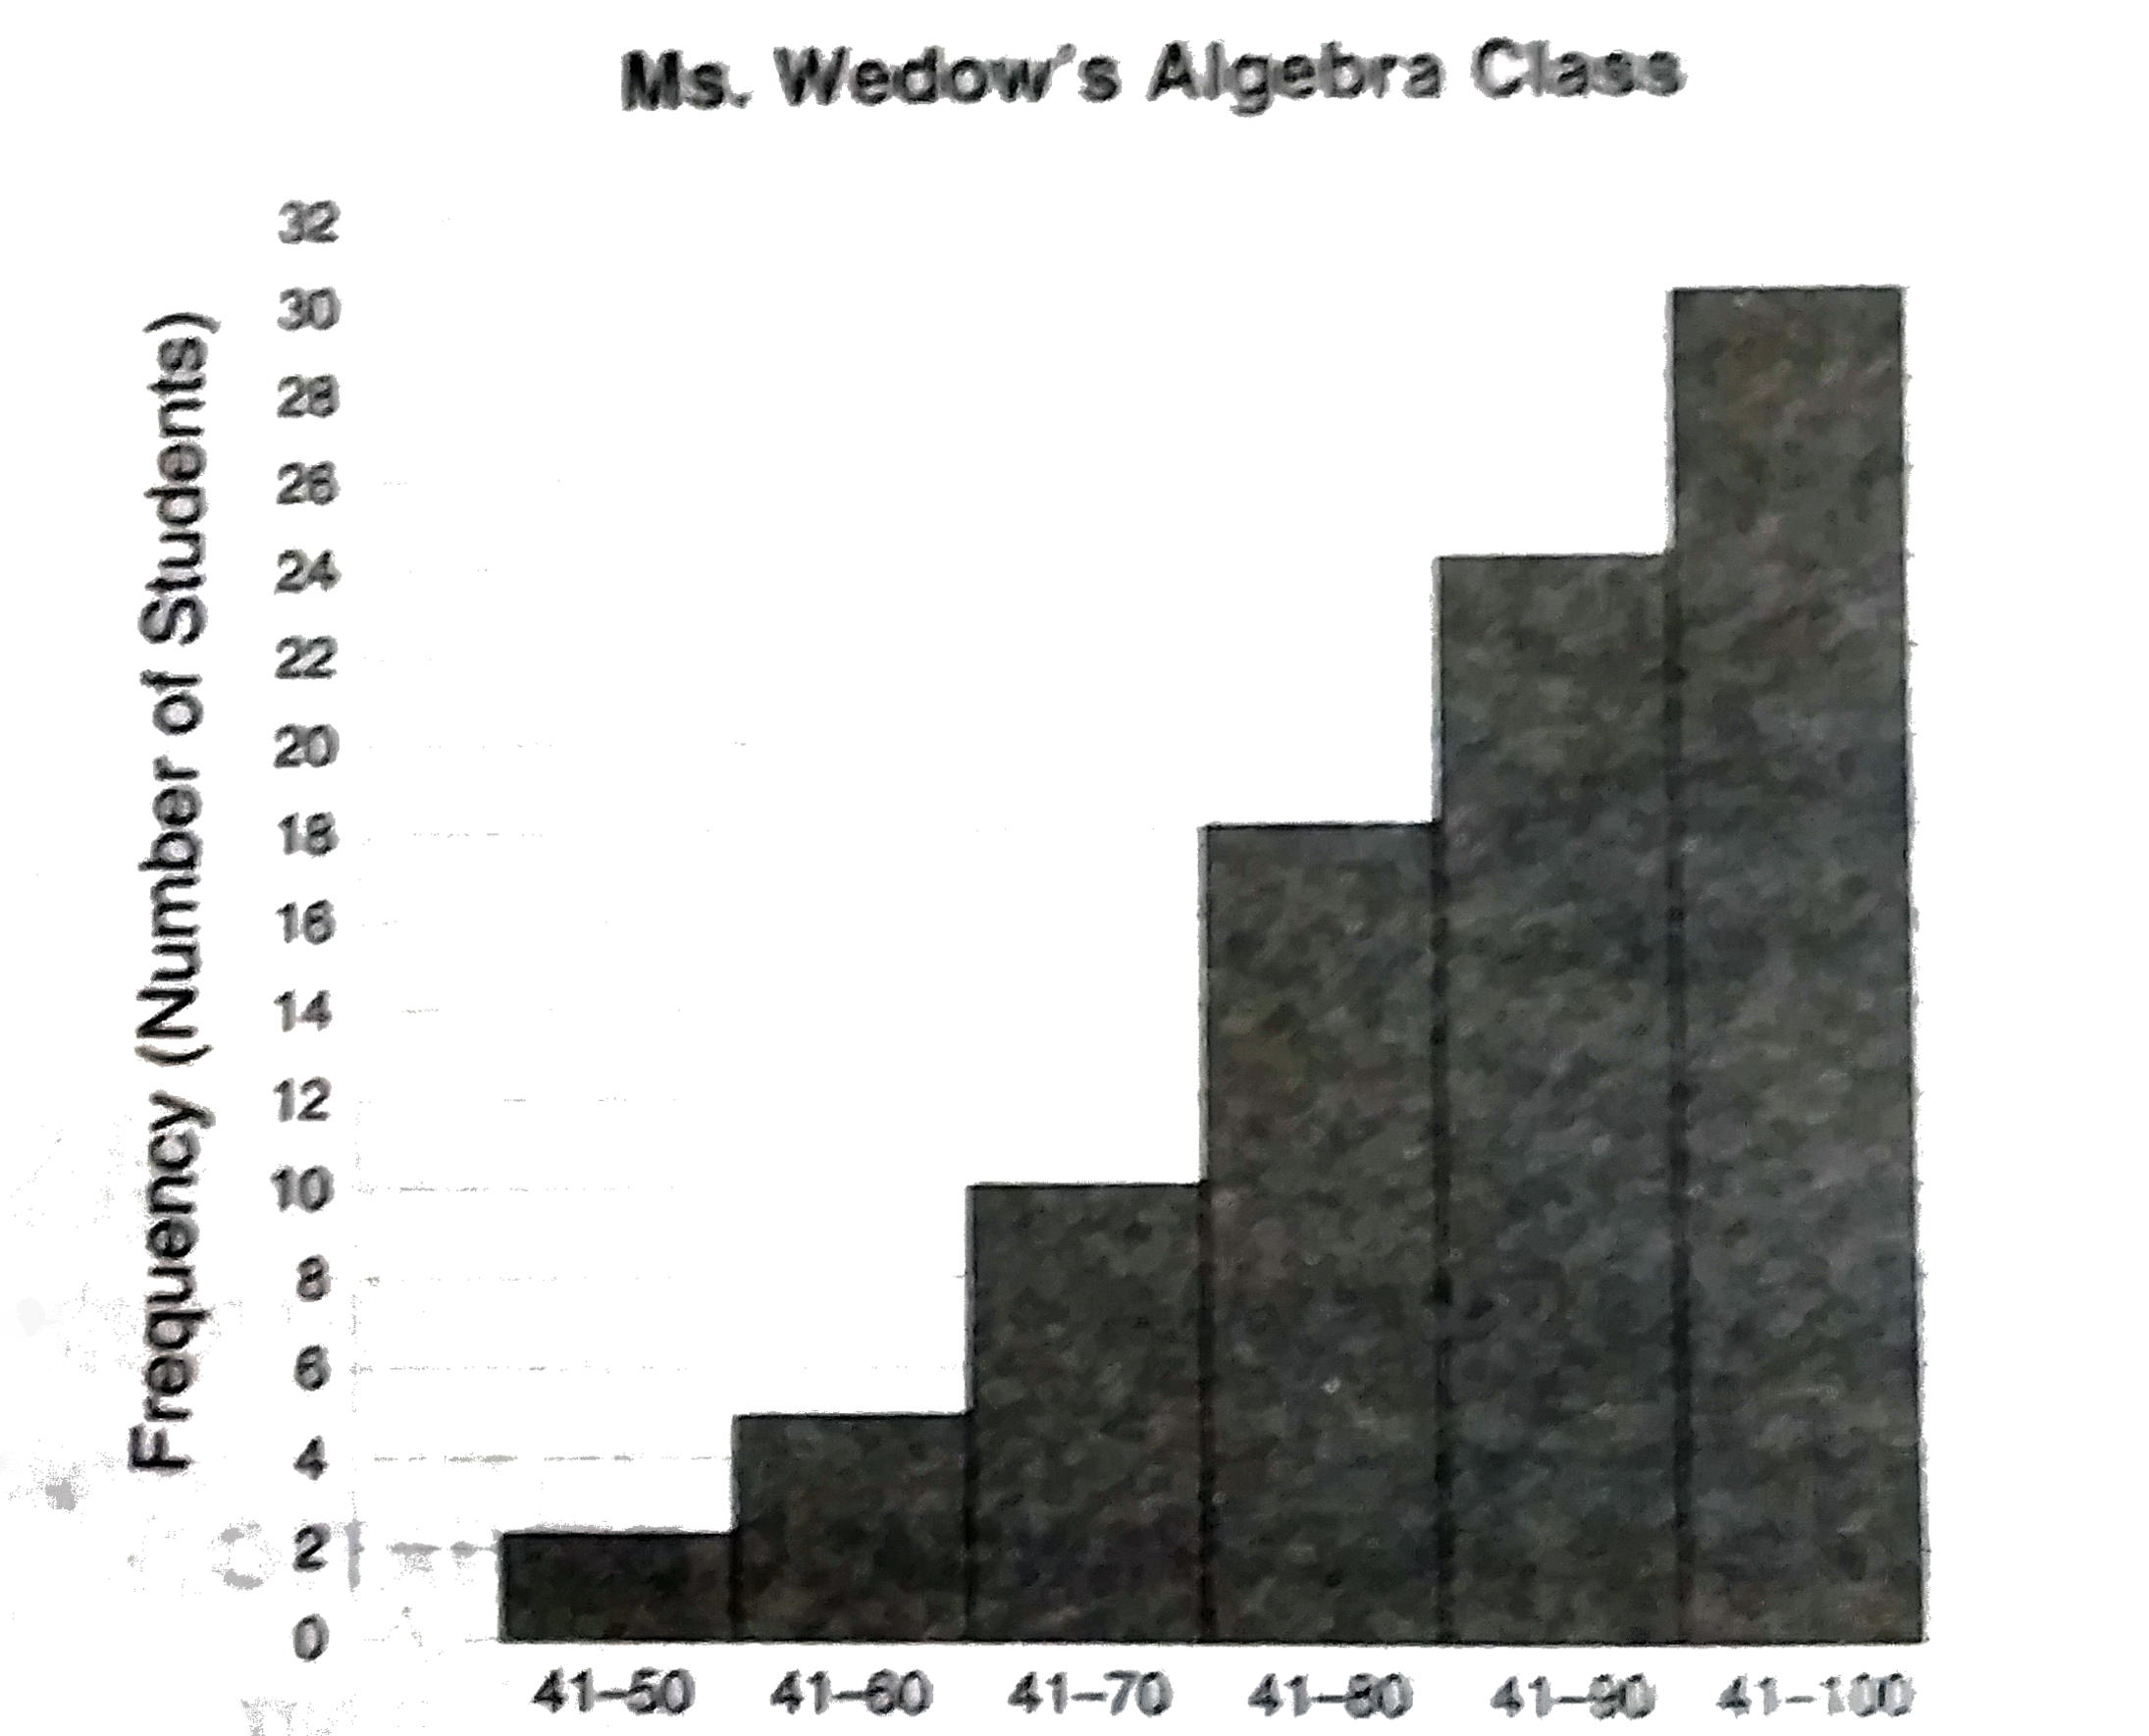
The diagram above shows a graph of the student's test scores in Ms. Wedow's algebra class. Which ten-point interval contains the median?A61−70B71−80C81−90D91−100
A dice is throuwn two times and the total score in two throws is noted. Find the probability that the total score is :
6
View SolutionA dice is throuwn two times and the total score in two throws is noted. Find the probability that the total score is :
at least 6.
View SolutionA dice is thrown two times and the total score in two throws is noted. Find the probability that the total score is :
an even number
View Solution
The frequency chart shows test scores for a certain class. The total number of student is 31. If a student in the class was picked at random , what is the probability that the student's score was below 71 ?
View SolutionTwo dice are thrown simultaneously. What is the probability obtaining a total score less than 11?
View Solution
