Which of the following curves corresponds to the titration of a weak base with a strong acid?


The correct Answer is:C
Topper's Solved these Questions
Similar Questions
Which of the following pH curve represent the titration of weak acid and strong base (dotted line show equivalence point)?
View SolutionConductance measurements and be used to detect the end point of acid-base titrations. Which of the following plots correctly represents the end point of the titration of strong acid and a strong base?
View Solution
Knowledge Check
Which of the following pH curve represent the titration of weak acid and strong base (dotted line show equivalence point)?
A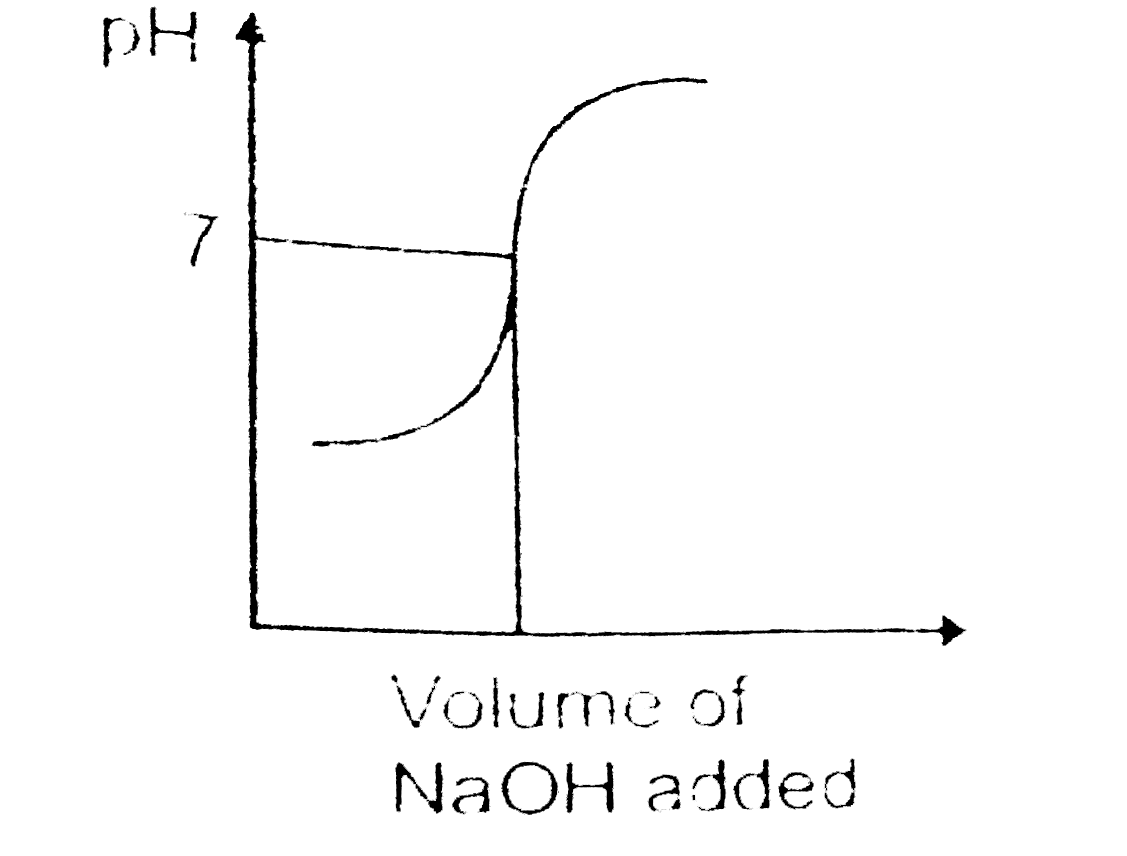 B
B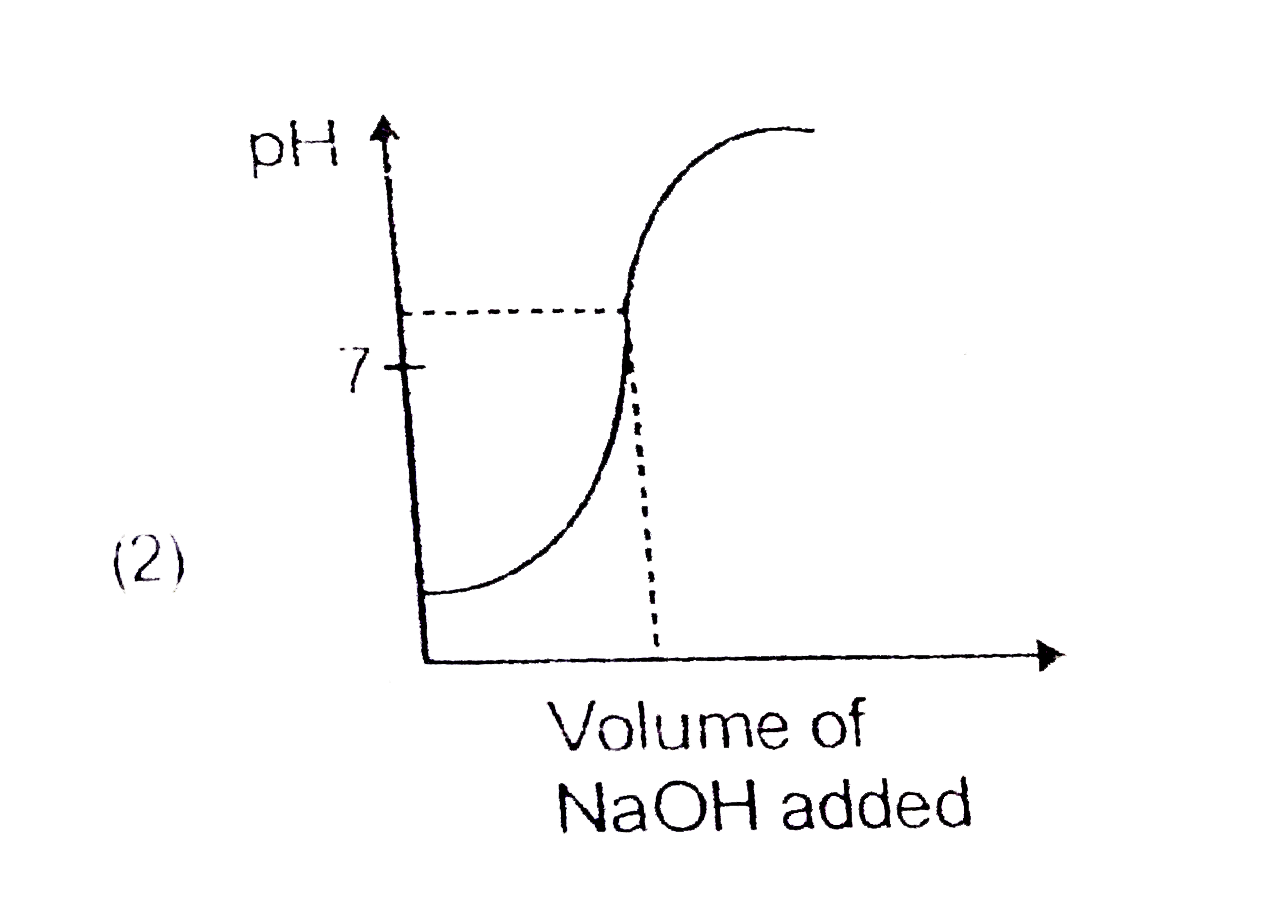 C
C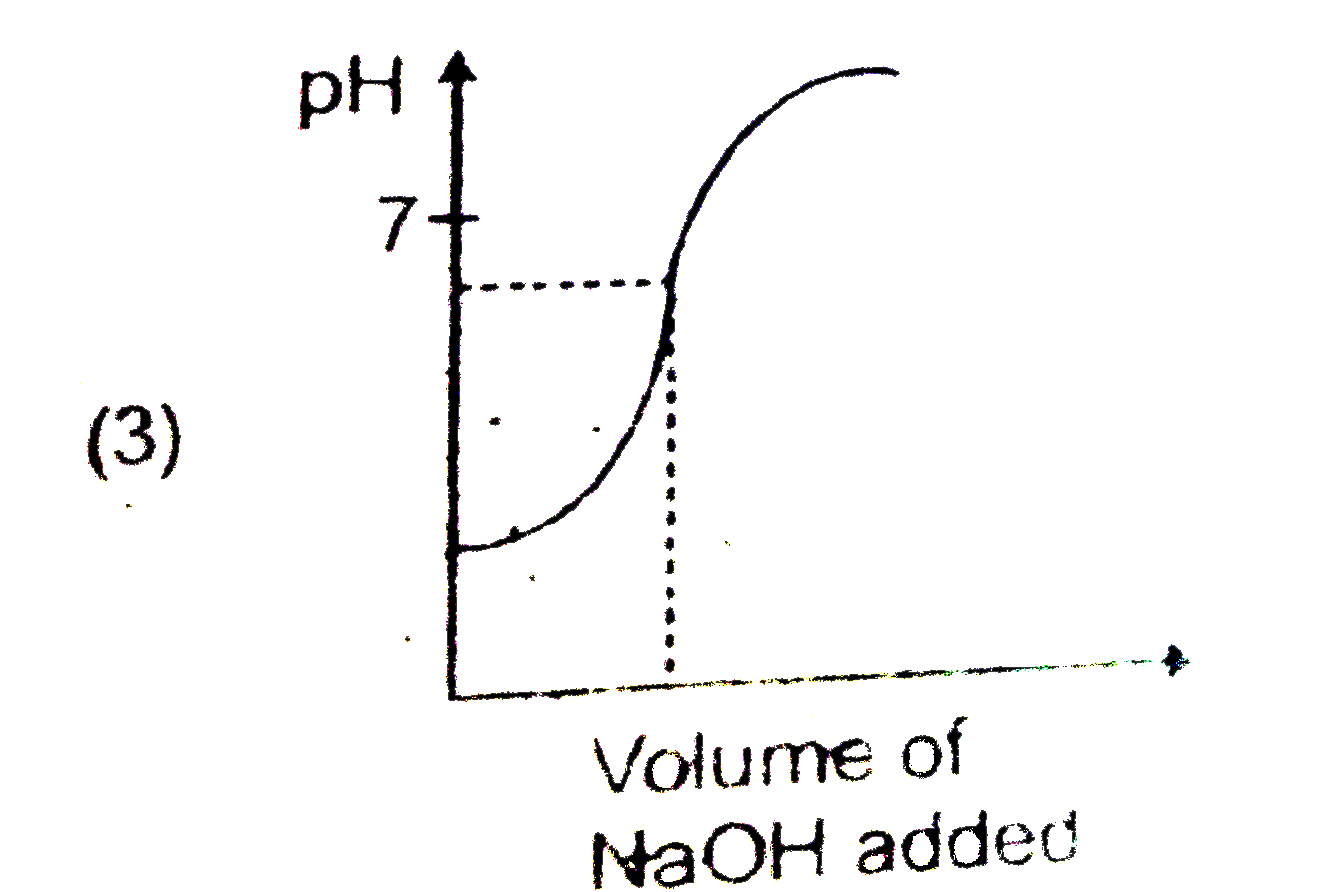 D
D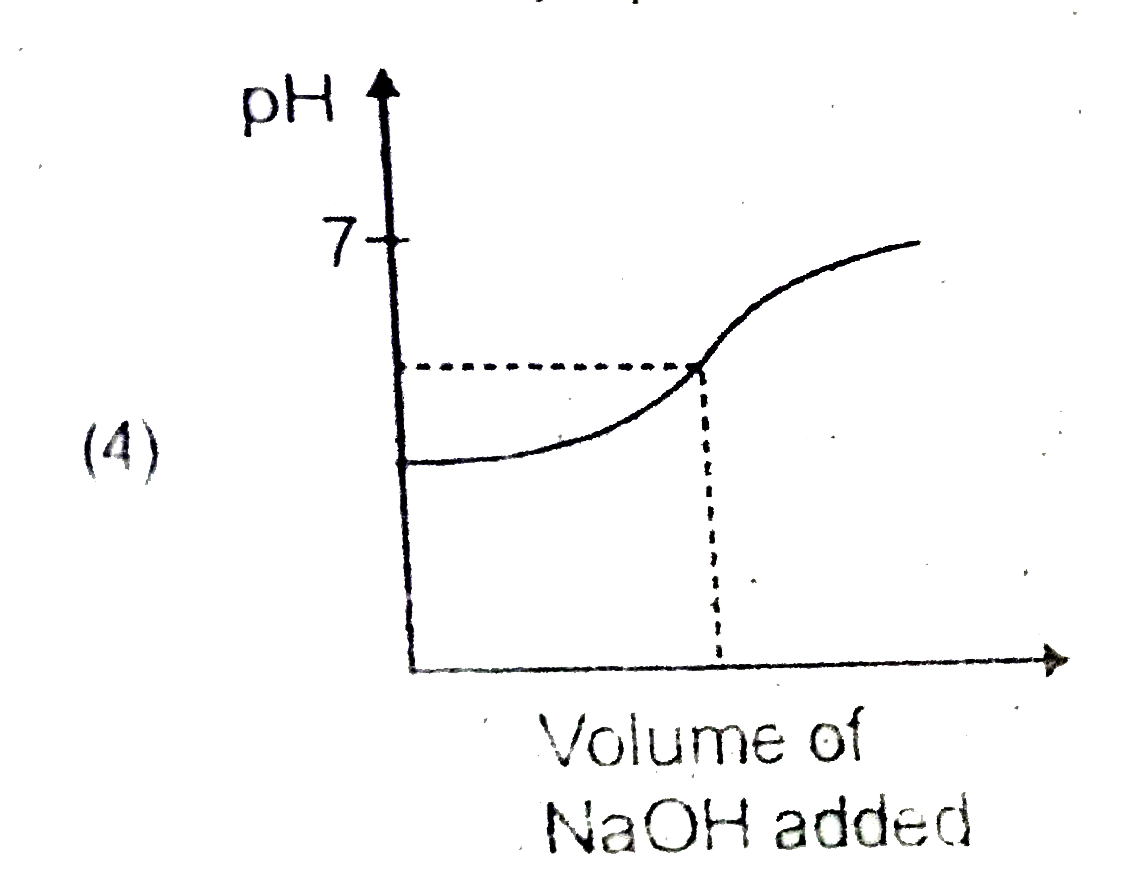
Which of the following can be enthalpy of neutralisation of a weak acid and a strong base?
A−57.1kJB58.1kJC−56.1kJD114.2kJConductance measurements and be used to detect the end point of acid-base titrations. Which of the following plots correctly represents the end point of the titration of strong acid and a strong base?
A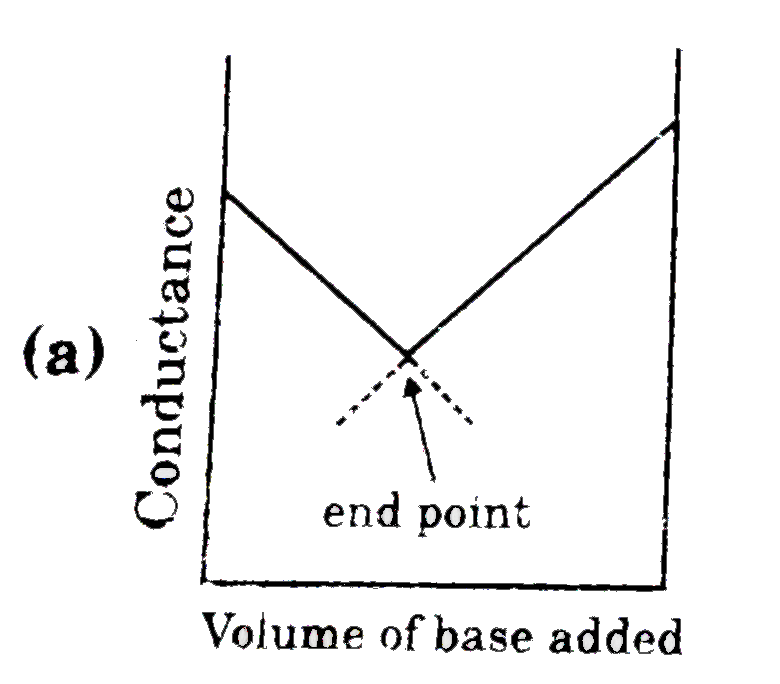 B
B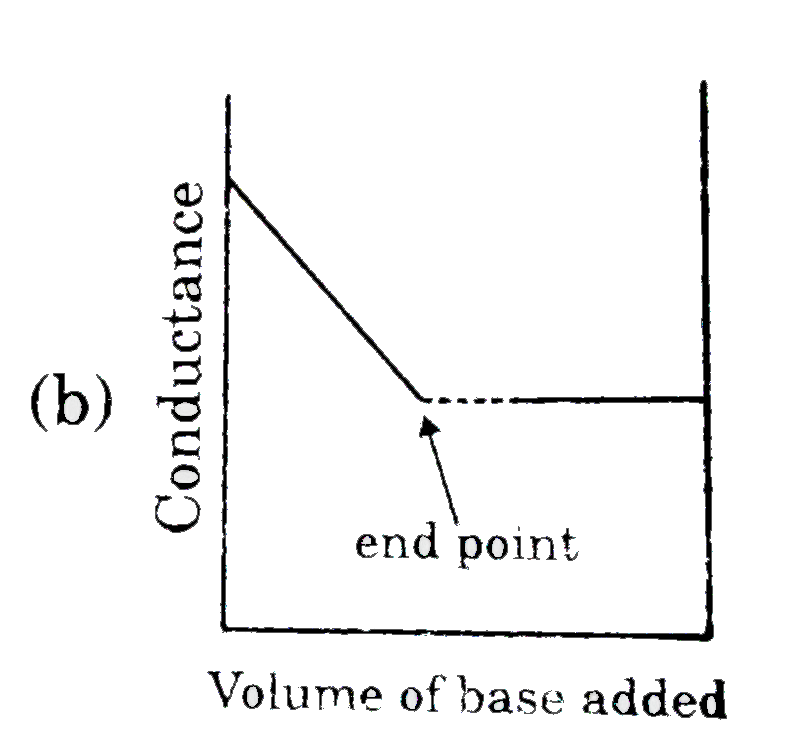 C
C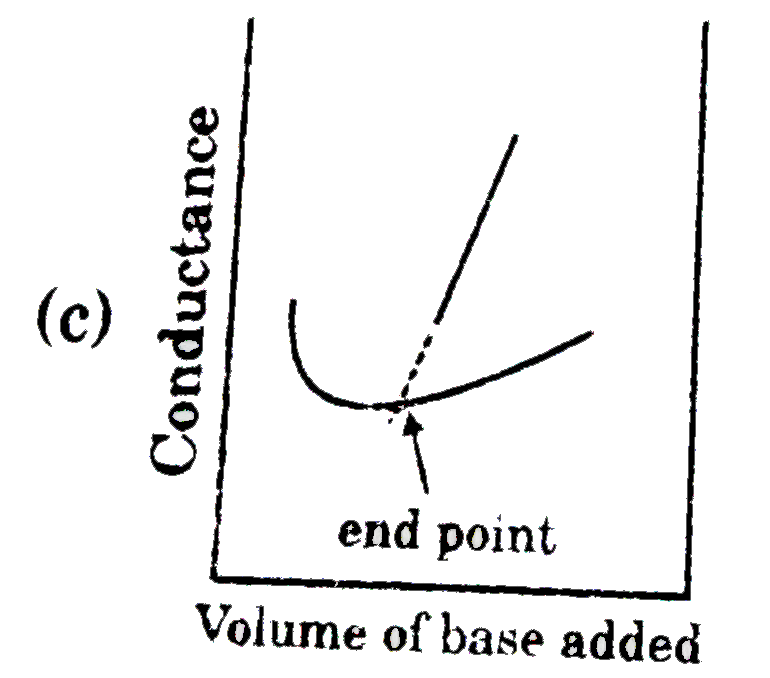 D
D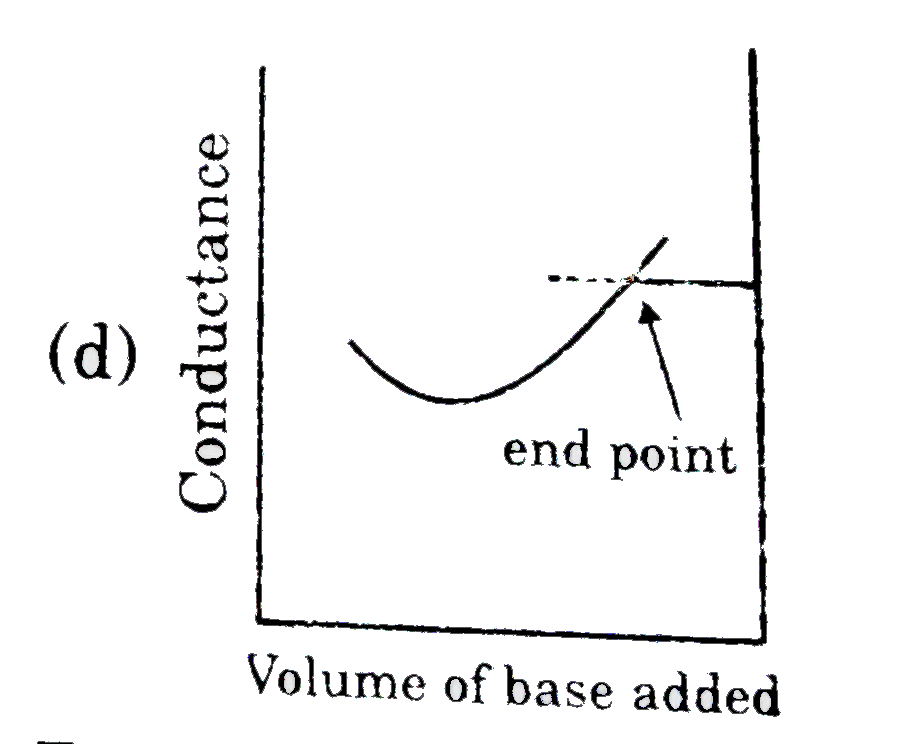
The best indicator for the detection of the end point in the titration of a weak acid and a strong base is
View SolutionWhich of the following salts is formed when by the neutralisation of a strong acid by a weak base?
View SolutionWhich of the following salts is formed when by the neutralisation of a strong acid by a weak base?
View SolutionThe best indicator for the detection of the end point in the titration of a weak acid and a strong base is
View SolutionWhich of the following plots will obtained for a conductomeric titration of strong acid against a weak base?
View Solution
