Biome distribution with respect to annual temperature and precipitation is given below. Identify grassland and coniferous forest by selecting the correct option:

A and B
B and E
B and D
C and D
The correct Answer is:B
Topper's Solved these Questions
- POPULATION : INTERACTIONS AND ATTRIBUTESBOOK - GRB PUBLICATIONCHAPTER - POPULATION : INTERACTIONS AND ATTRIBUTESEXERCISE - NCERT Corner (Exemplar Problems)
32 Videos
- PLANT BREEDING AND TISSUE CULTUREBOOK - GRB PUBLICATIONCHAPTER - PLANT BREEDING AND TISSUE CULTUREEXERCISE - NCERT CORNER
15 Videos
- REPRODUCTION IN ORGANISMSBOOK - GRB PUBLICATIONCHAPTER - REPRODUCTION IN ORGANISMSEXERCISE - EXEMPLAR PROBLEMS
33 Videos
Similar Questions
The graph given below is showing biome distribution with respect to annual temperature and precipitation. Identify A, B and C, respectively.
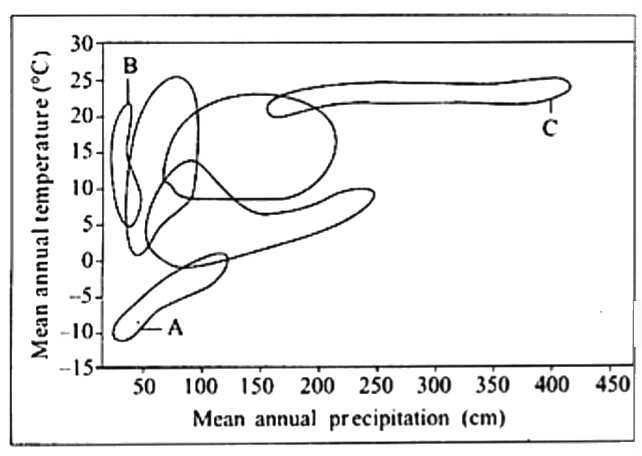
View SolutionThe graph given below is showing biome distribution with respect to annual temperature and precipitation. Identify A, B and C, respectively.

View Solution
Knowledge Check
Diagram of a nucleosome is given below. Identify A, B and C by selecting the correct option :
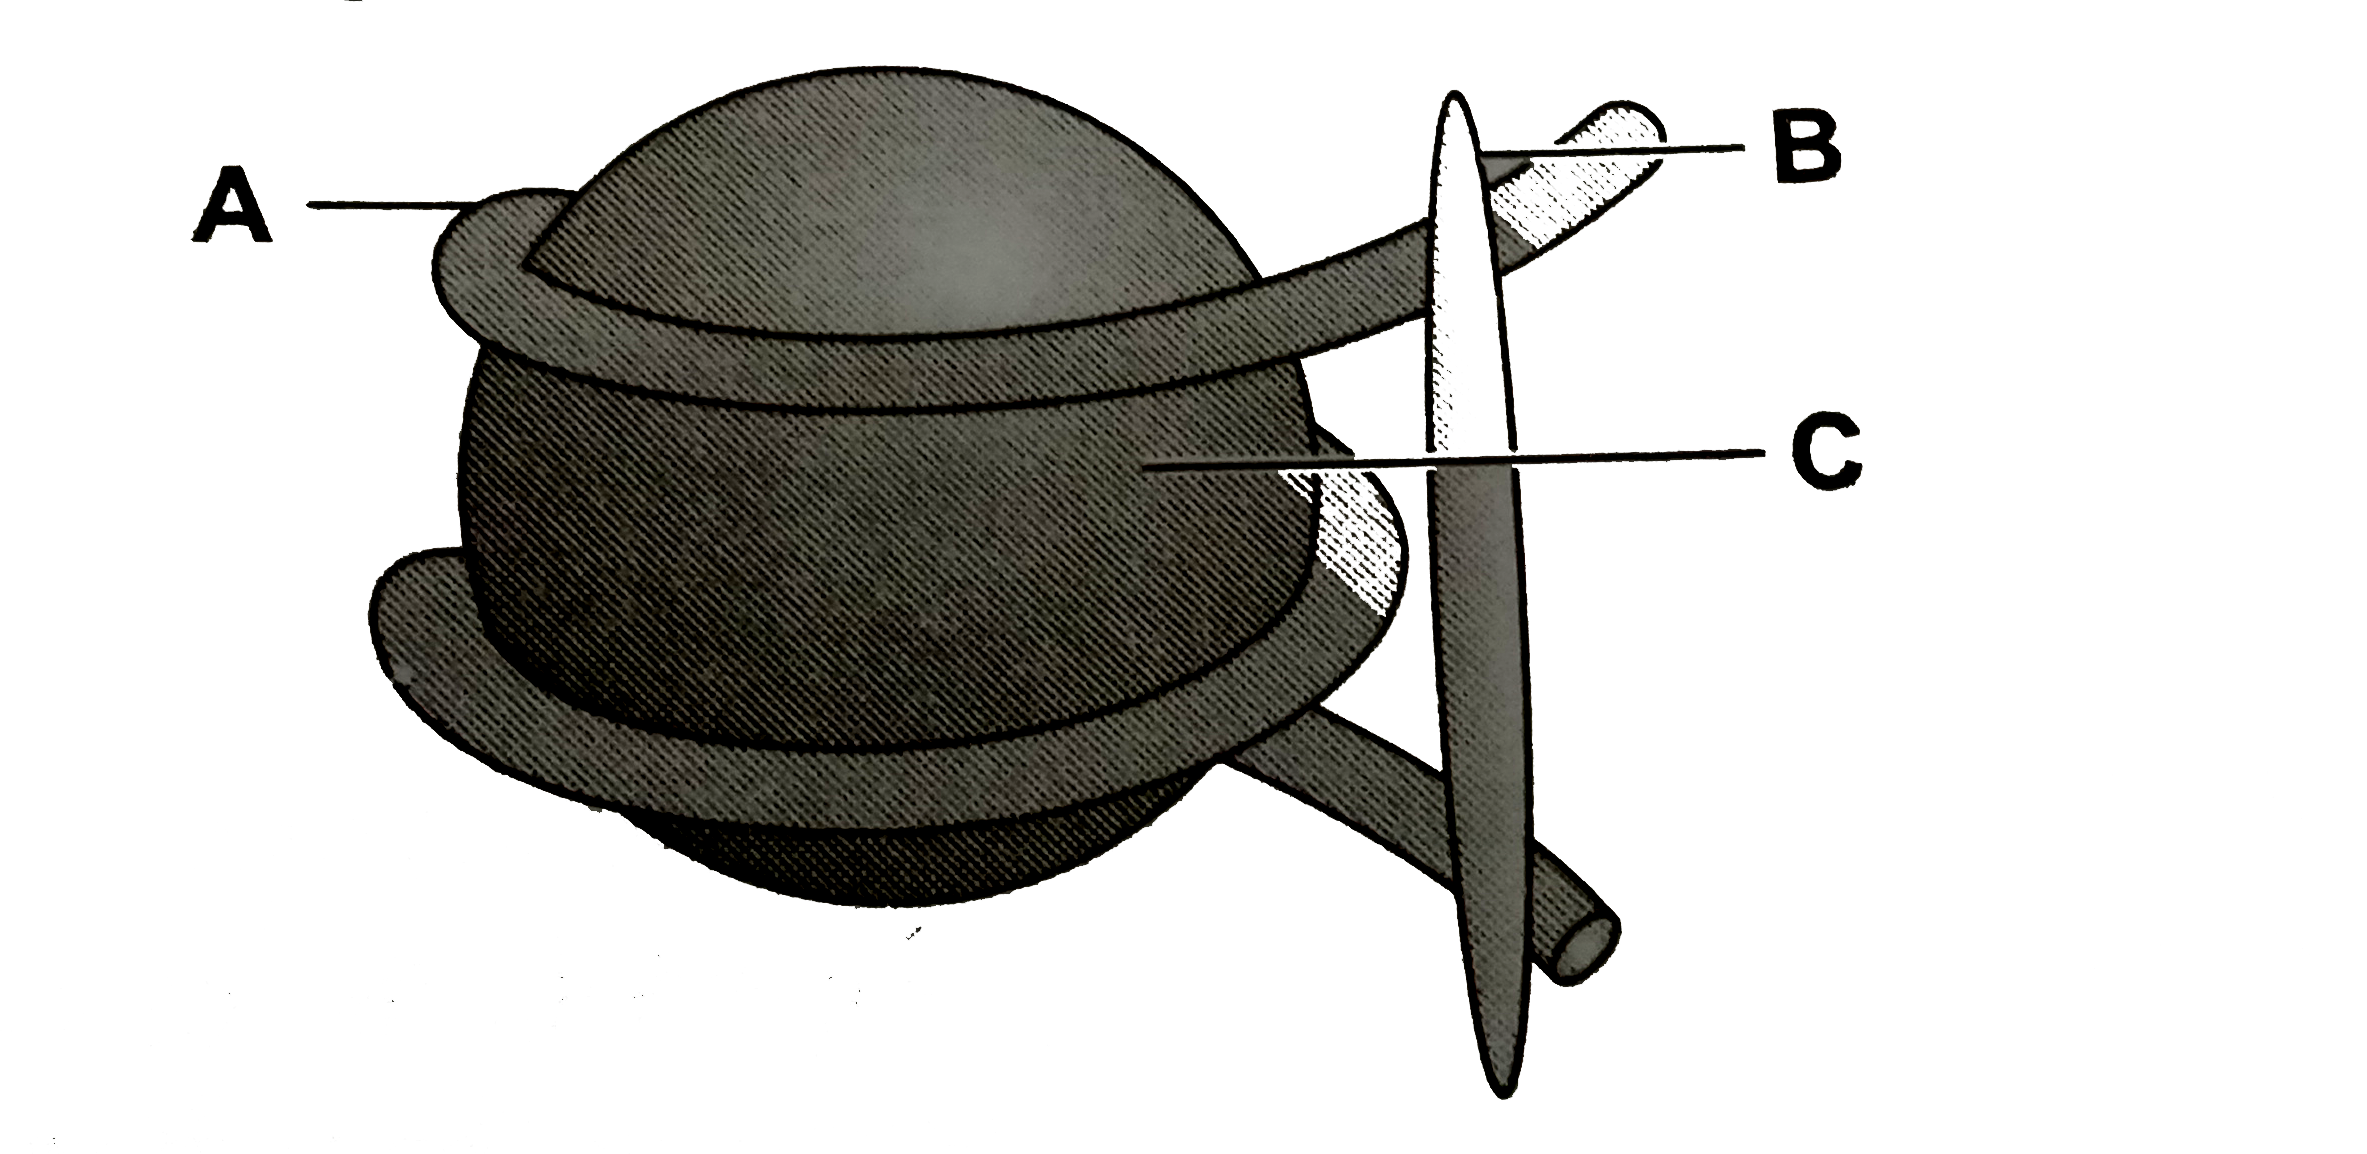 AABDHl HistoneDNAHistone octamerBABDDNAHistone octamerHl HistoneCABDDNAHl HistoneHistone octamerDABDHistone octamerHl HistoneDNA
Diagrammatic view of an electrostatic precipitator is given below. Identify A, B and D by selecting the correct option:
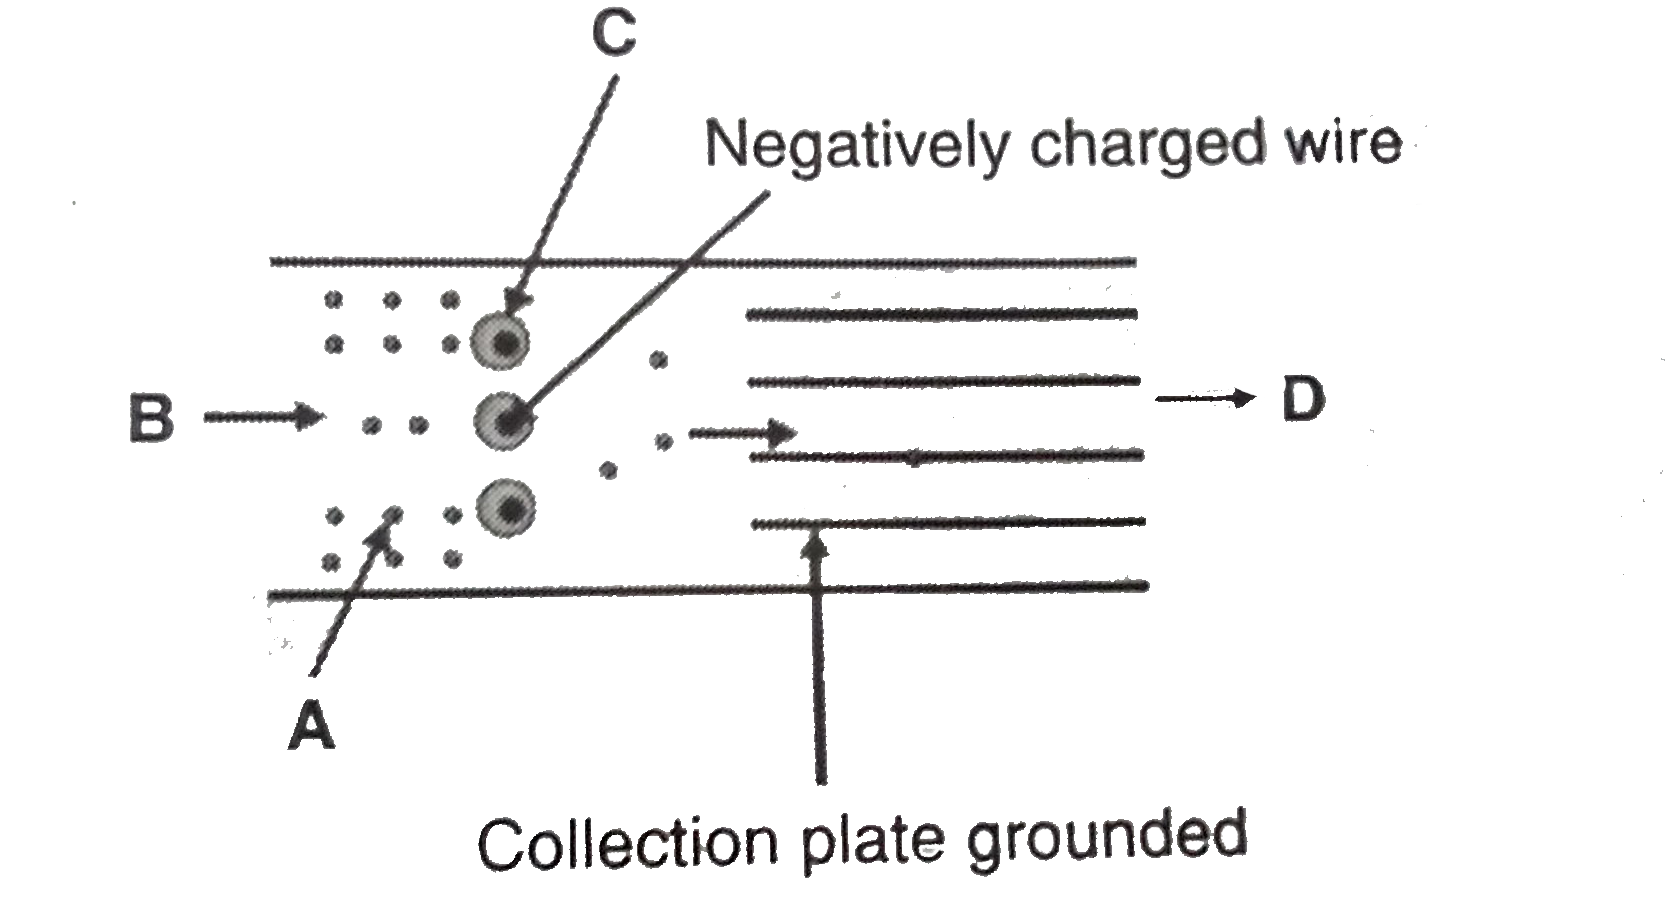 AA. Clean air, B. Dirty air, C. Discharge corona, D. Dust particles.BA. Dirty air, B. Clean air, C. Discharge corona, D. Dust particles.CA. Dust particles, B. Dirty air, C. Discharge corona, D. Clean air.DA. Dust particles, B. Dirty air, C. Clean air, D. Discharge corona.
Identify the given figure and select the correct option.
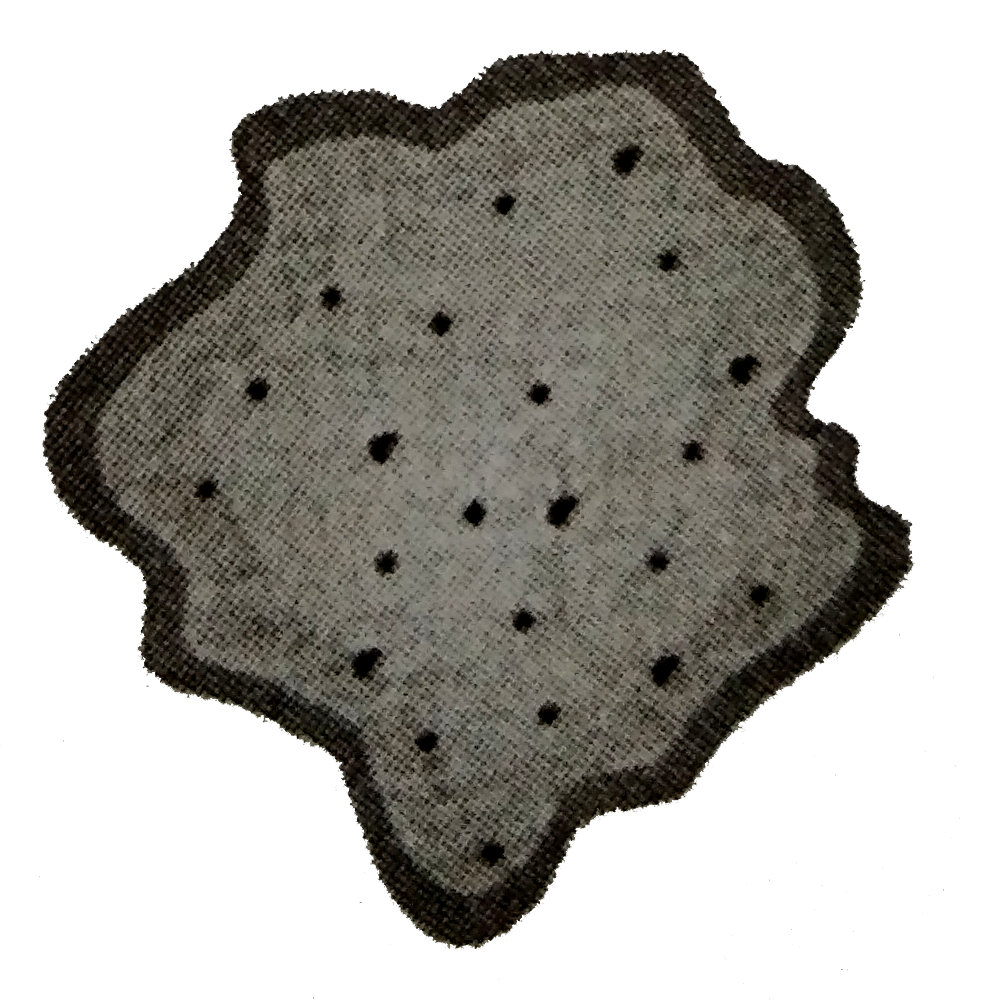 AIt is photosynthetic protist.BIt is saprophytic protist.CIt is chemosynthetic bacteria.DBoth (a) and (b)
In the given diagram , Biome distribution is shown with respect to annual temperatrue and precipitation. Select the correct option.
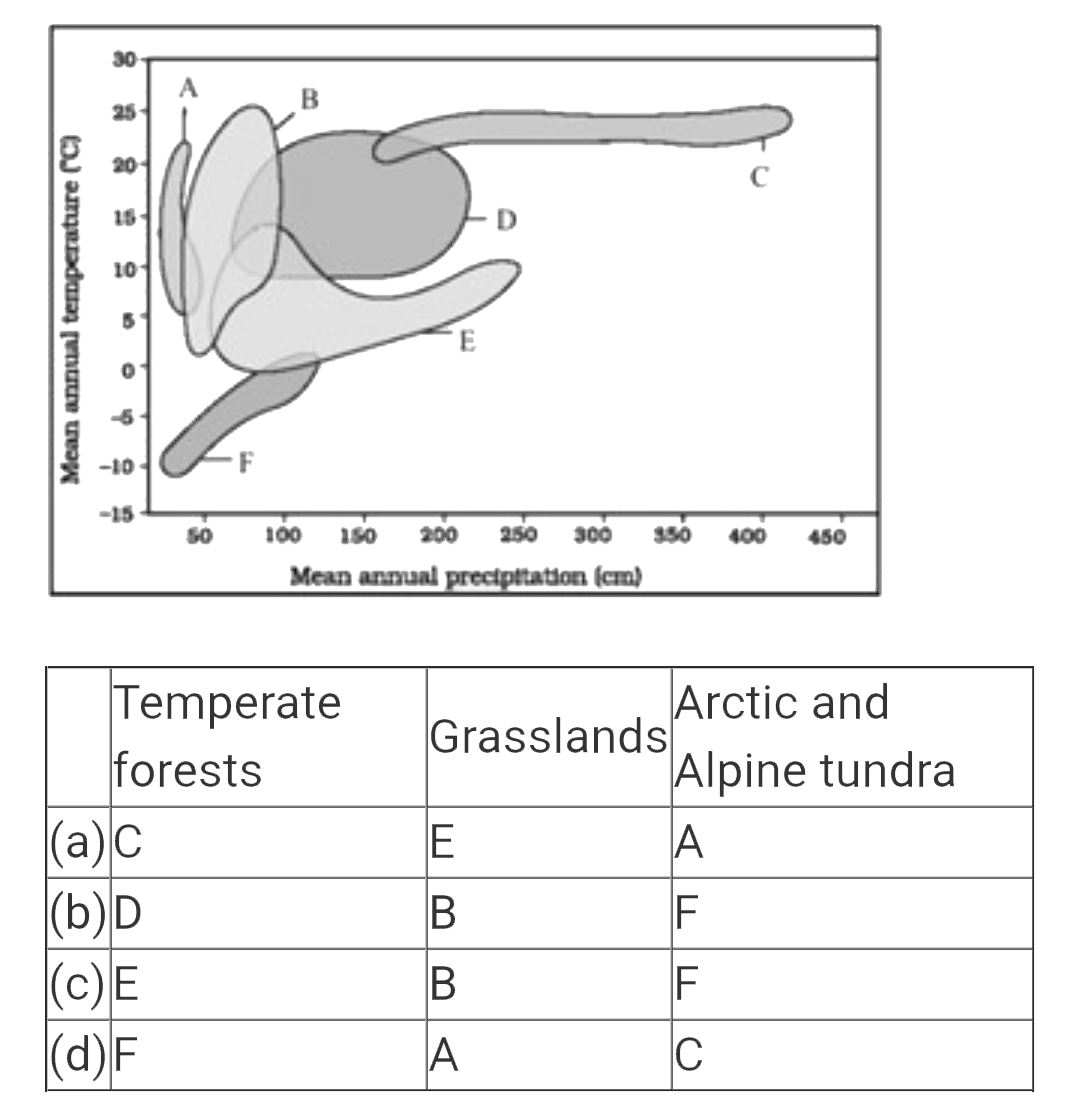
View SolutionIn the given diagram , Biome distribution is shown with respect to annual temperatrue and precipitation. Select the correct option.

View SolutionIdentify A and B in the given figure and select the correct option.
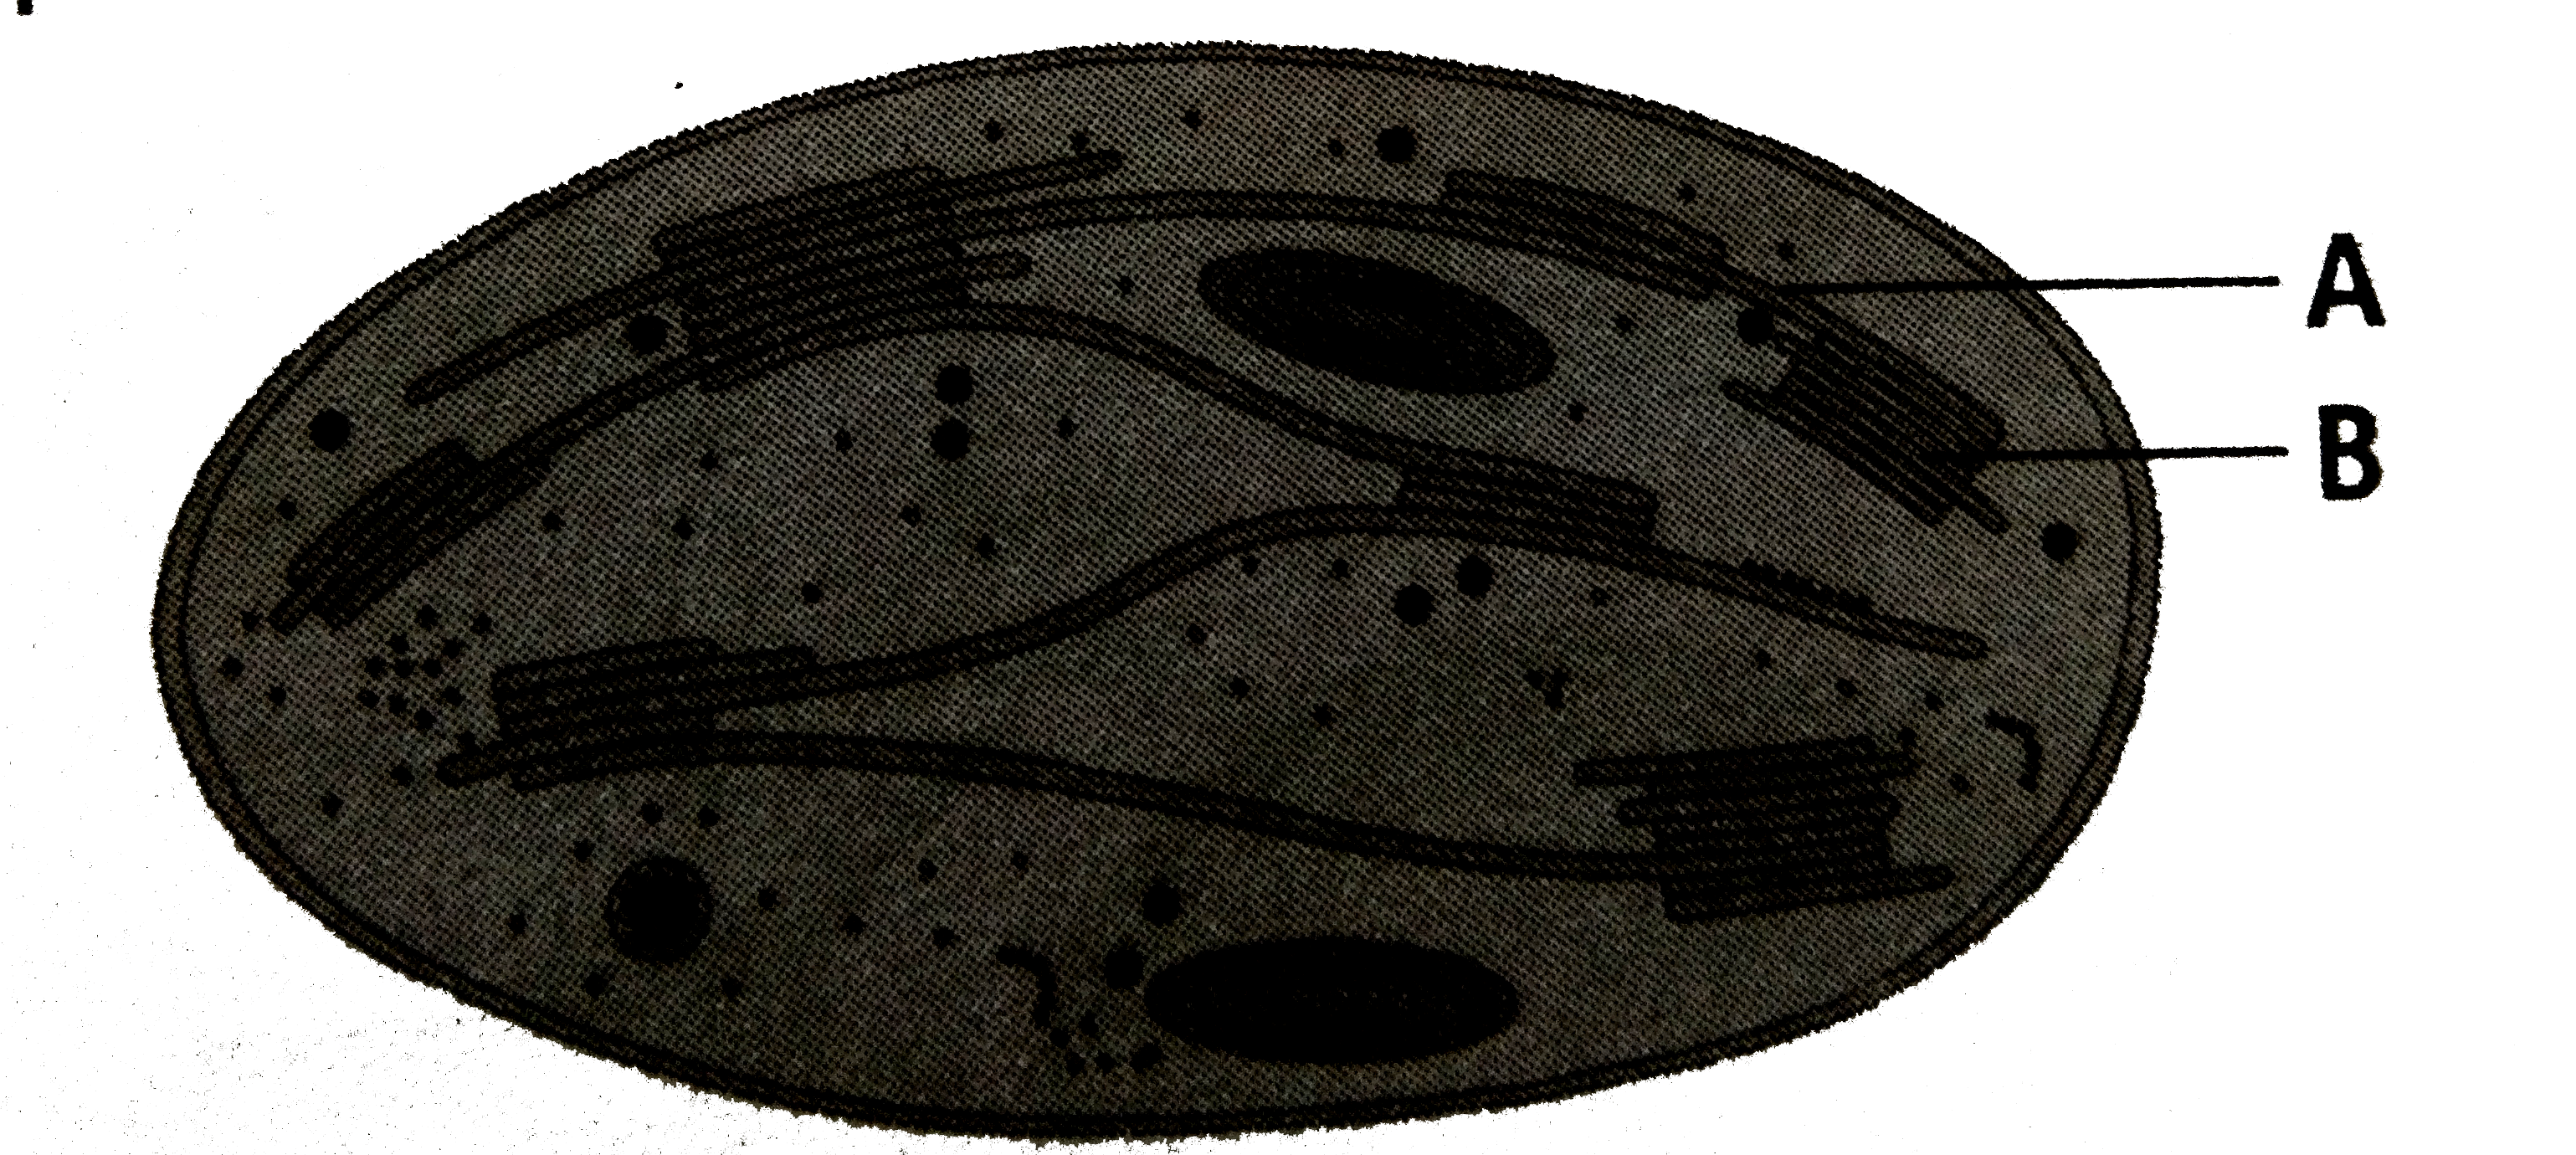
View SolutionIdentify A and B in the given figure and select the correct option.

View SolutionThe given figure shows biome distribution with respect to temperature and precipitation. The option which correctly identifies the biomes marked X and Y respectively is.
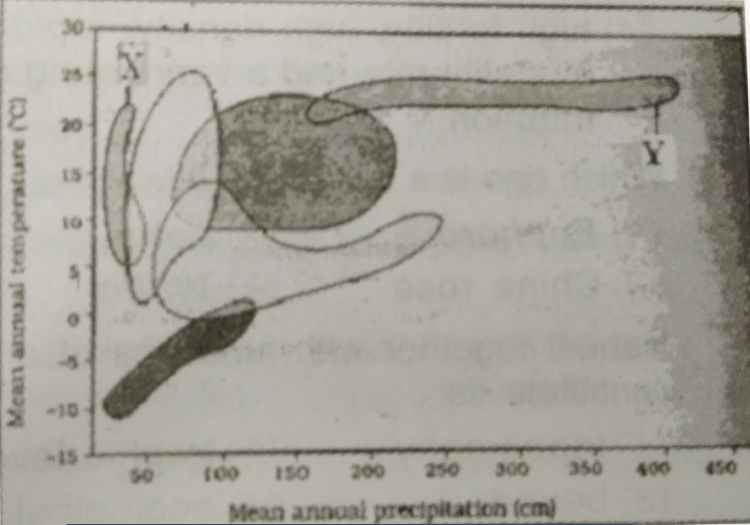
View Solution
