A graph is drawn taking frequency of incident radiation ( v) along the X-axis and its stopping potential (V0) along the Y-axis. The nature of the graph
straight line
a parabola
an ellipse
a circle
The correct Answer is:A
Similar Questions
The graph between frequency of incident radiations and stopping potential for a given photosensitive material as follows.
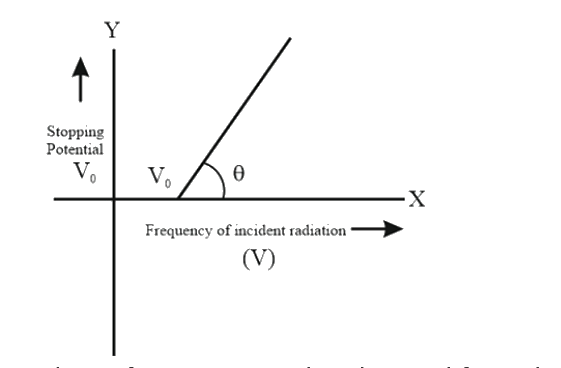
What information can be obtained from the value of the intercept on the potential axis ?
View SolutionThe graph between frequency of incident radiations and stopping potential for a given photosensitive material as follows.

What information can be obtained from the value of the intercept on the potential axis ?
View Solution
Knowledge Check
Which of the following is the graph between the frequency (v) of the incident radiations and the stopping potential ?
A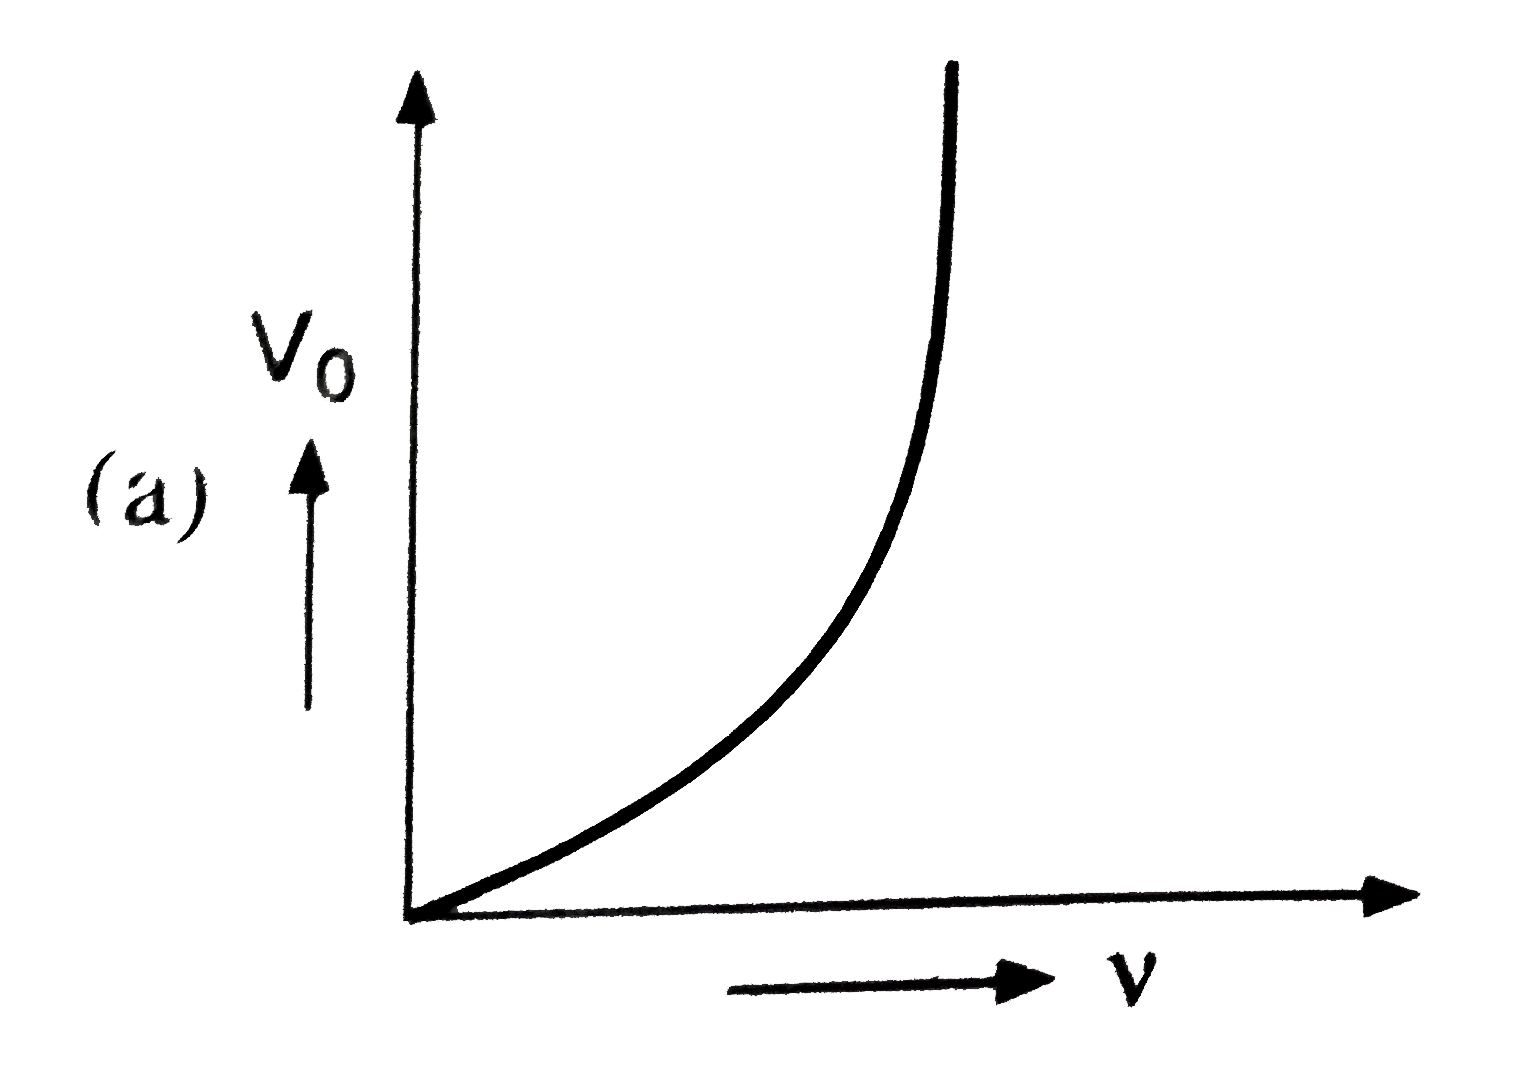 B
B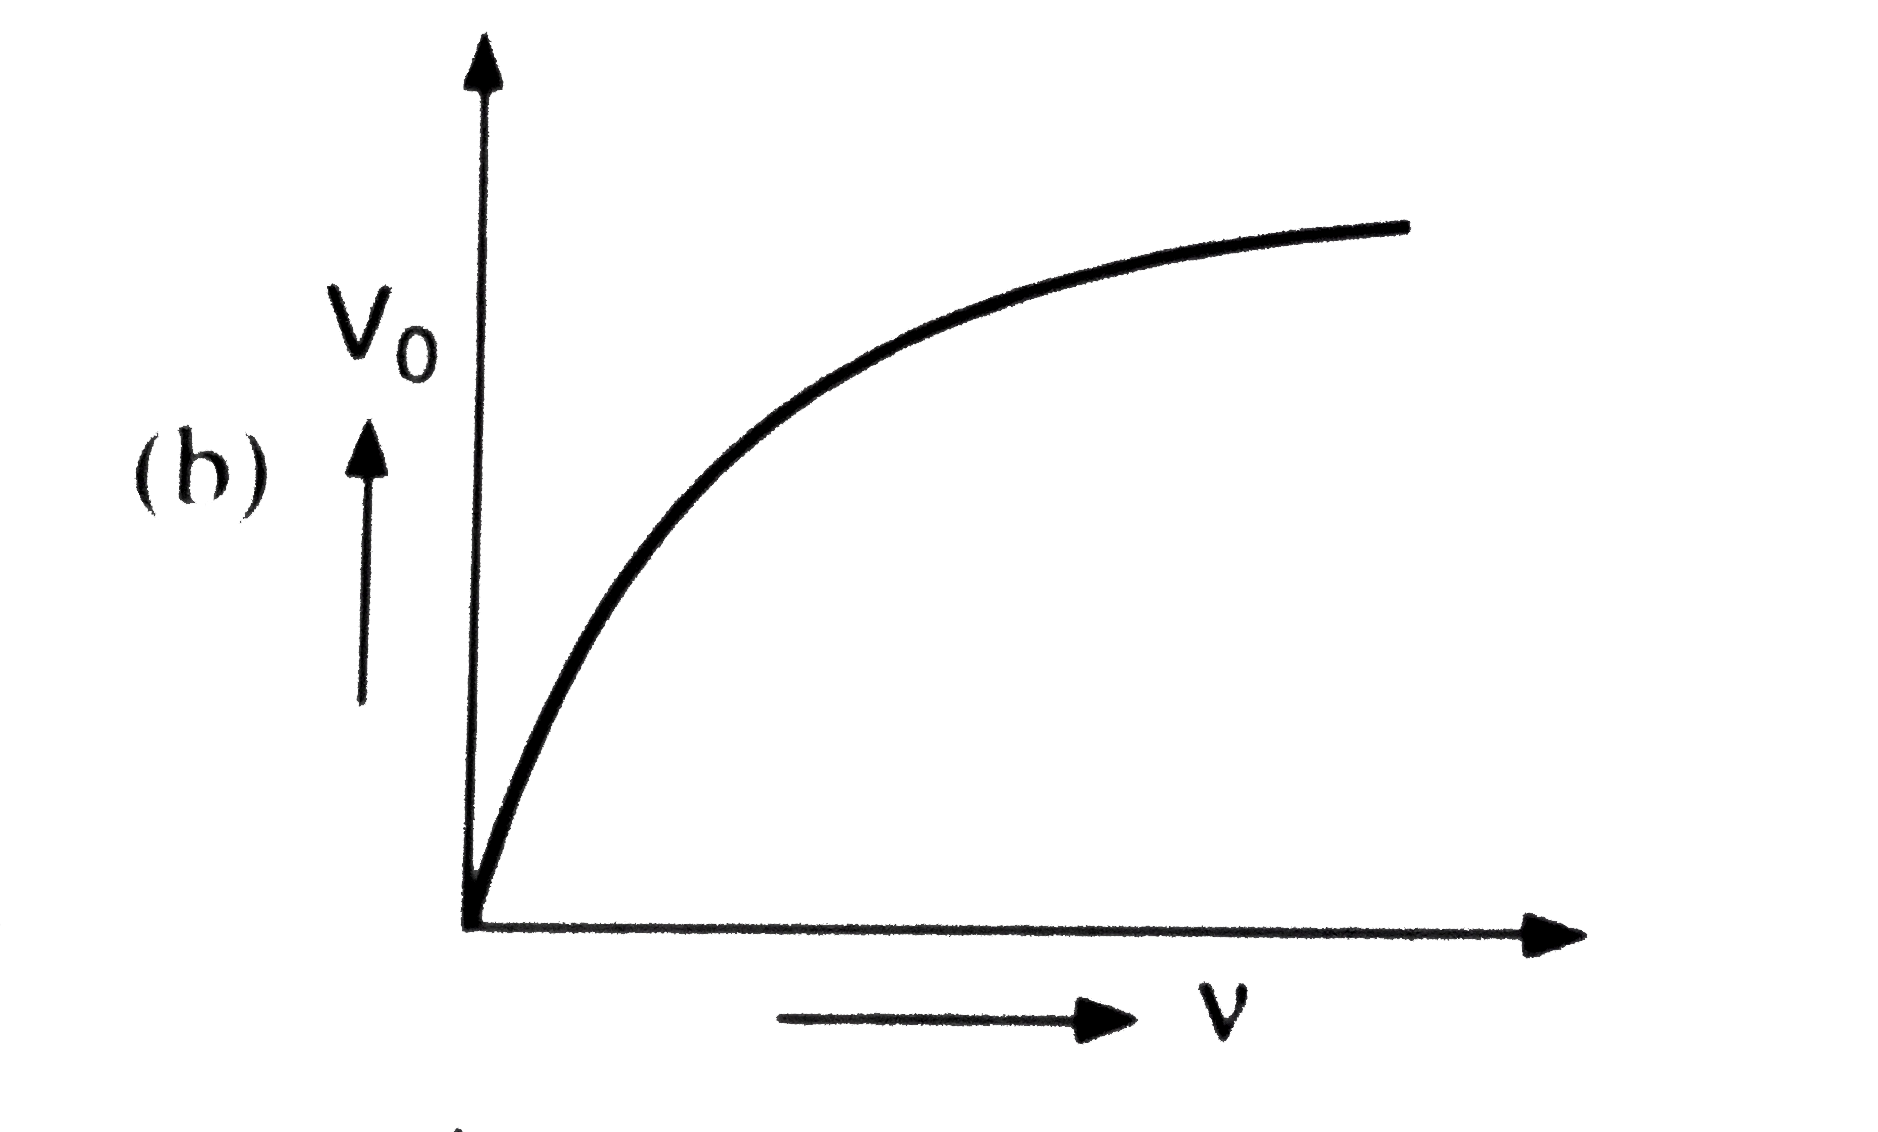 C
C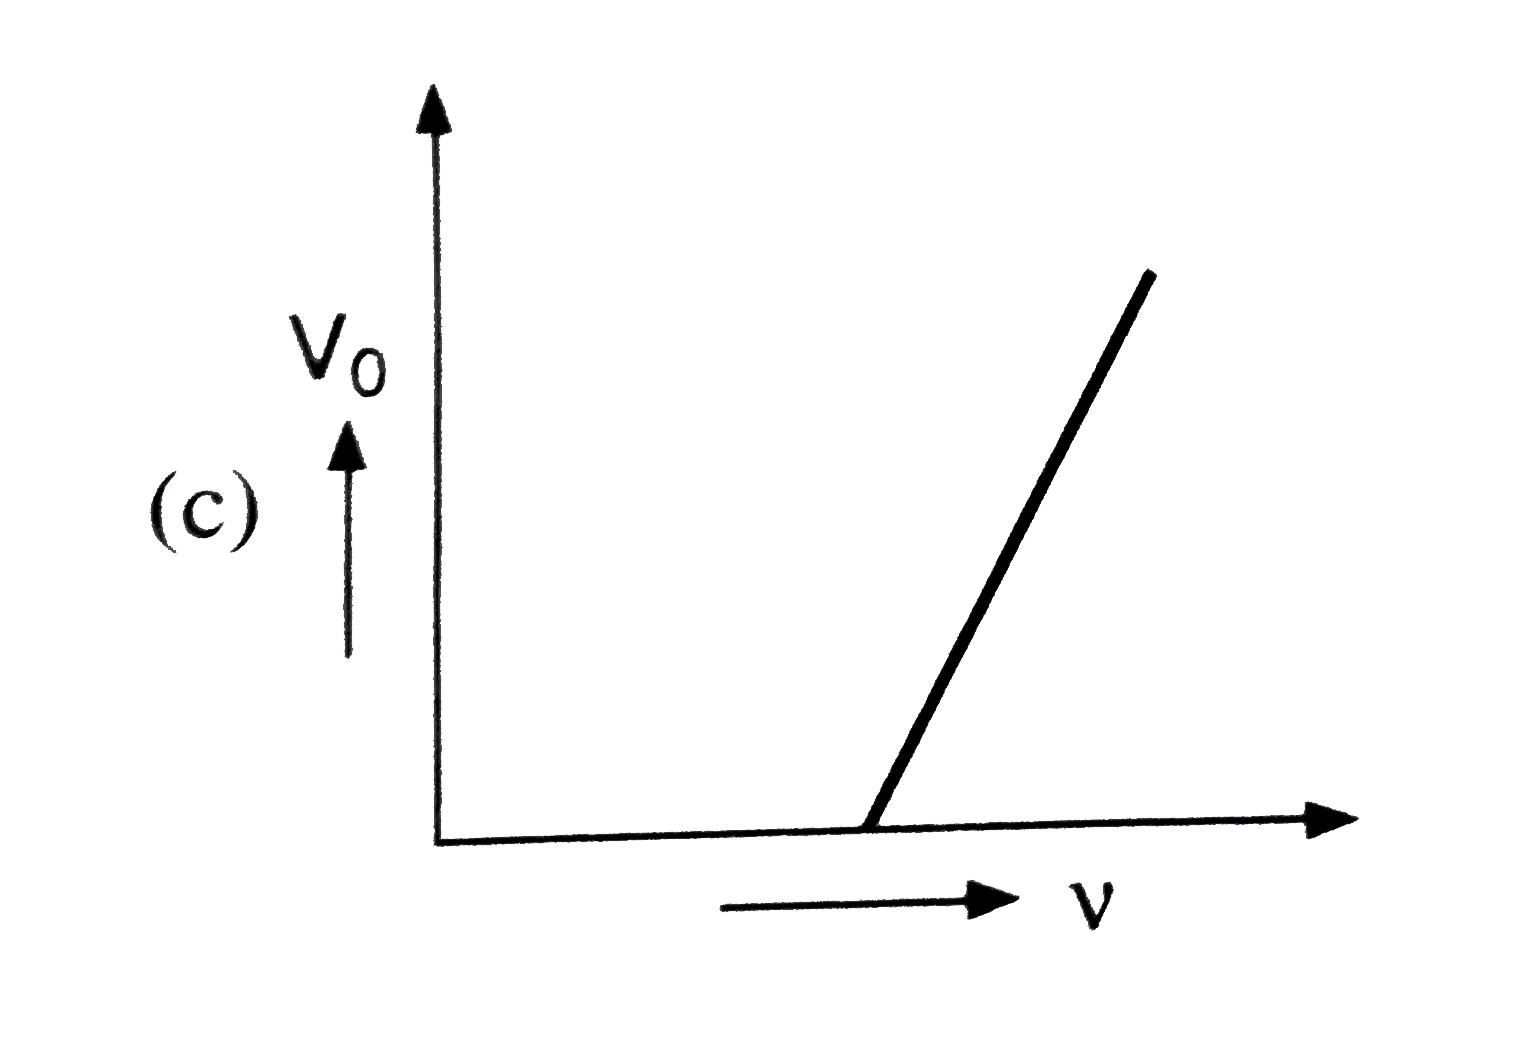 D
D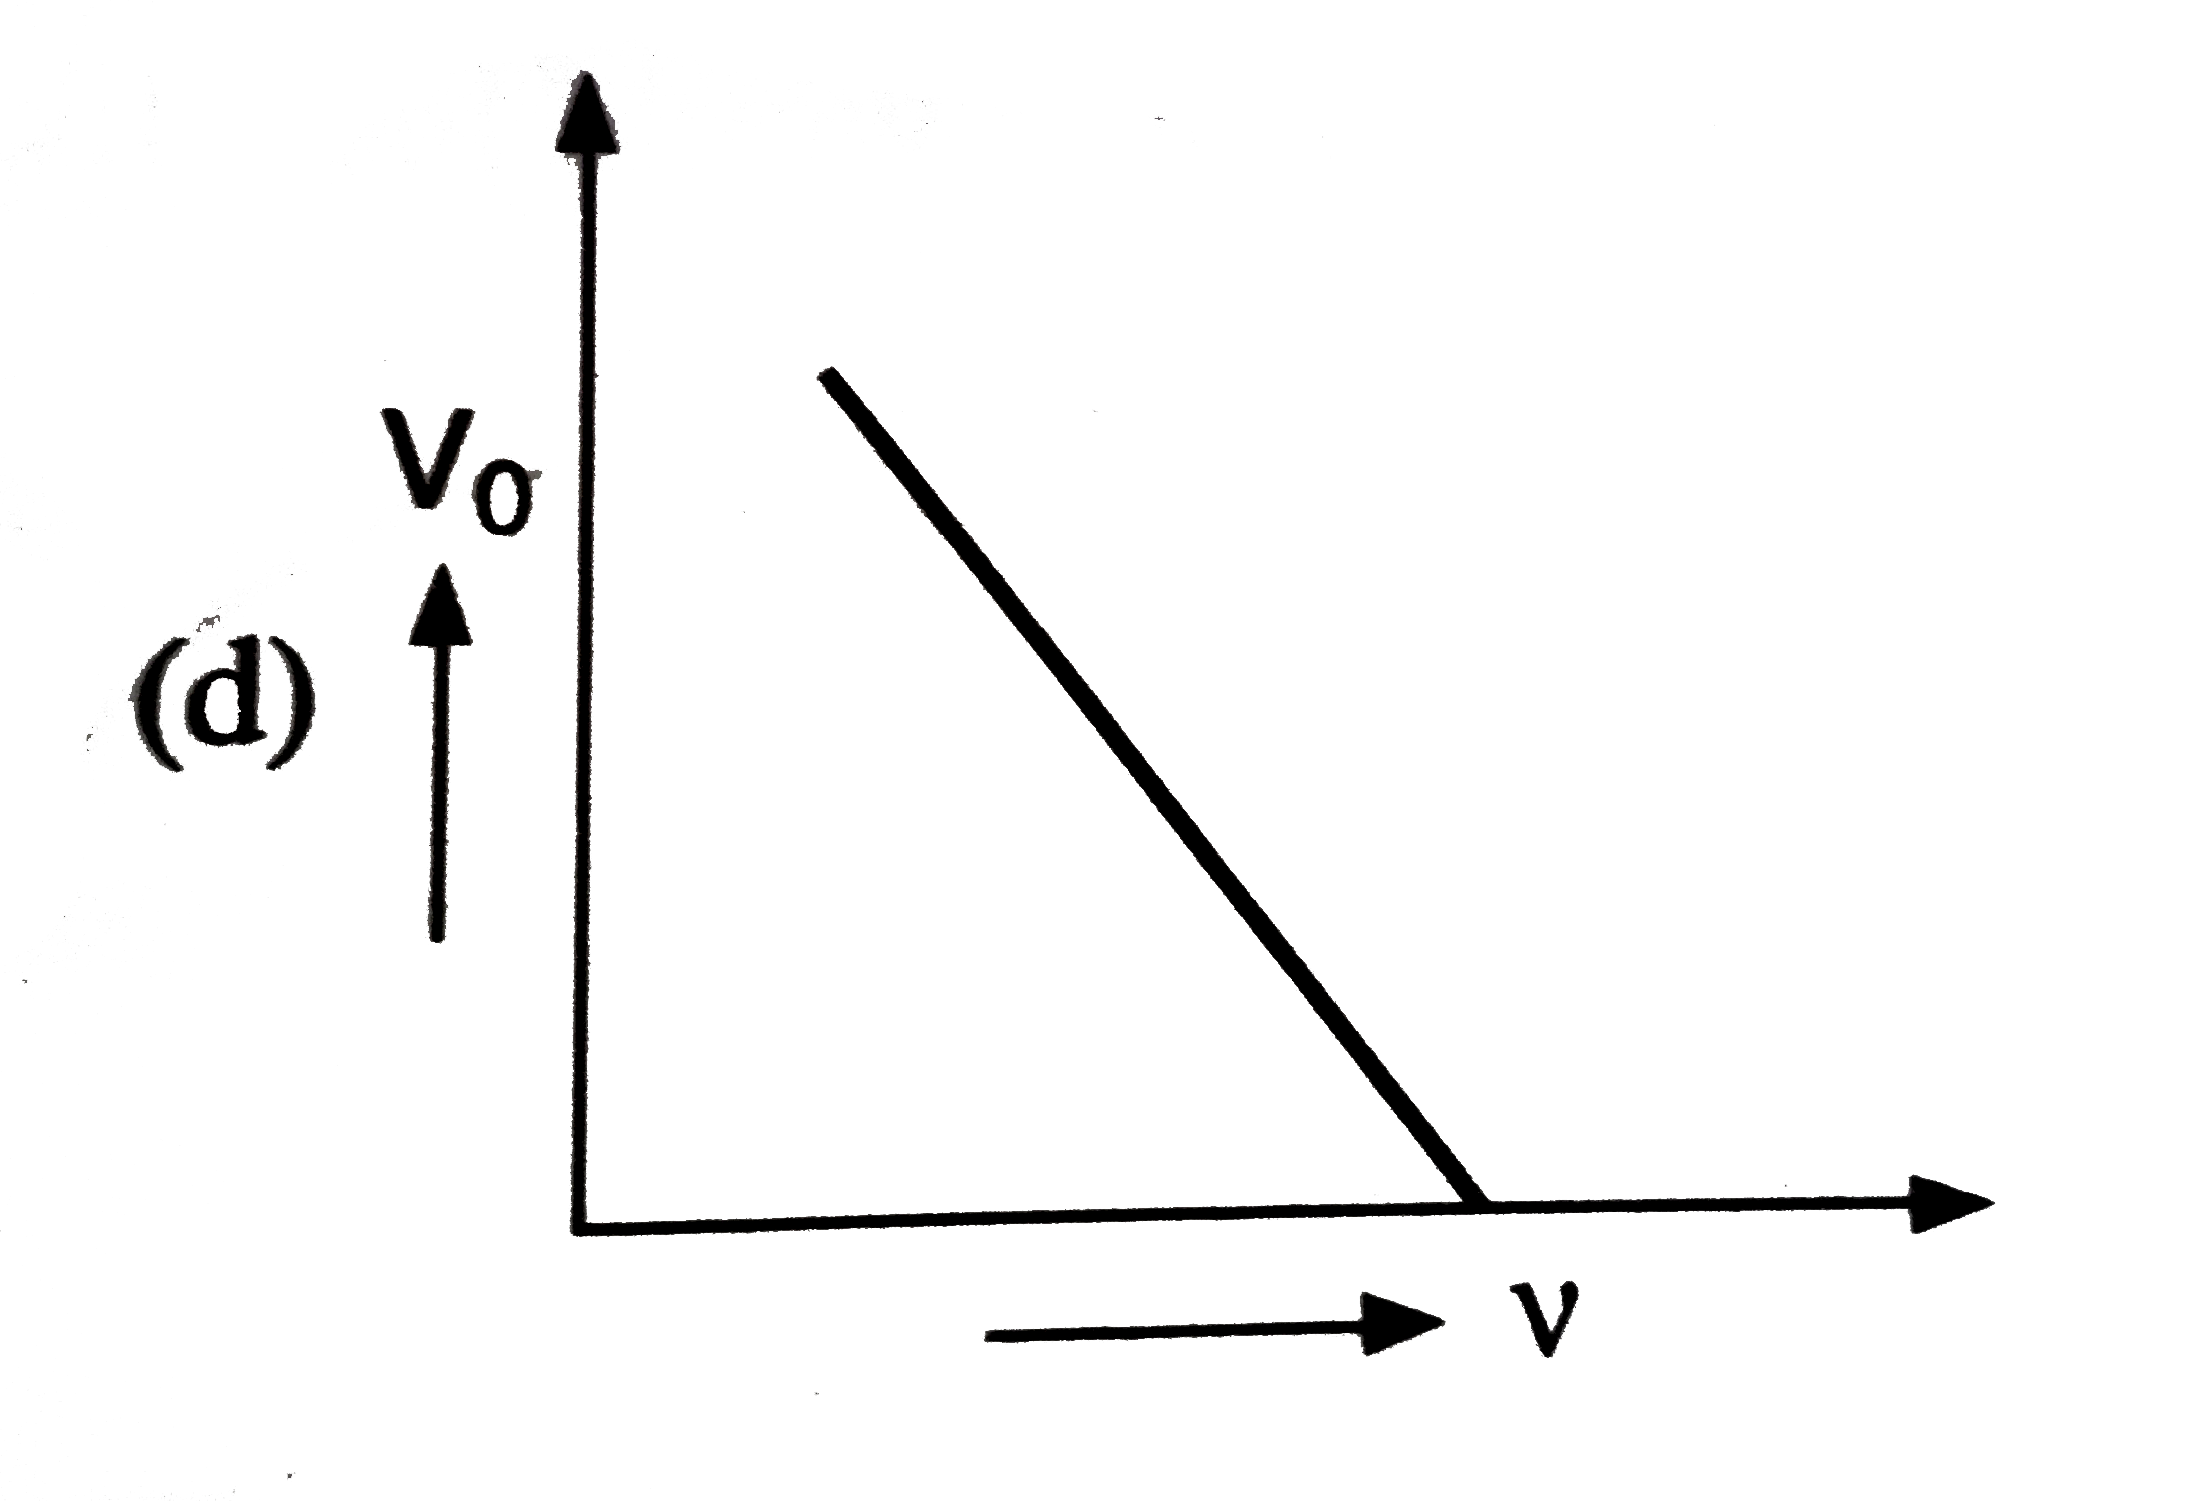
A graph is plotted taking .∘C along the Y-axis and .∘F along the X-axis. It is a/an
AparabolaBstraight lineCellipseDcircleA graph is plotted taking ∘––C along the Y - axis and of along the X - axis .It is a /an
AparabolaBstraight lineCellipseDcircle
A graph is drawn with a force along y-axis and time along x-axis. The area under the graph represent–
View SolutionIf a graph is plotted taking the temperature in Fahrenheit along the Y-axis and the corresponding temperature in Celsius along the X-axis, it will be a straight line
View SolutionIn a photoelectric experiment, the graph of frequency v of incident light (in Hz) and stopping potential V (in V) is as shown in the figure. Planck's constant is (e is the elementary charge)
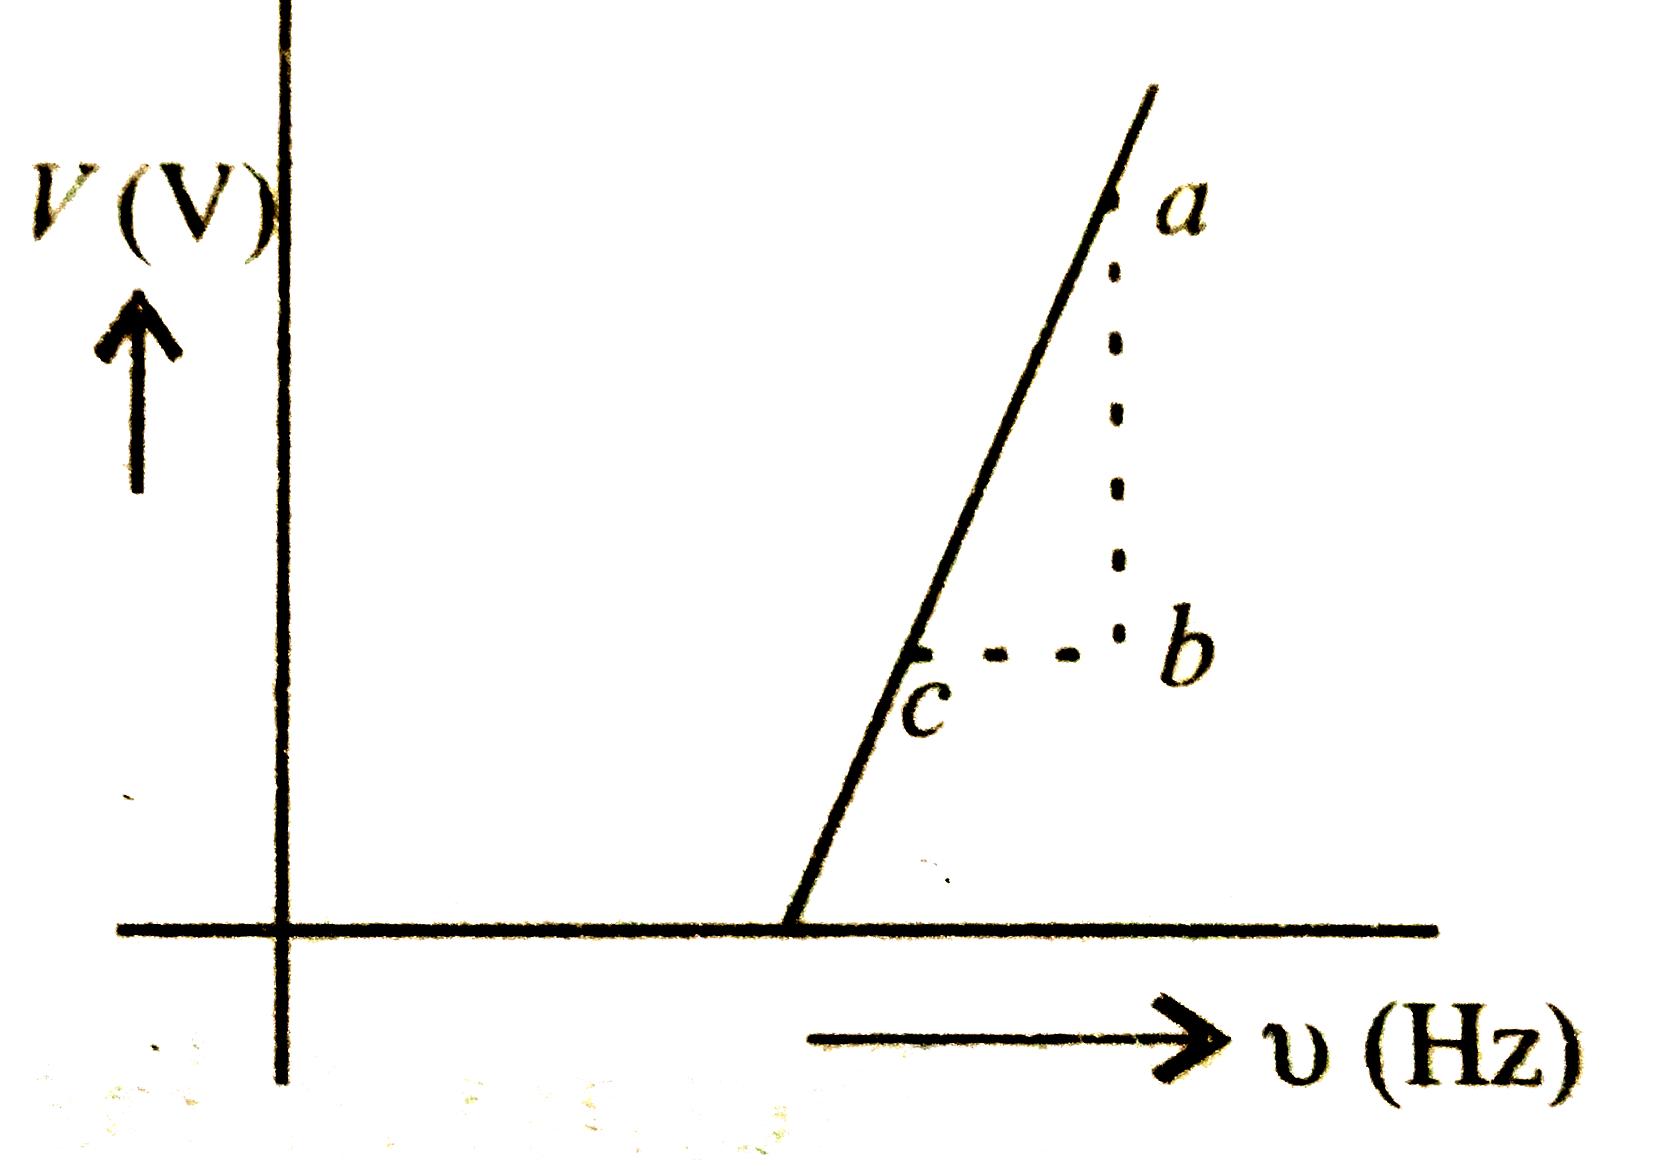
View SolutionIn a photoelectric experiment, the graph of frequency v of incident light (in Hz) and stopping potential V (in V) is as shown in the figure. Planck's constant is (e is the elementary charge)

View SolutionIn a photoelectric experiment, a student plotted the graph of stopping potential (Vs) against the frequency of incident radiation (v). But he could not write the unit of the slope of the graph. What is the corrent unit ?
View Solution
