Which of the following is the graph between the frequency (v) of the incident radiations and the stopping potential ?
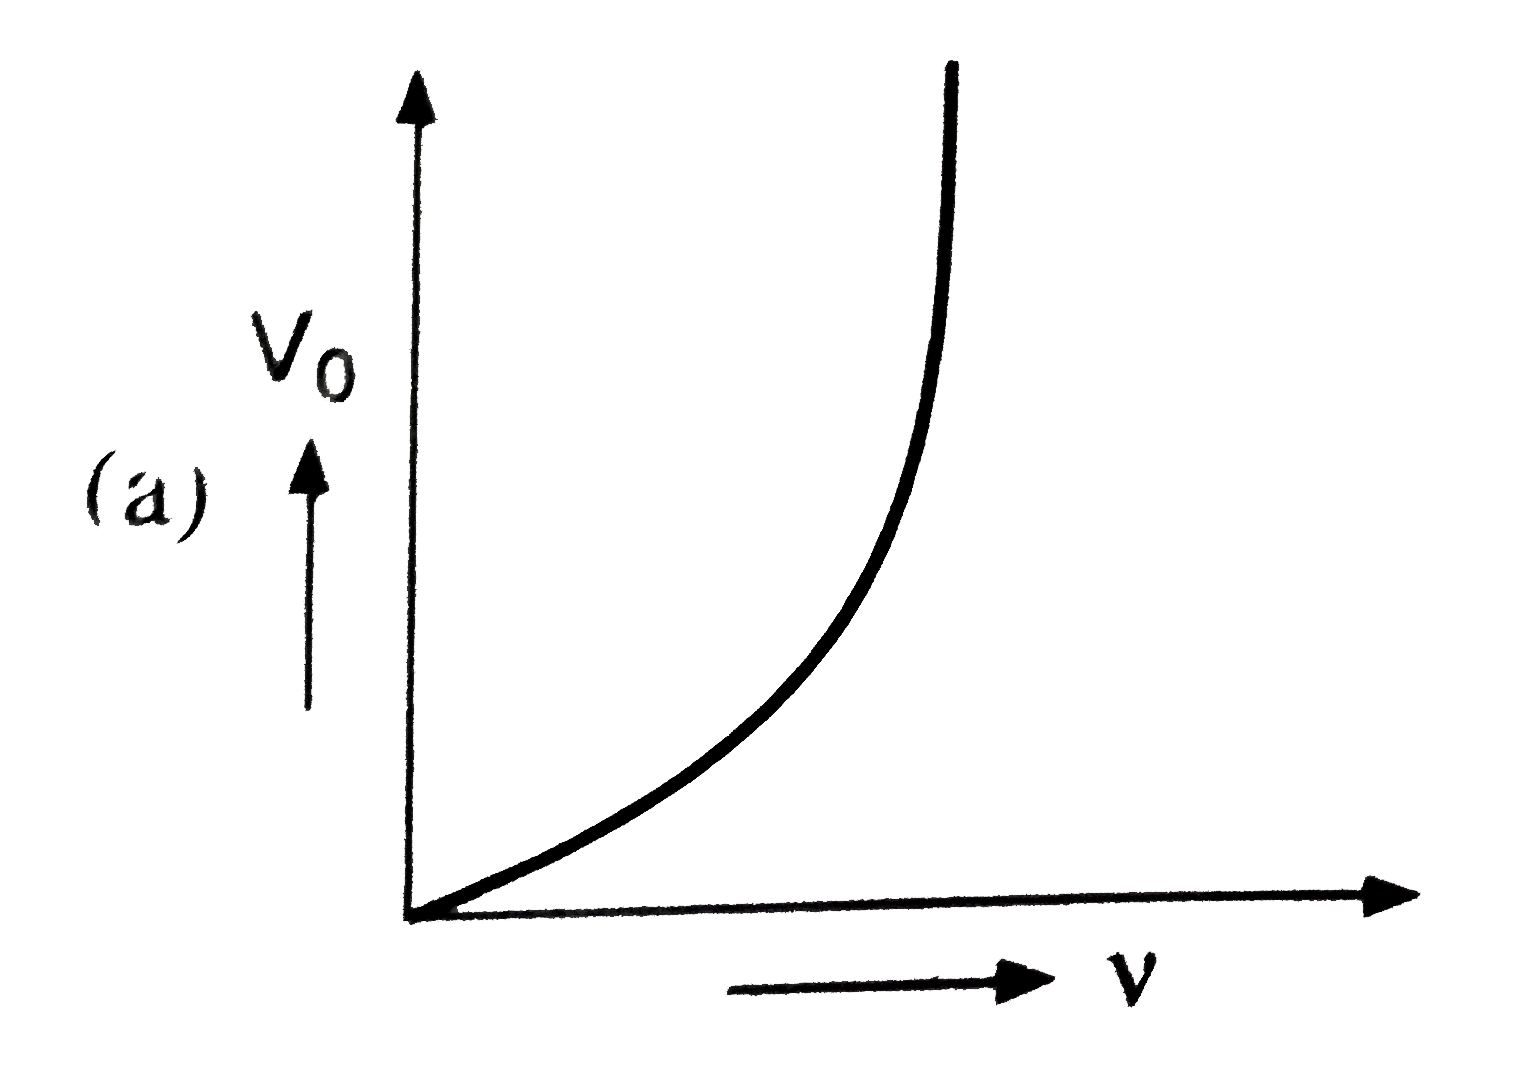
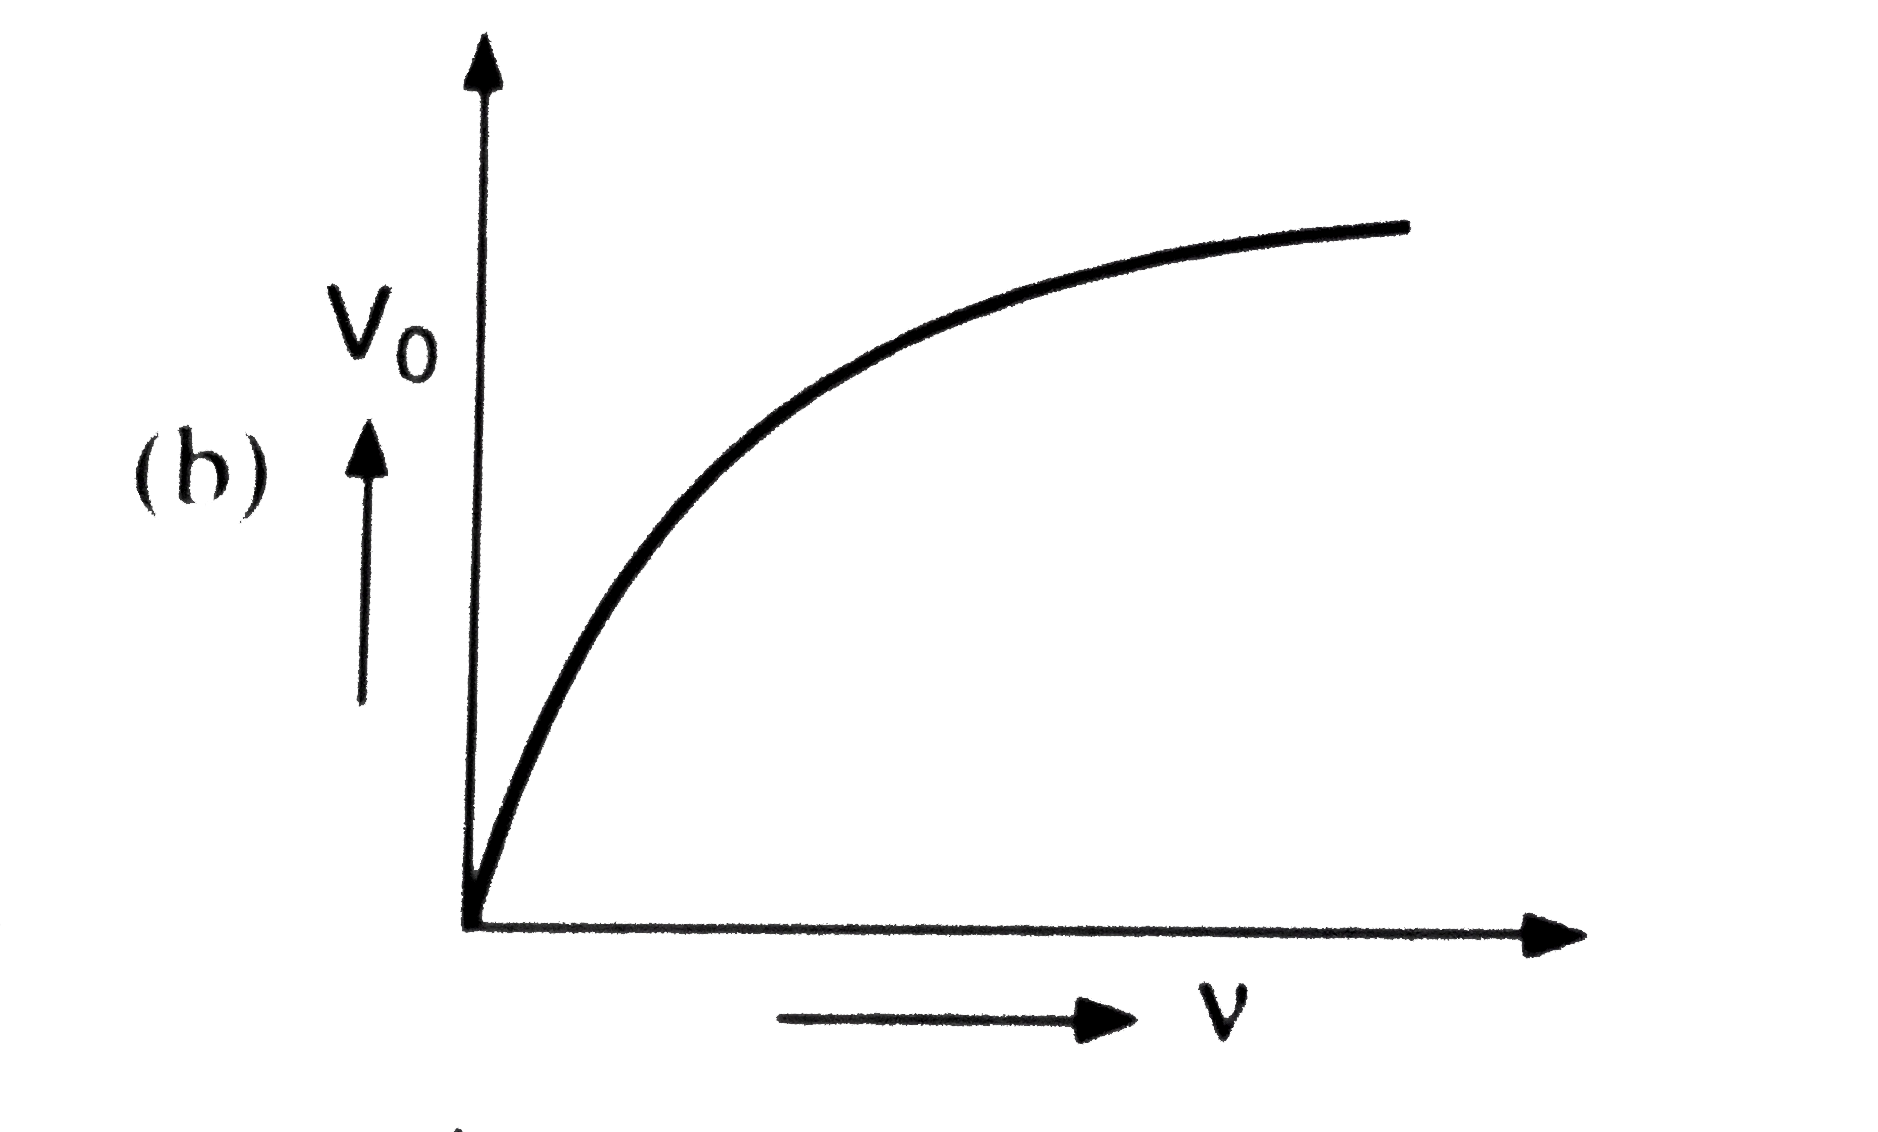
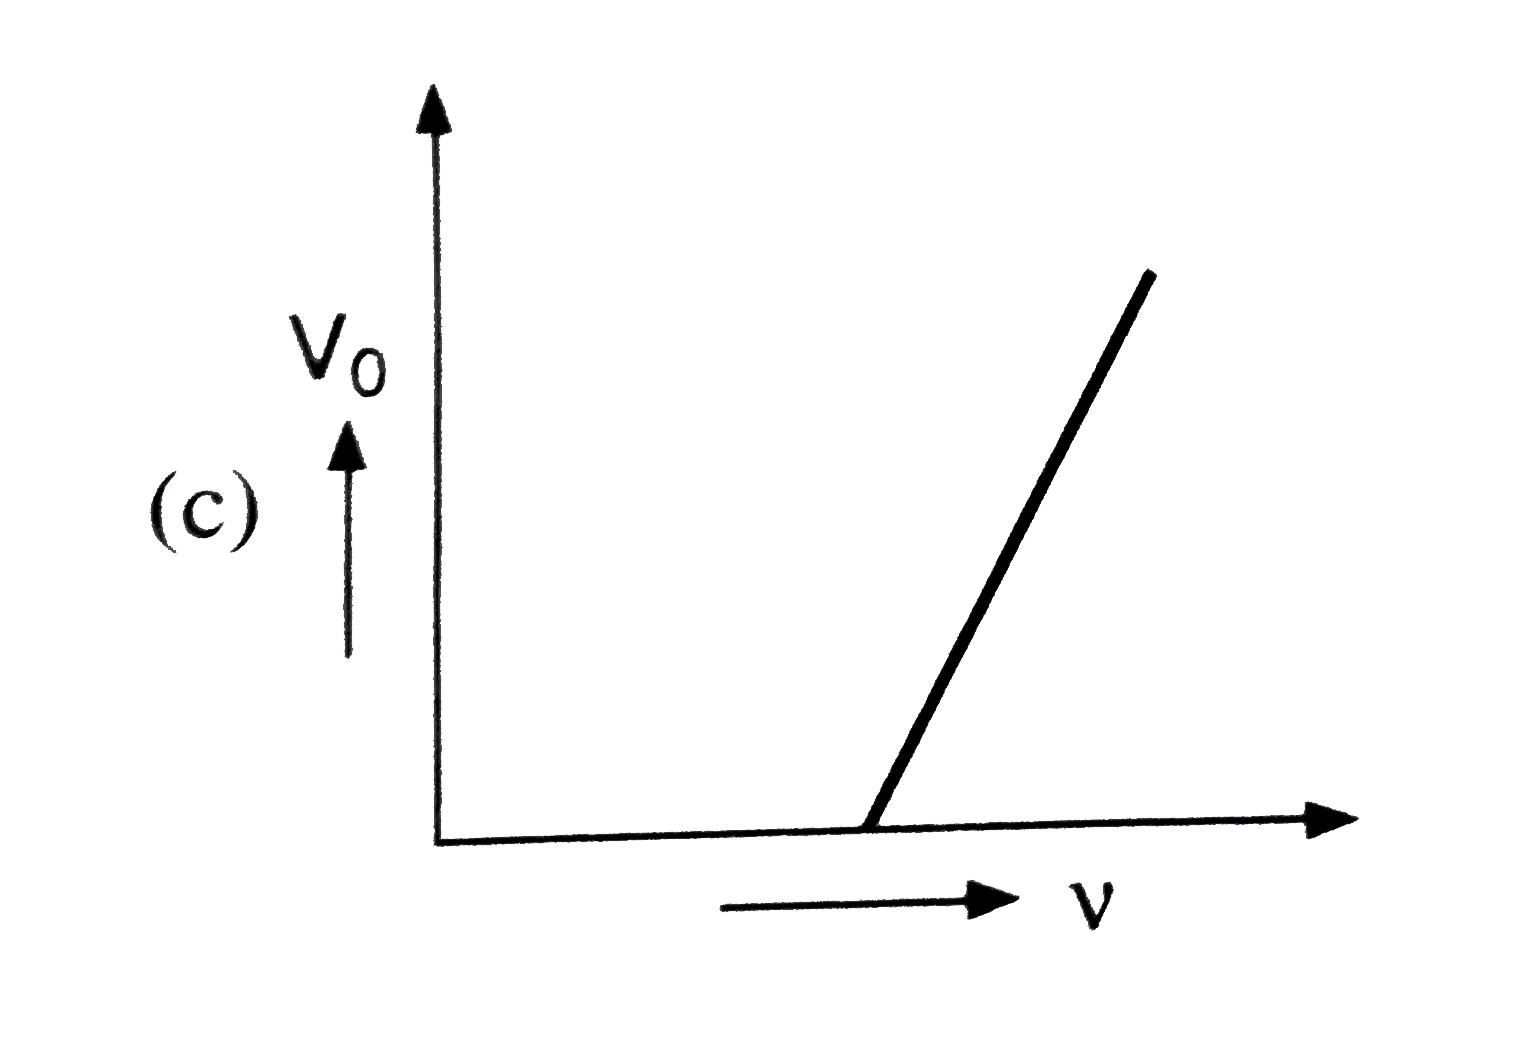
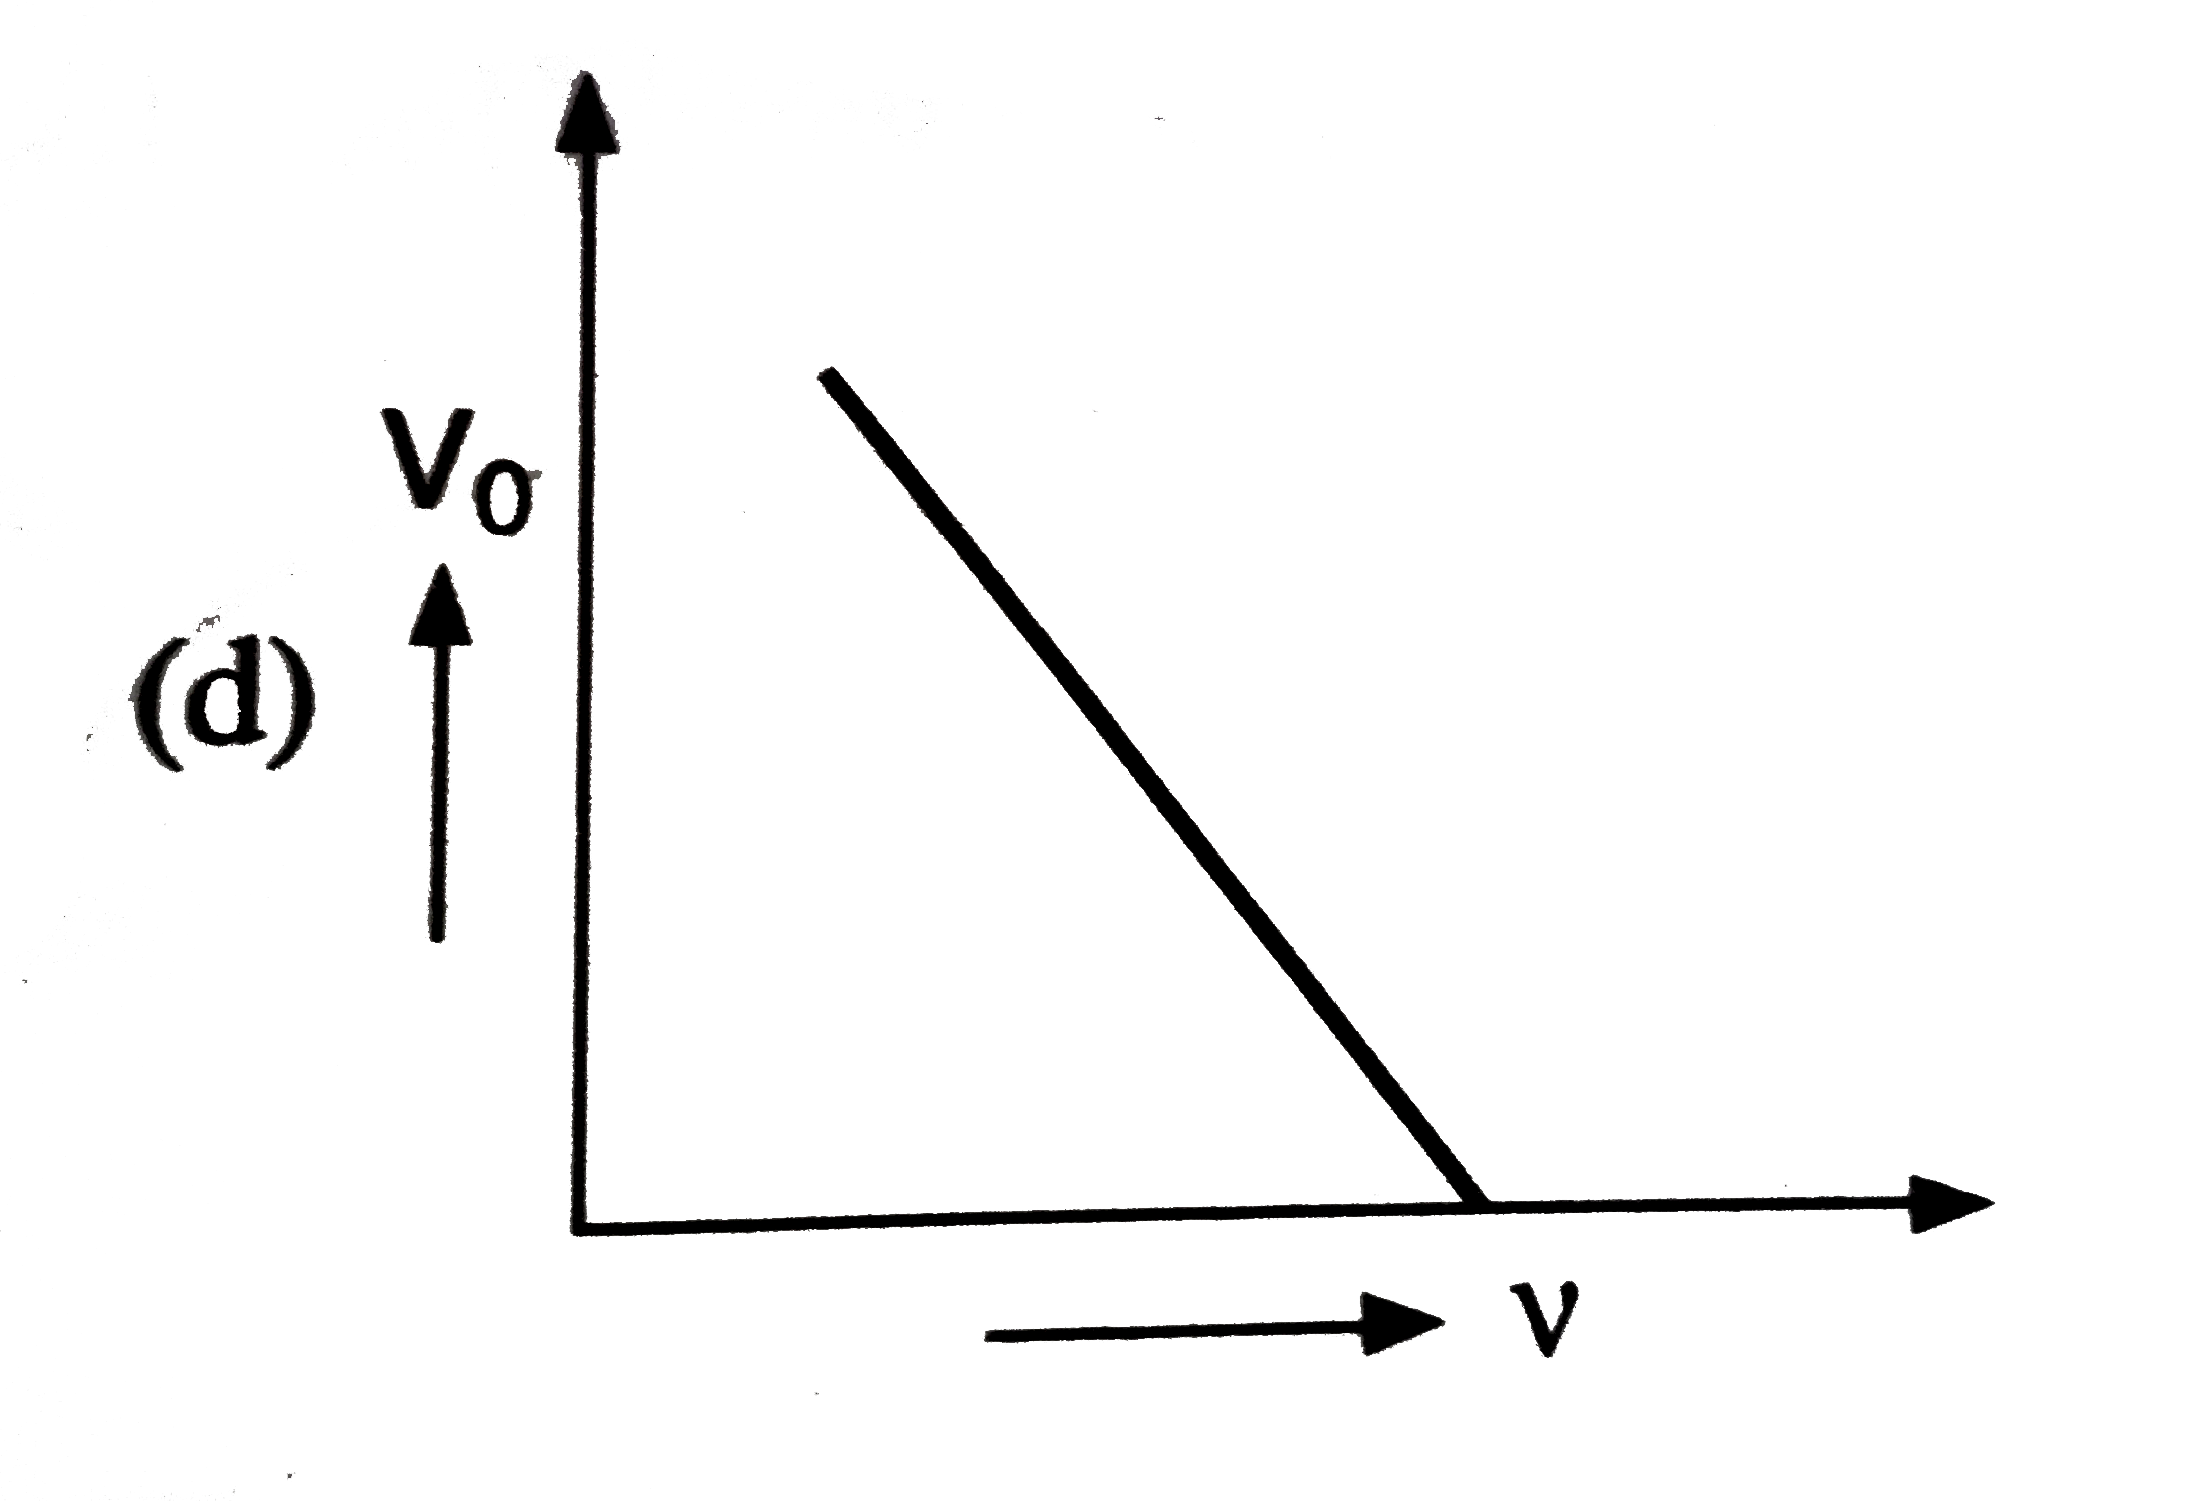
The correct Answer is:C
Topper's Solved these Questions
- MISCELLANEOUS (TOPICS OF GENERAL INTEREST)BOOK - OP TANDONCHAPTER - MISCELLANEOUS (TOPICS OF GENERAL INTEREST)EXERCISE - SET-V: Matching type Questions
37 Videos
- INTRODUCTION TO ORGANIC CHEMISTRY BOOK - OP TANDONCHAPTER - INTRODUCTION TO ORGANIC CHEMISTRY EXERCISE - SINGLE INTEGER ANSWER TYPE
4 Videos
- OXIDATION AND REDUCTION (REDOX REACTIONS)BOOK - OP TANDONCHAPTER - OXIDATION AND REDUCTION (REDOX REACTIONS)EXERCISE - SECTION V
3 Videos
Similar Questions
The stopping potential for acertain photosensitive metal is Vq when the frequency of incident radiation is V0 When the frequency of the incident radiations is doubled, what will be the stopping potential ?
View SolutionExplain giving reasons for the following:
(a) Photoelectric current in a photocell increases with the increase in the intensity of the incident radiation.
(b) The stopping potential (V0) varies linearly with the frequency (v) of the incident radiation for a given photosensitive surface with the slope remaining the same for different surfaces.
(c) Maximum kinetic energy of the photoelectrons is independent of the intensity of incident radiation.
View Solution
Knowledge Check
Choose the correct option for the graph between the frequency of incident light and the stopping potential.
AIt is a parabolaBIt is a straight lineCIt is a hyperbolaDIt is a circleThe kinetic energy (Ek) of a photoelectron varies with the frequency (v) of the incident radiation as which of the following graph ?
A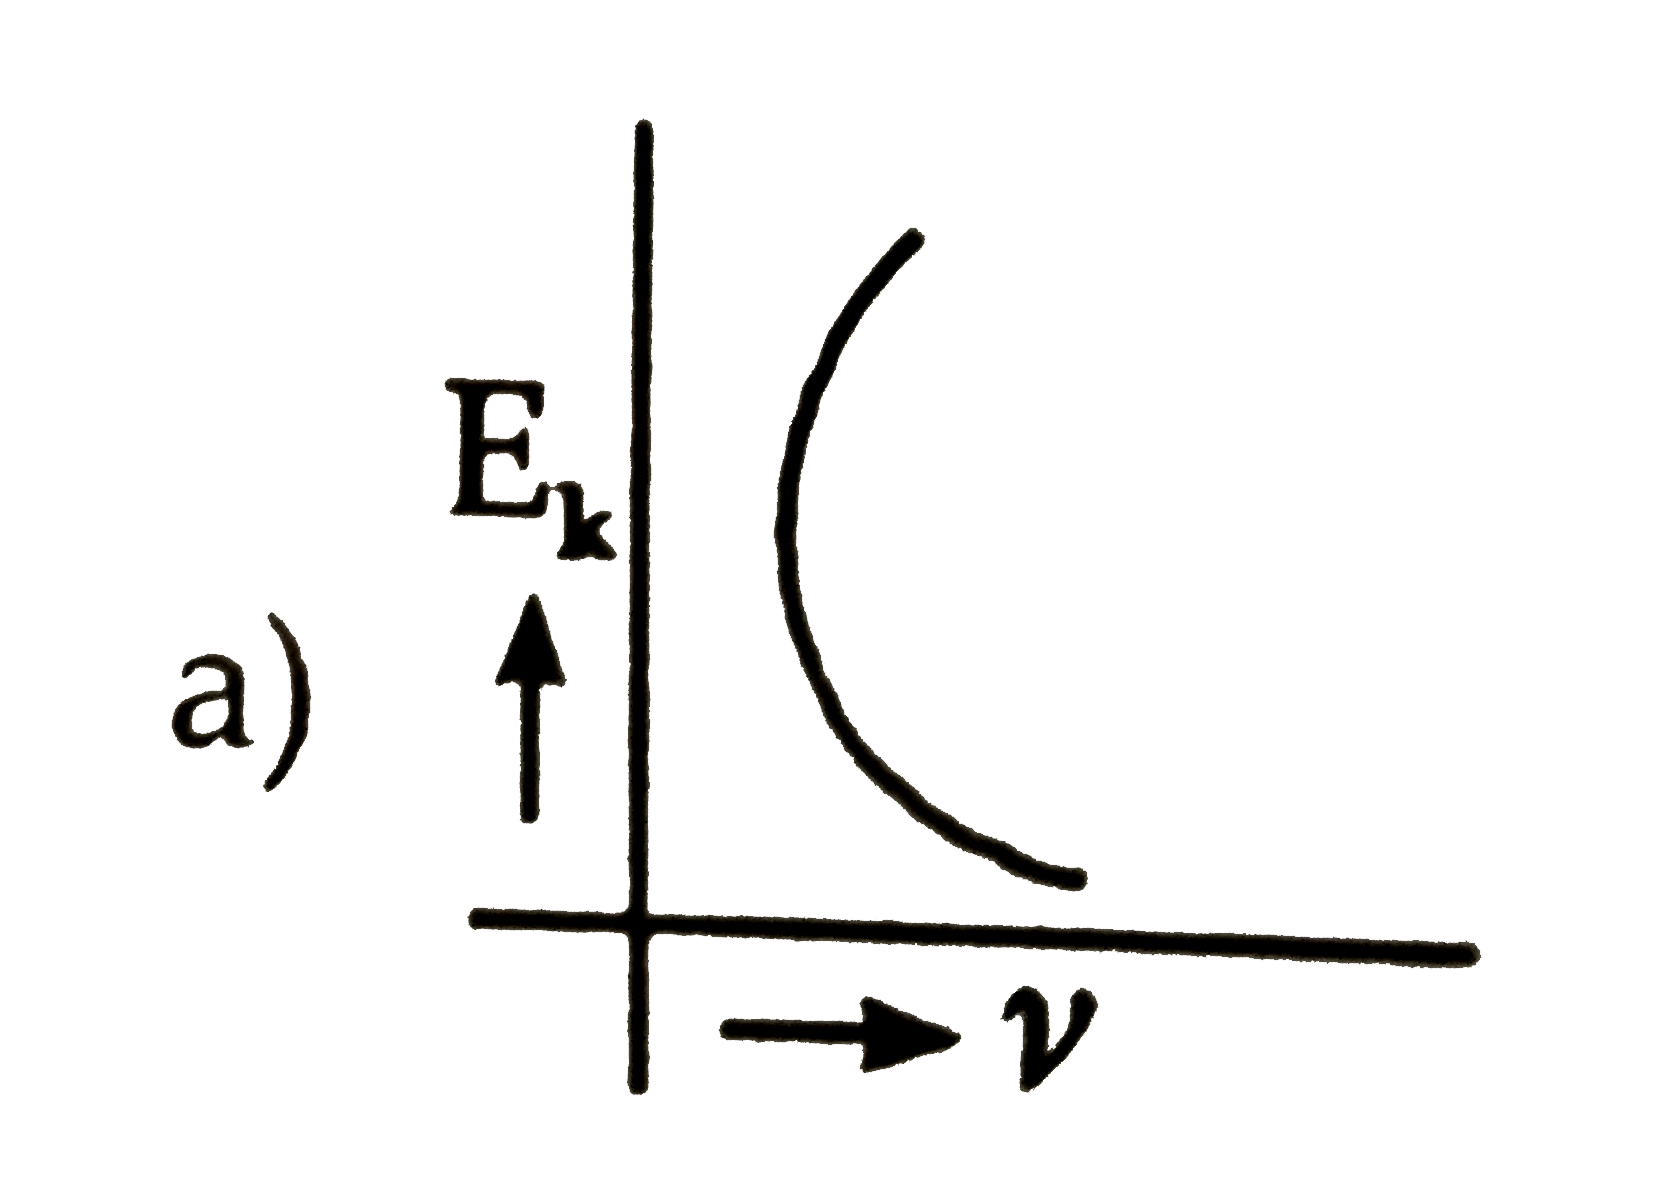 B
B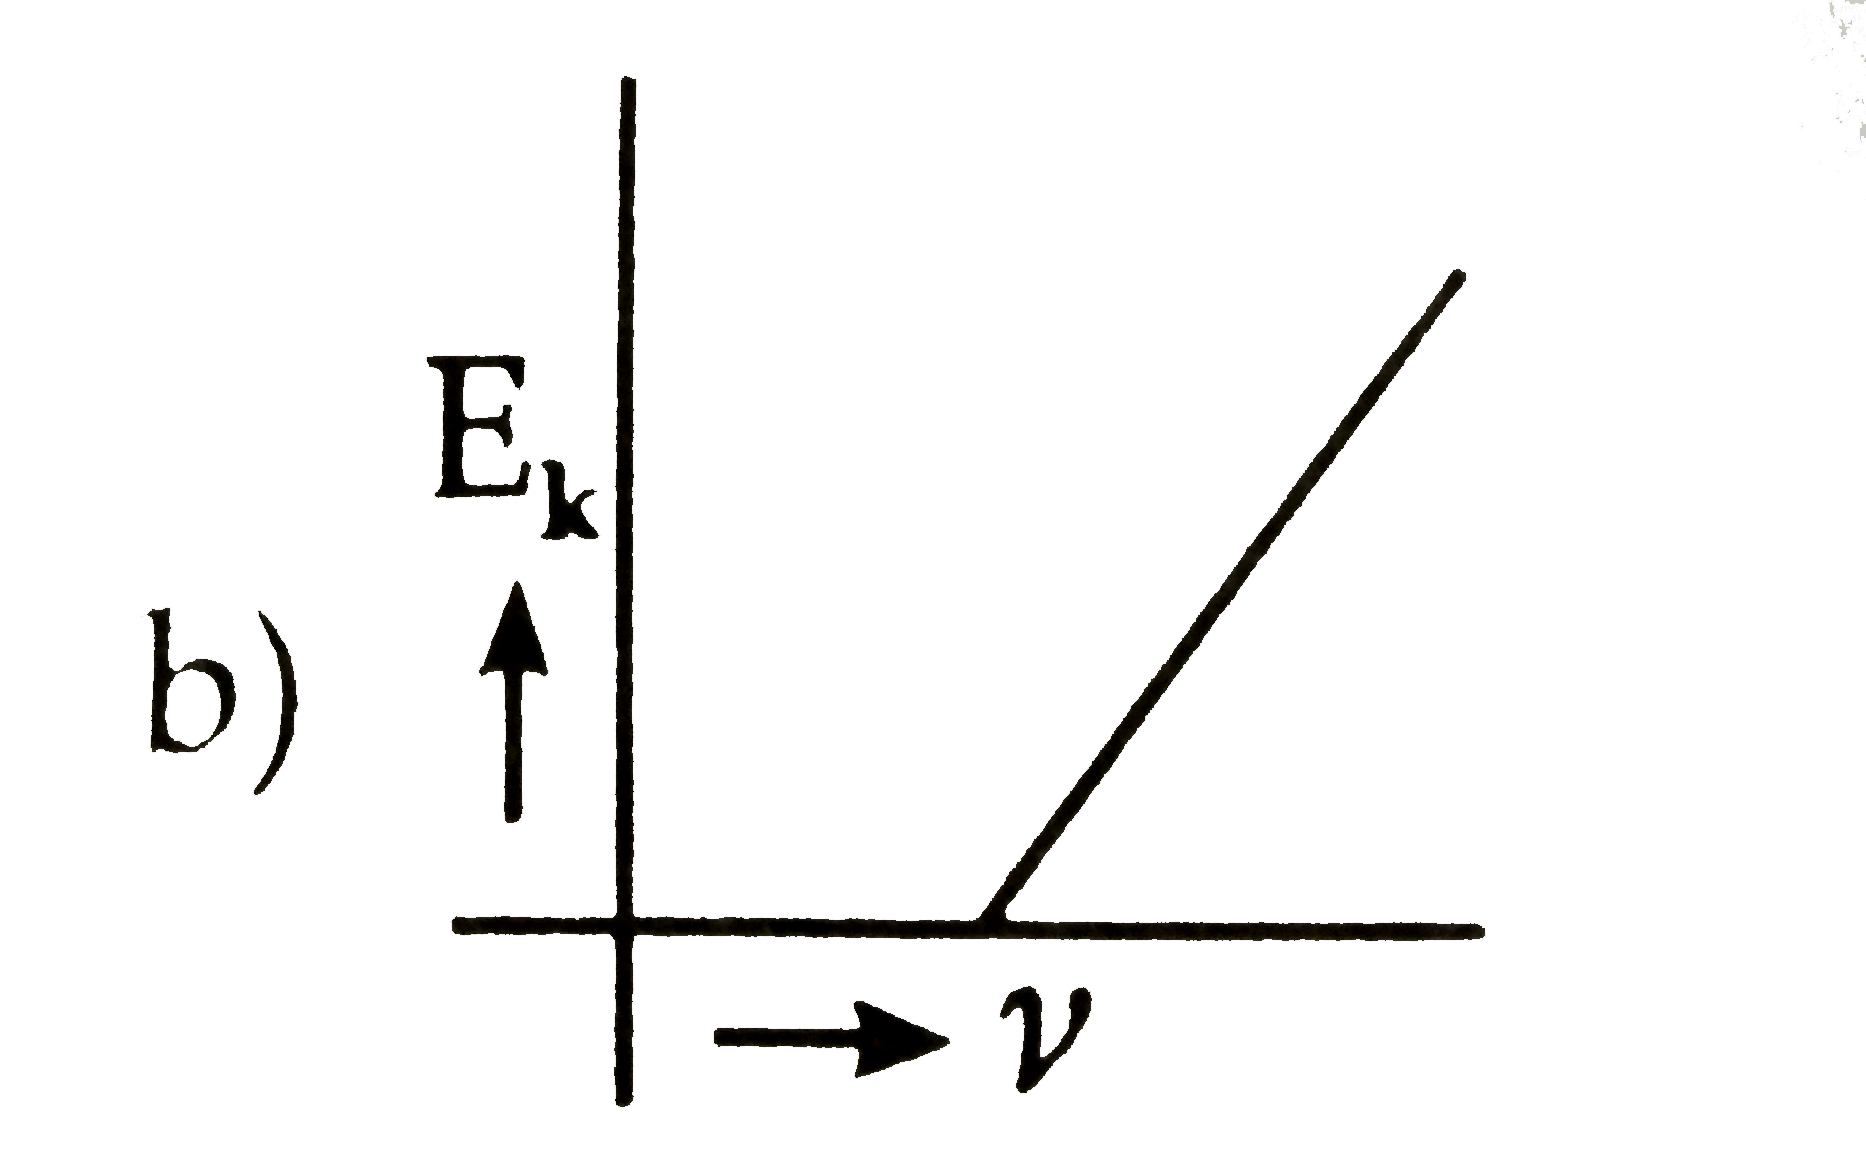 C
C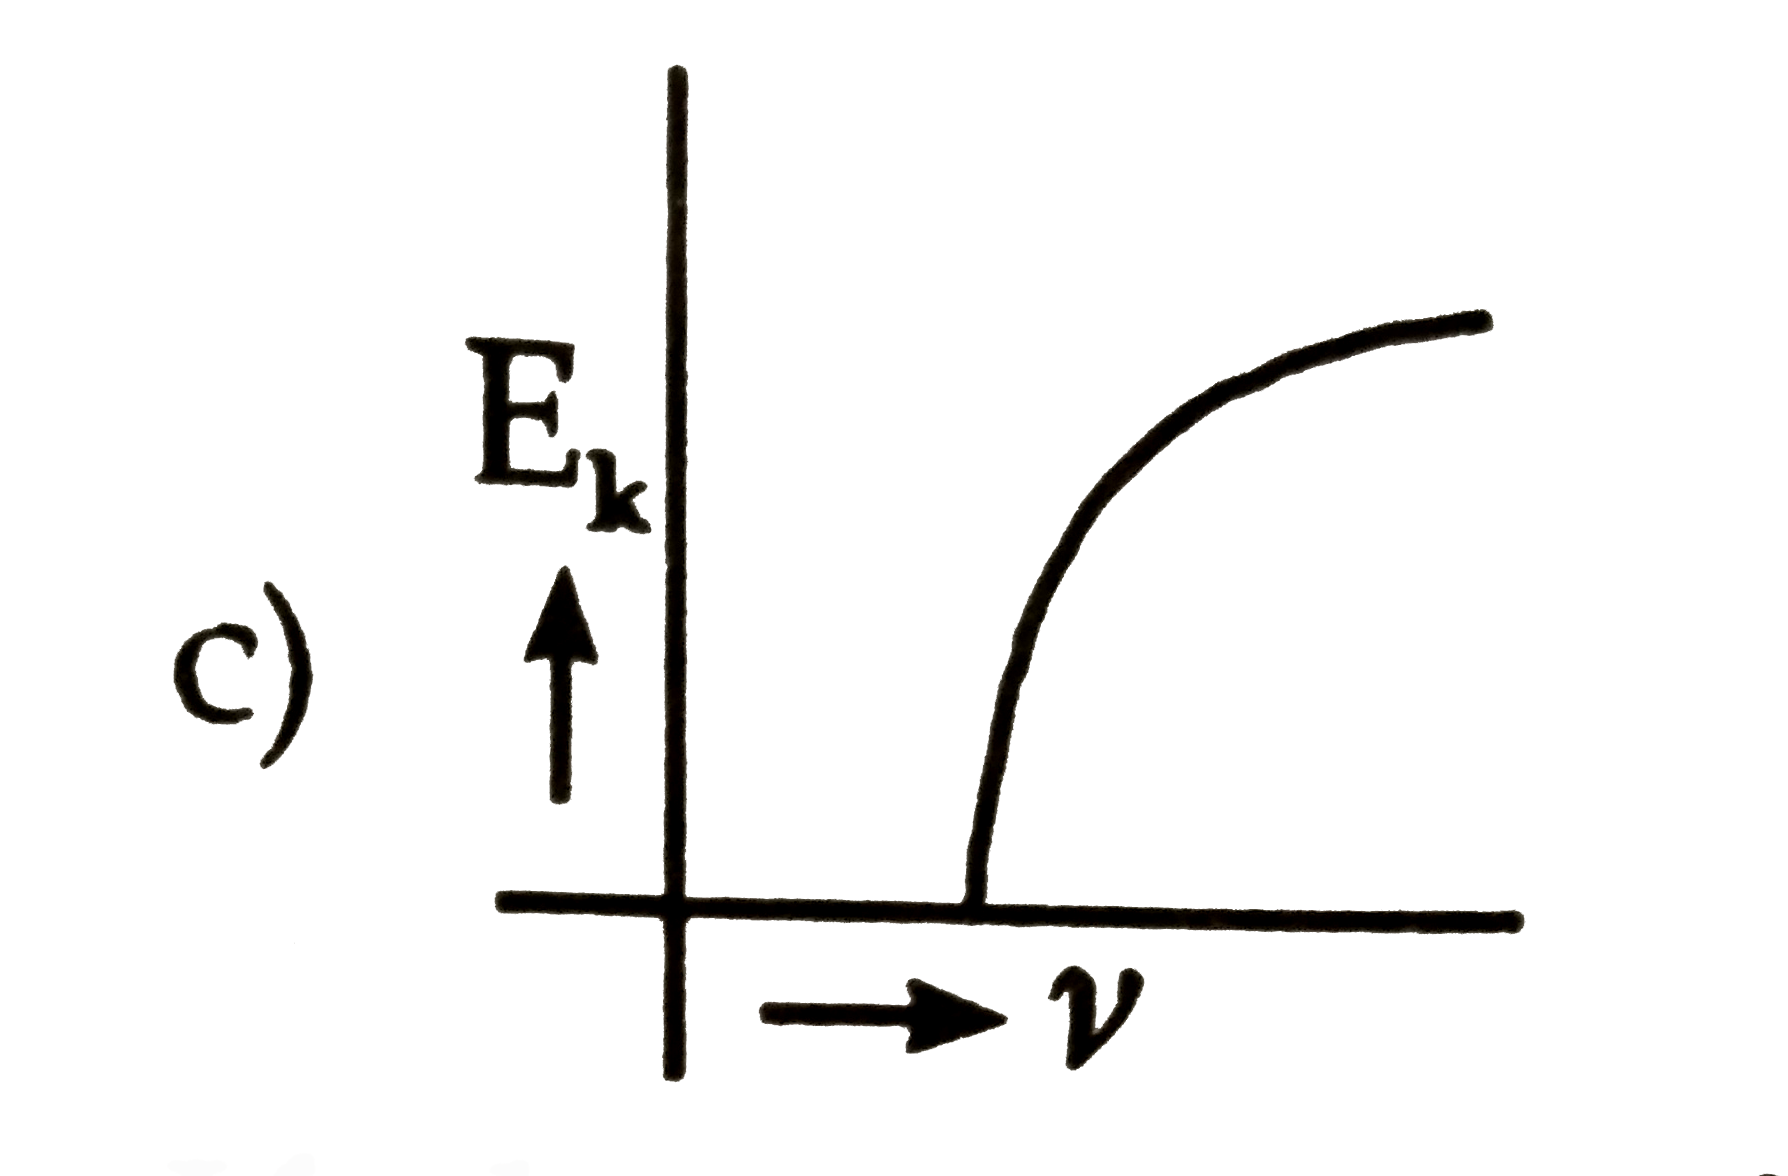 D
D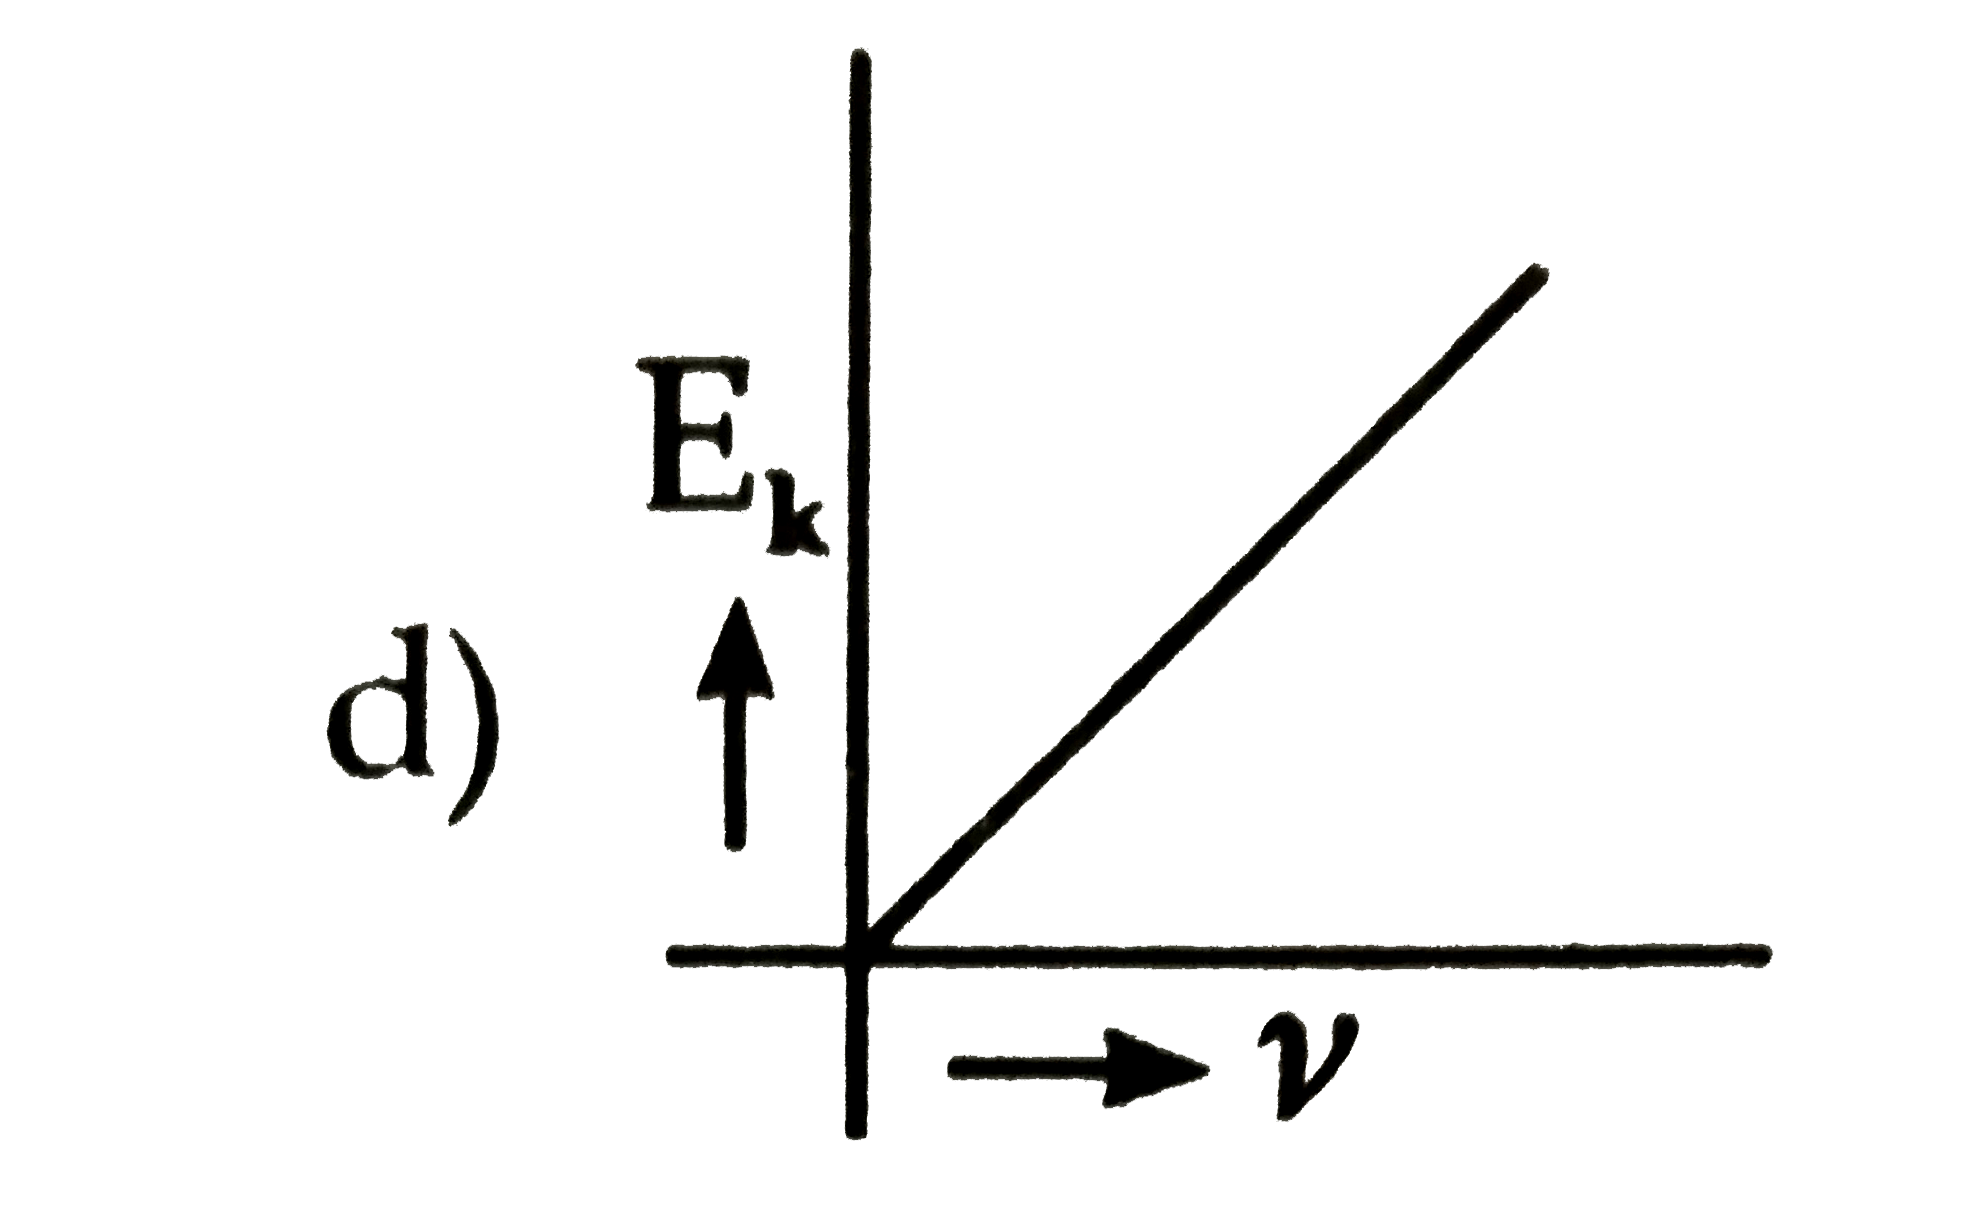
When light off frequency v1 is incident on a photosensitive surface , the stopping potential is V1 . If the frequency of incident radiation becomes v1/2 the stopping potential changes to V2 Find out the expression for the threshold frequency for the surface in terms of V1andV2
If the frequency of incident radiation is doubled , will the maximum kinetic energy of the photoelectrons also be doubled ? Given reason .
View SolutionExplain giving reasons for the following :
(a) Photoelectric current in a photocell increases with the increases in intensity of the incident radiation.
(b) The stopping potential (V0) varries linearly with the frequency (v) of the incident radiation for a given photosenstive surface with the stop remaining the same for different surfaces.
(c) Maximum kinetic energy of the photoelectrons is independent of the intensity of incident radiation.
View SolutionPlot a graph showing variation of stopping potential (V0) with the frequency (v) of the incident radiation for a given photosensitive material. Hence, state the significance of the threshold frequency in photoelectric emission.
Using the principle of energy conservation, write the equation relating the energy of incident photon, threshold frequency and the maximum kinetic energy of the emitted photoelectrons.
View SolutionDraw a graph showing the variation of stopping potential with frequency of the incident radiation. What does the slope of the line with frequency axis indicate? What information can be obtained from the values of intercept on the potential axis?
View SolutionThe slope of the graph drawn between stopping potential and frequency of incident radiation will be
View SolutionWhat is the effect of decrease in frequency of incident radiation on the stopping potential in photoelectric emission?
View Solution
