Thomas Andrew measured variation of the volume with pressure of ____________ at different constant temperatures.
CO2
He
H2
NH3
The correct Answer is:A
Topper's Solved these Questions
- STATES OF MATTER (GASES AND LIQUIDS) BOOK - TARGET PUBLICATIONCHAPTER - STATES OF MATTER (GASES AND LIQUIDS) EXERCISE - CRITICAL THINKING
68 Videos
- STATES OF MATTER (GASES AND LIQUIDS) BOOK - TARGET PUBLICATIONCHAPTER - STATES OF MATTER (GASES AND LIQUIDS) EXERCISE - COMPETITIVE THINKING
50 Videos
- SOME BASIC CONCEPTS OF CHEMISTRYBOOK - TARGET PUBLICATIONCHAPTER - SOME BASIC CONCEPTS OF CHEMISTRYEXERCISE - EVALUATION TEST
20 Videos
- SURFACE CHEMISTRYBOOK - TARGET PUBLICATIONCHAPTER - SURFACE CHEMISTRYEXERCISE - Evaluation Test
10 Videos
Similar Questions
Name the gas law which relates volume and pressure of gas at constant temperature.
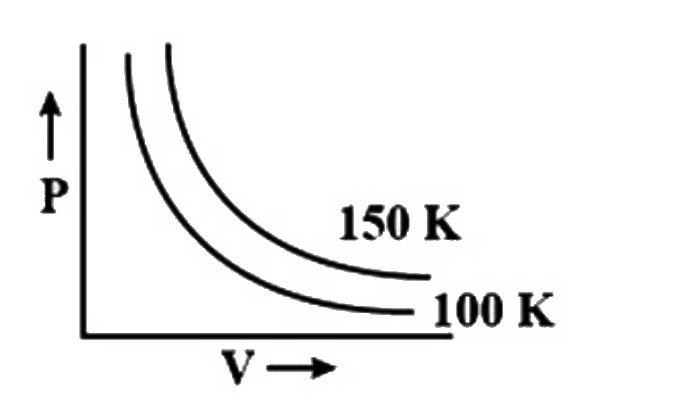
View SolutionA graph is plotted between pressure and volume at different temperature. On the basis of the graph what changes will you observe in the volume if
(i) the pressure is increased at constant temperature
(ii) the temperature is decreased at constant pressure

View Solution
Knowledge Check
The curve showing the variation of adorpton with pressure at constant temperature is called :
Aan isosthermBadsorpton isothermCabsorption isothermDall of theseBy increasing temperature and keeping the volume constant, the pressure of a gas will
Aremain constantBincreaseCdecreaseDincrease or decrease depends on the nature of gasBy increasing temperature and keeping the volume constant, the pressure of a gas will
Aremain constantBIncreaseCdecreaseDIncrease or decrease depends on the nature of gas
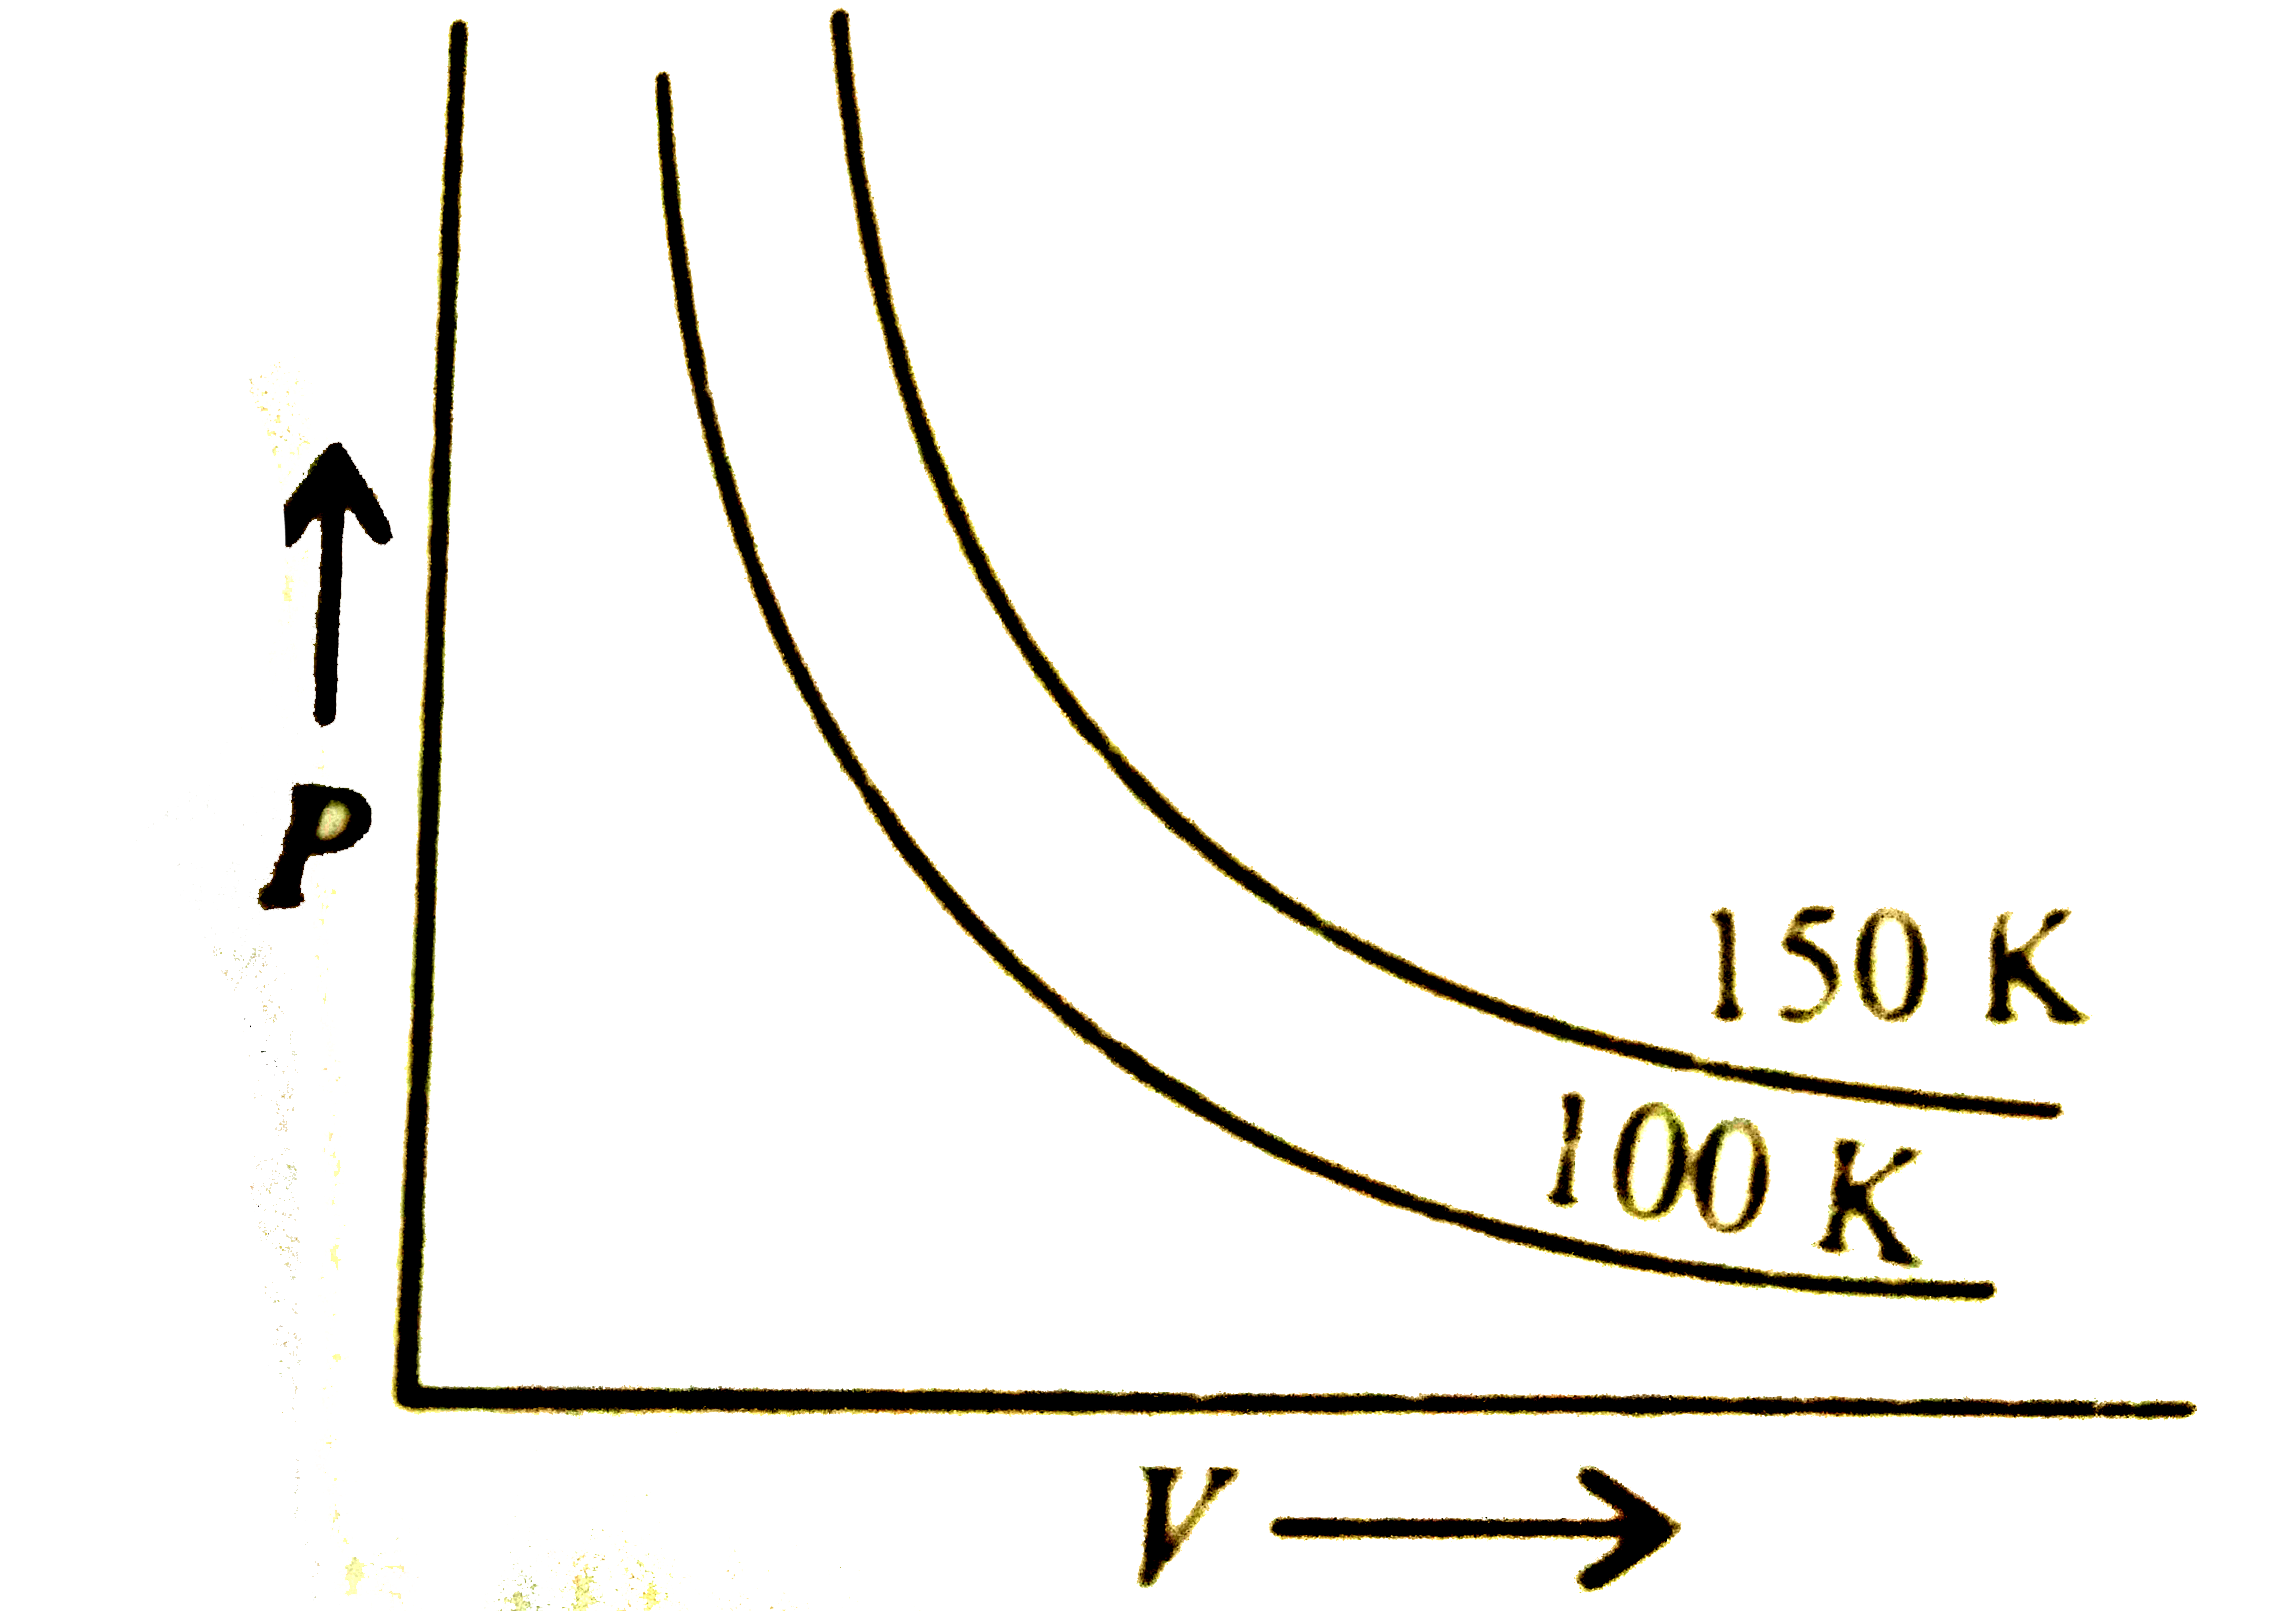
A graph is plotted between pressure and volume at different temperatures . On the basis of the graph what changes will you observe in the volume if
(i) the pressure is increased at constant temperature .
(ii) the temperature is decreased at constant pressure .

View SolutionPressure vs volume graph at constant temperature is known as…………….
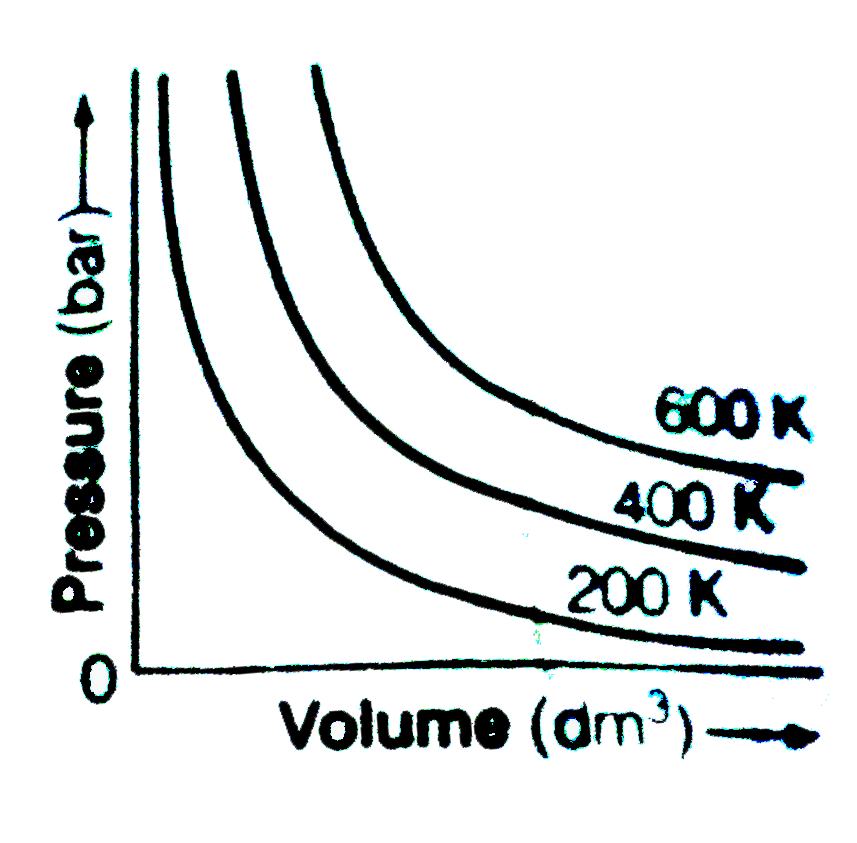
View SolutionThe variation of pressure with volume of the gas at different temperatures can be graphically represented as shown in figure. On the basis of this graph answer the following question.
(i) How will the volume of a gas change if its pressure is increased at constant temperature ?
(ii) At a constant pressure, how will the volume of a gas change if the temperature is increased from 200 K to 400 K ?

View SolutionAssertion : The pressure of a gas is inversely proportional to its volume at constant temperature and n.
Reason : The gas volume is directly proportional to n at constant temperature and pressure .
View Solution
