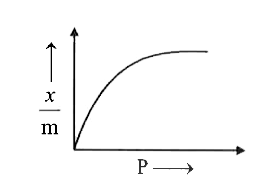
Which of the following graph CORRECTLY shows the variation of xm with P according to Freundlich equation?
A
B
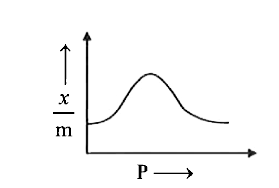
C

D
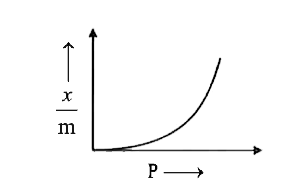
Text Solution
The correct Answer is:A
|
Topper's Solved these Questions
- SURFACE CHEMISTRYBOOK - TARGET PUBLICATIONCHAPTER - SURFACE CHEMISTRYEXERCISE - Competitive Thinking
28 Videos
- SURFACE CHEMISTRYBOOK - TARGET PUBLICATIONCHAPTER - SURFACE CHEMISTRYEXERCISE - Evaluation Test
10 Videos
- SURFACE CHEMISTRYBOOK - TARGET PUBLICATIONCHAPTER - SURFACE CHEMISTRYEXERCISE - Evaluation Test
10 Videos
- STATES OF MATTER (GASES AND LIQUIDS) BOOK - TARGET PUBLICATIONCHAPTER - STATES OF MATTER (GASES AND LIQUIDS) EXERCISE - EVALUATION TEST
20 Videos
Similar Questions
Knowledge Check
Which of the following graphs correctly represents the variation of β=−(dVdP)/V with P for an ideal gas at constant temperature
A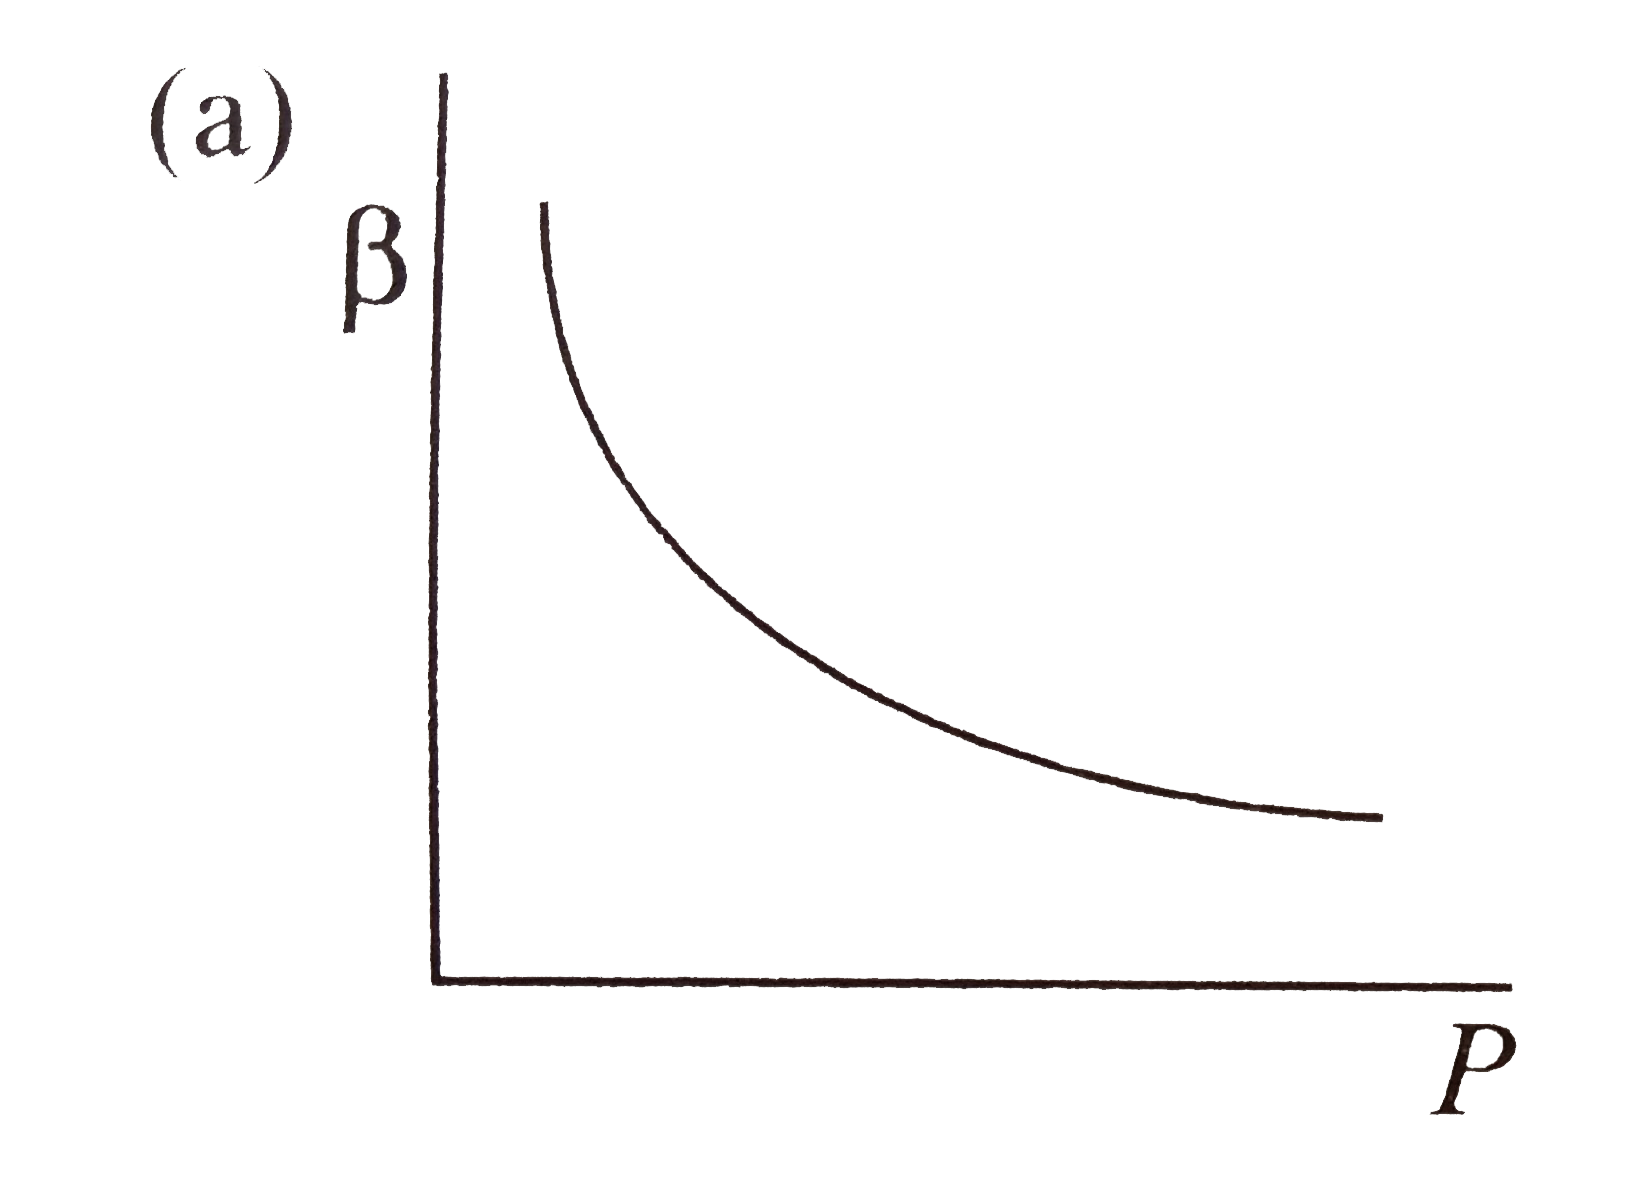 B
B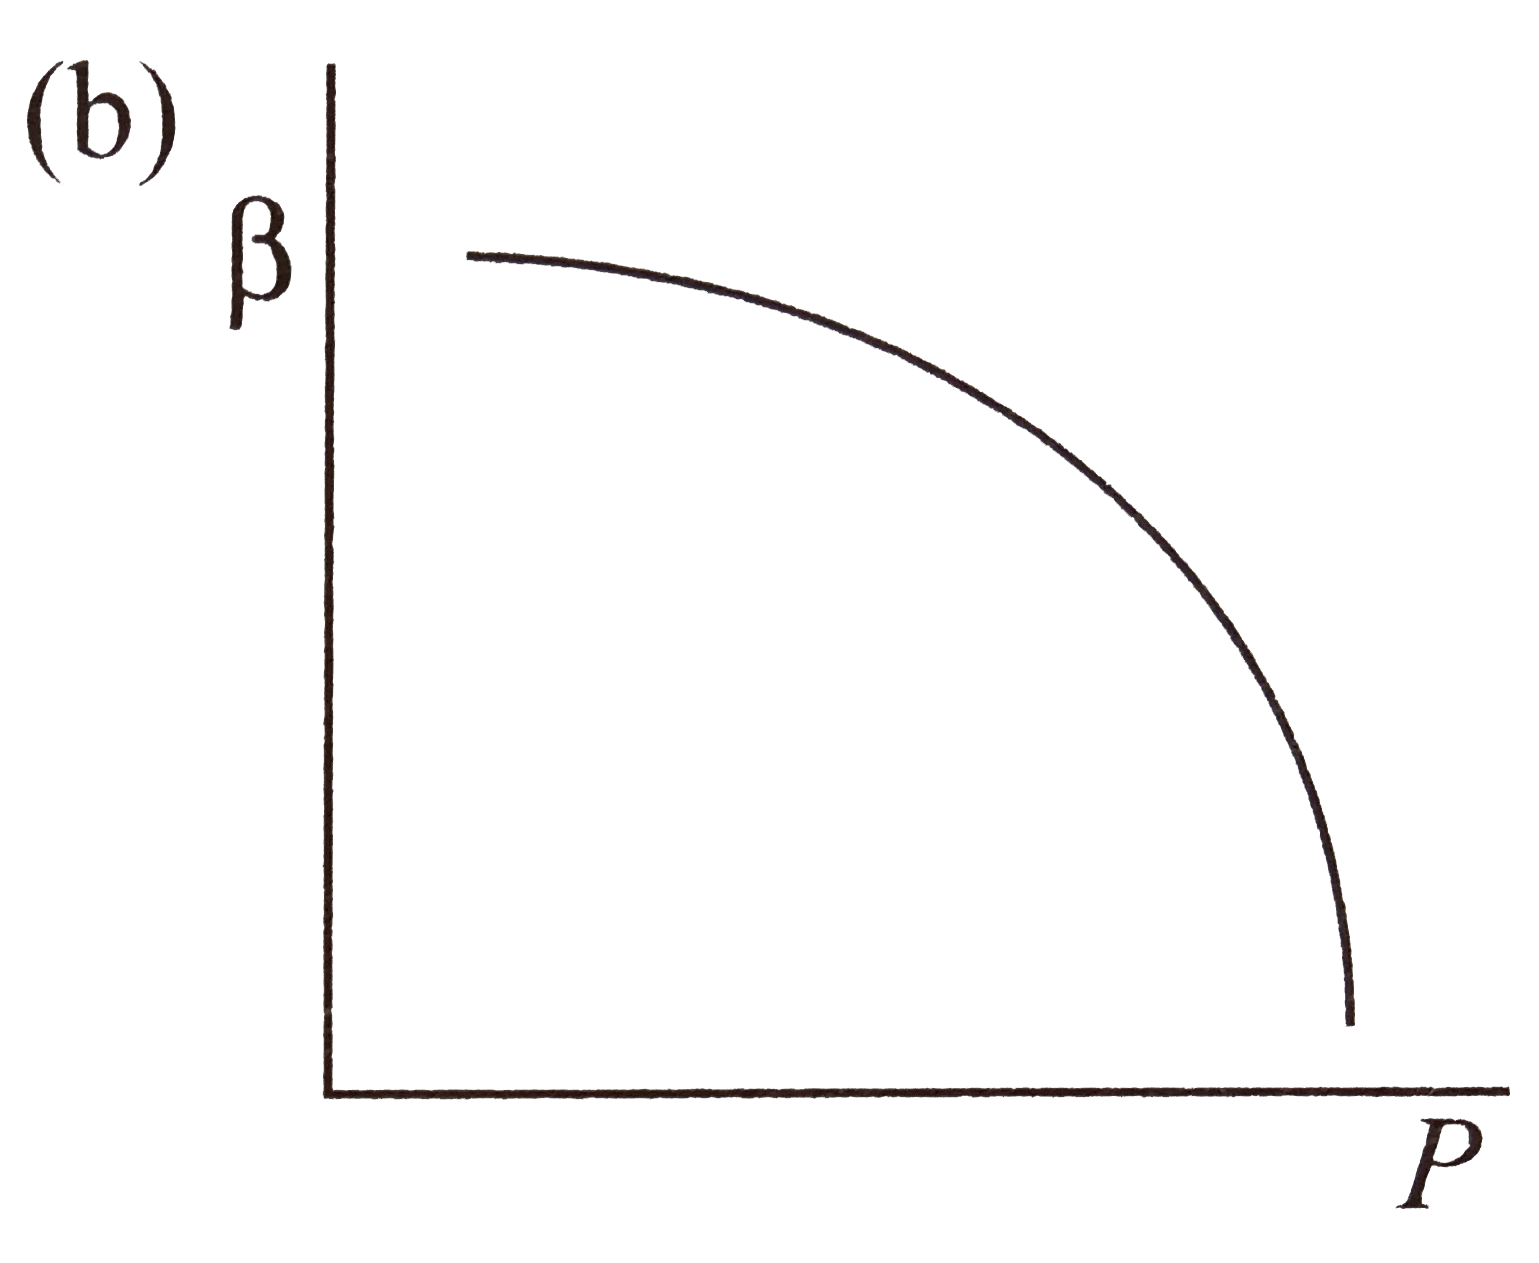 C
C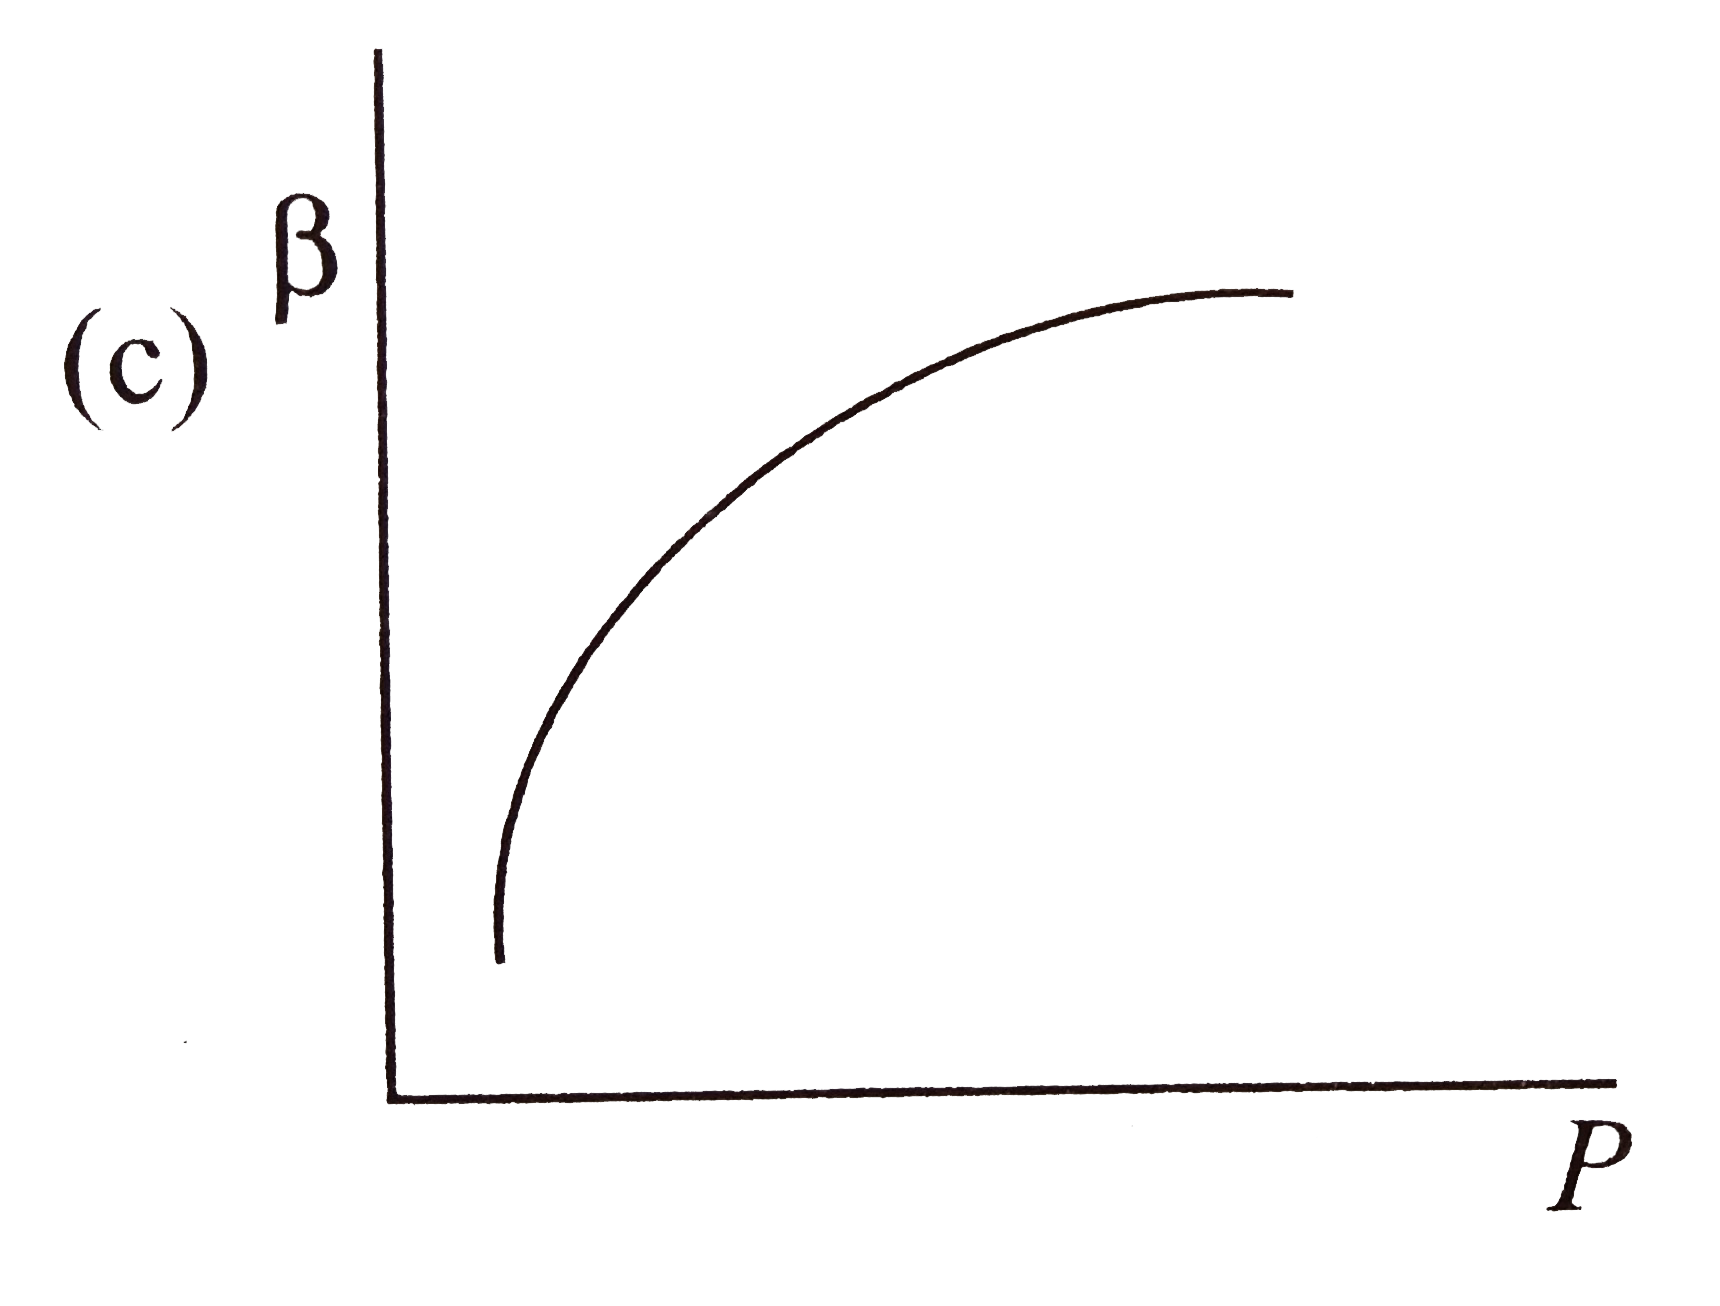 D
D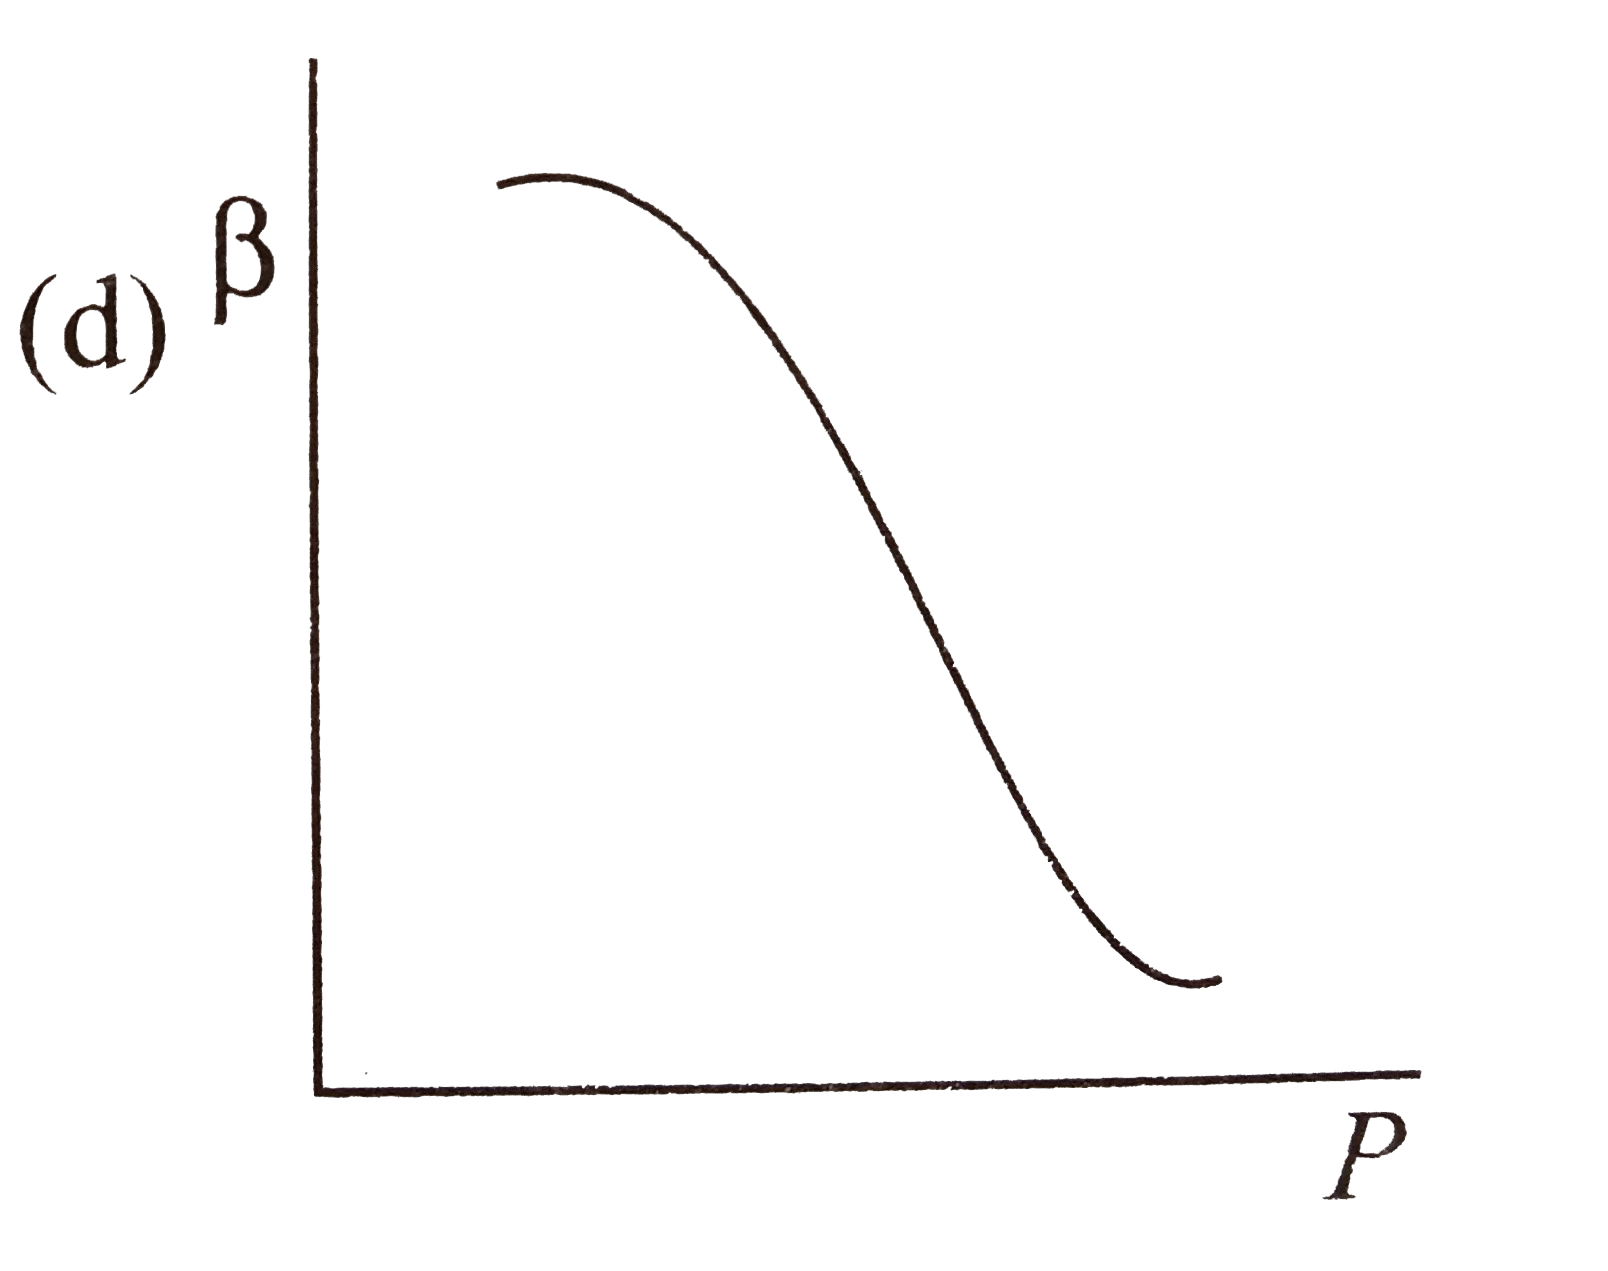
Which of the following graphs correctly represents the variation of β=−(dV/dP)/V with P for an ideal gas at constant temperature?
A B
B C
C D
D
Which of the following graphs correctly represents the variation of β=−dV/dPV
with P for an ideal gas at constant temperature?A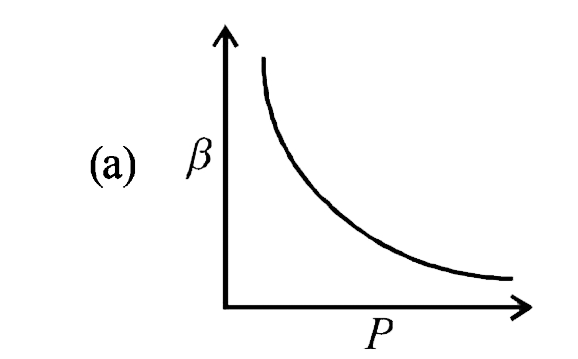 B
B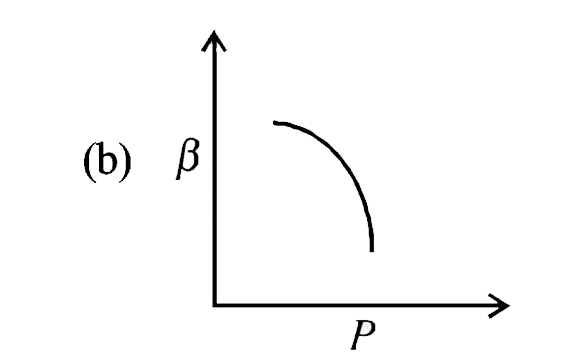 C
C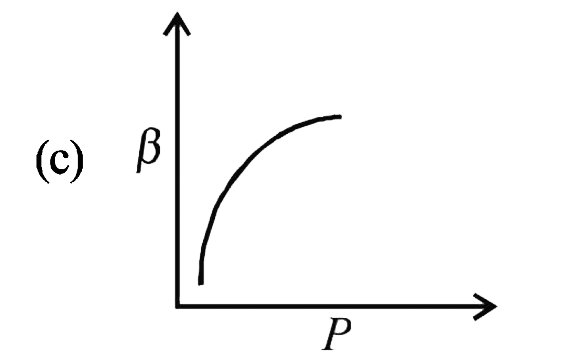 D
D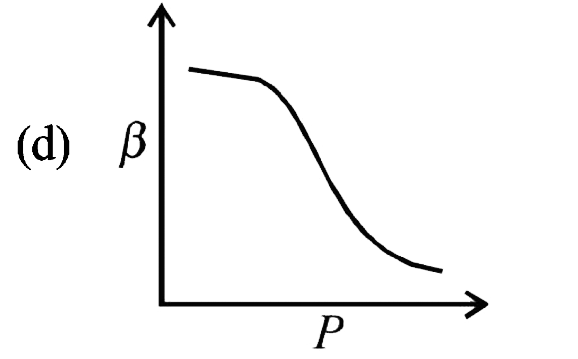
Which of the following graphs correctly represents the variation of β=−dV/dPV
with P for an ideal gas at constant temperature?
View SolutionWhich of the following graphs correctly represents the variation of β=−dV/dPV
with P for an ideal gas at constant temperature?
View SolutionWhich of the following graphs correctly represents the variation of β=−dV/dPV
with P for an ideal gas at constant temperature?
View SolutionWhich of the following graphs correctly represents the variation of β=−(dVdP)1V with P for an ideal gas at constant temperature ?
View SolutionWhich of the following graphs shows variation between density of water and temperature?
View Solution
