Which of the following graphs correctly represents the variation of g on the - Earth?
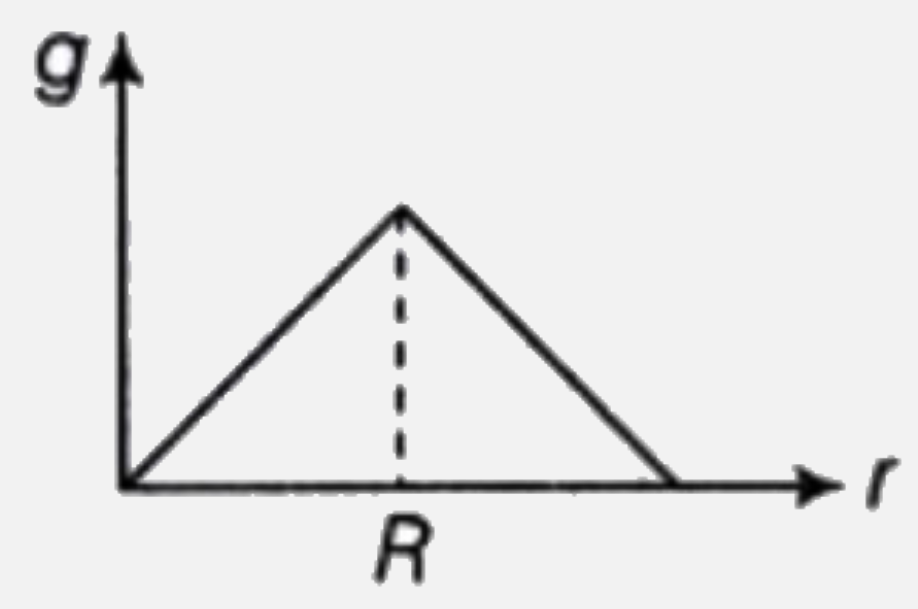
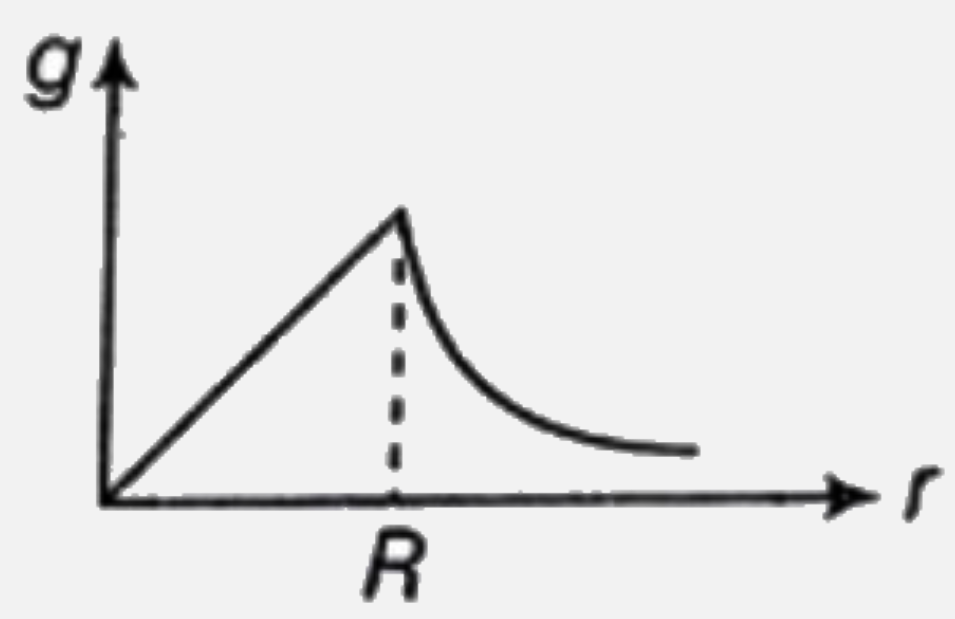
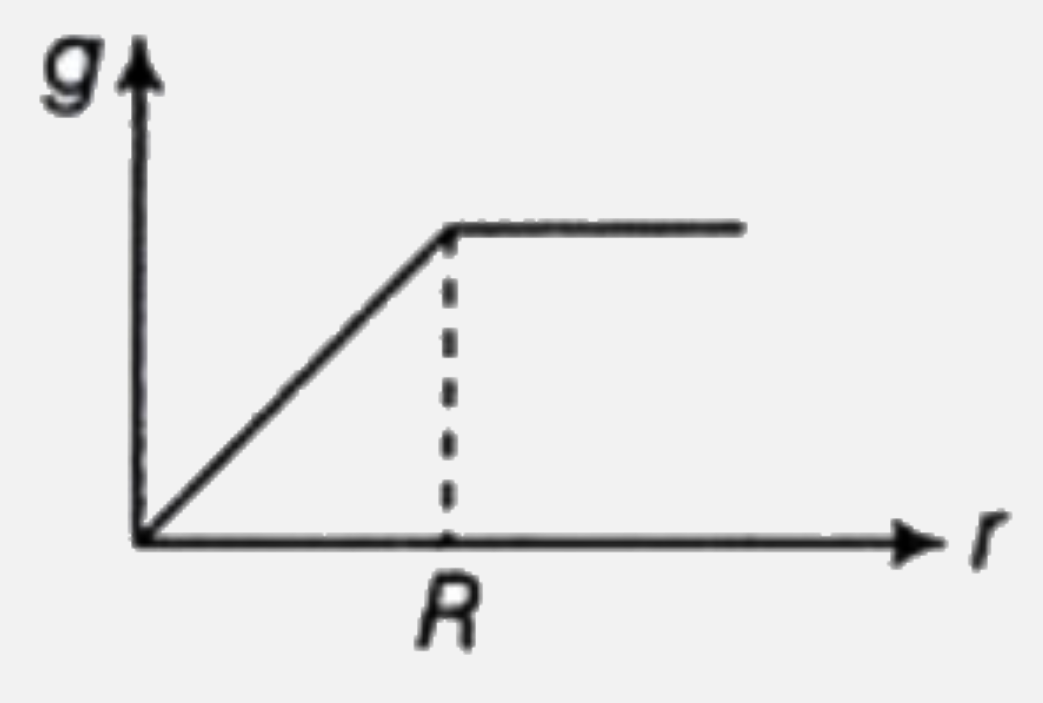
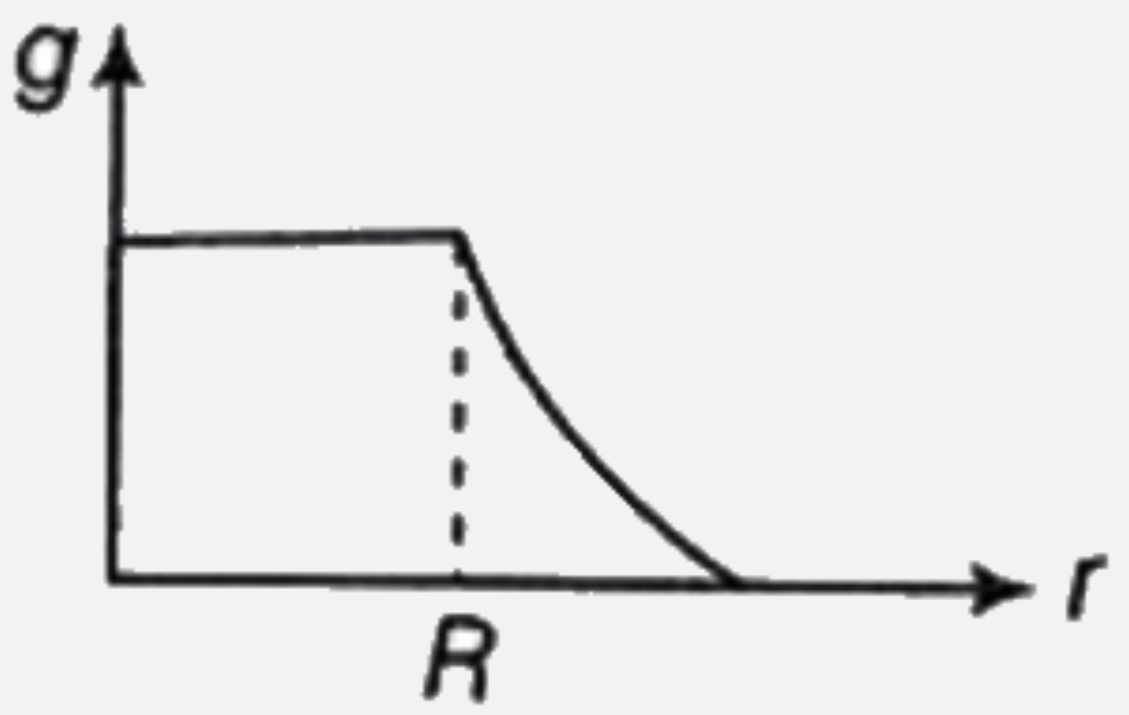
The correct Answer is:B
To solve the question regarding the variation of gravitational acceleration (g) on Earth, we will analyze how g changes with height above the Earth's surface and depth below the Earth's surface.
1. Understanding the Variation of g with Height:
- The formula for gravitational acceleration at a height h above the Earth's surface is given by:
g′=g(1+hR)2
- Here, g′ is the gravitational acceleration at height h, g is the gravitational acceleration at the Earth's surface, and R is the radius of the Earth.
- As h increases, g′ decreases, indicating that gravity decreases with height.
2. Understanding the Variation of g with Depth:
- The formula for gravitational acceleration at a depth d below the Earth's surface is:
g′=g(1−dR)
- Here, d is the depth below the surface.
- As d increases, g′ decreases, indicating that gravity also decreases with depth.
3. Analyzing the Behavior at the Center of the Earth:
- At the center of the Earth, when d=R, the gravitational acceleration g′ becomes:
g′=g(1−RR)=g(1−1)=0
- This means that at the center of the Earth, the gravitational acceleration is zero.
4. Graphical Representation:
- The graph of gravitational acceleration g′ versus distance from the center of the Earth would start from g at the surface, decrease linearly to zero at the center, and then decrease again as height increases above the surface.
- Therefore, the graph will show:
- A linear decrease from g to 0 as we go from the surface to the center.
- A decrease in g′ as we move above the surface.
5. Identifying the Correct Graph:
- Based on the analysis, the correct graph will show a decrease in gravitational acceleration as we move from the surface to the center and then a further decrease as we move above the surface.
Conclusion:
The correct graph that represents the variation of gravitational acceleration g on Earth is option B.
- The formula for gravitational acceleration at a height h above the Earth's surface is given by:
g′=g(1+hR)2
- Here, g′ is the gravitational acceleration at height h, g is the gravitational acceleration at the Earth's surface, and R is the radius of the Earth.
- As h increases, g′ decreases, indicating that gravity decreases with height.
- The formula for gravitational acceleration at a depth d below the Earth's surface is:
g′=g(1−dR)
- Here, d is the depth below the surface.
- As d increases, g′ decreases, indicating that gravity also decreases with depth.
- At the center of the Earth, when d=R, the gravitational acceleration g′ becomes:
g′=g(1−RR)=g(1−1)=0
- This means that at the center of the Earth, the gravitational acceleration is zero.
- The graph of gravitational acceleration g′ versus distance from the center of the Earth would start from g at the surface, decrease linearly to zero at the center, and then decrease again as height increases above the surface.
- Therefore, the graph will show:
- A linear decrease from g to 0 as we go from the surface to the center.
- A decrease in g′ as we move above the surface.
- Based on the analysis, the correct graph will show a decrease in gravitational acceleration as we move from the surface to the center and then a further decrease as we move above the surface.
The correct graph that represents the variation of gravitational acceleration g on Earth is option B.
Similar Questions
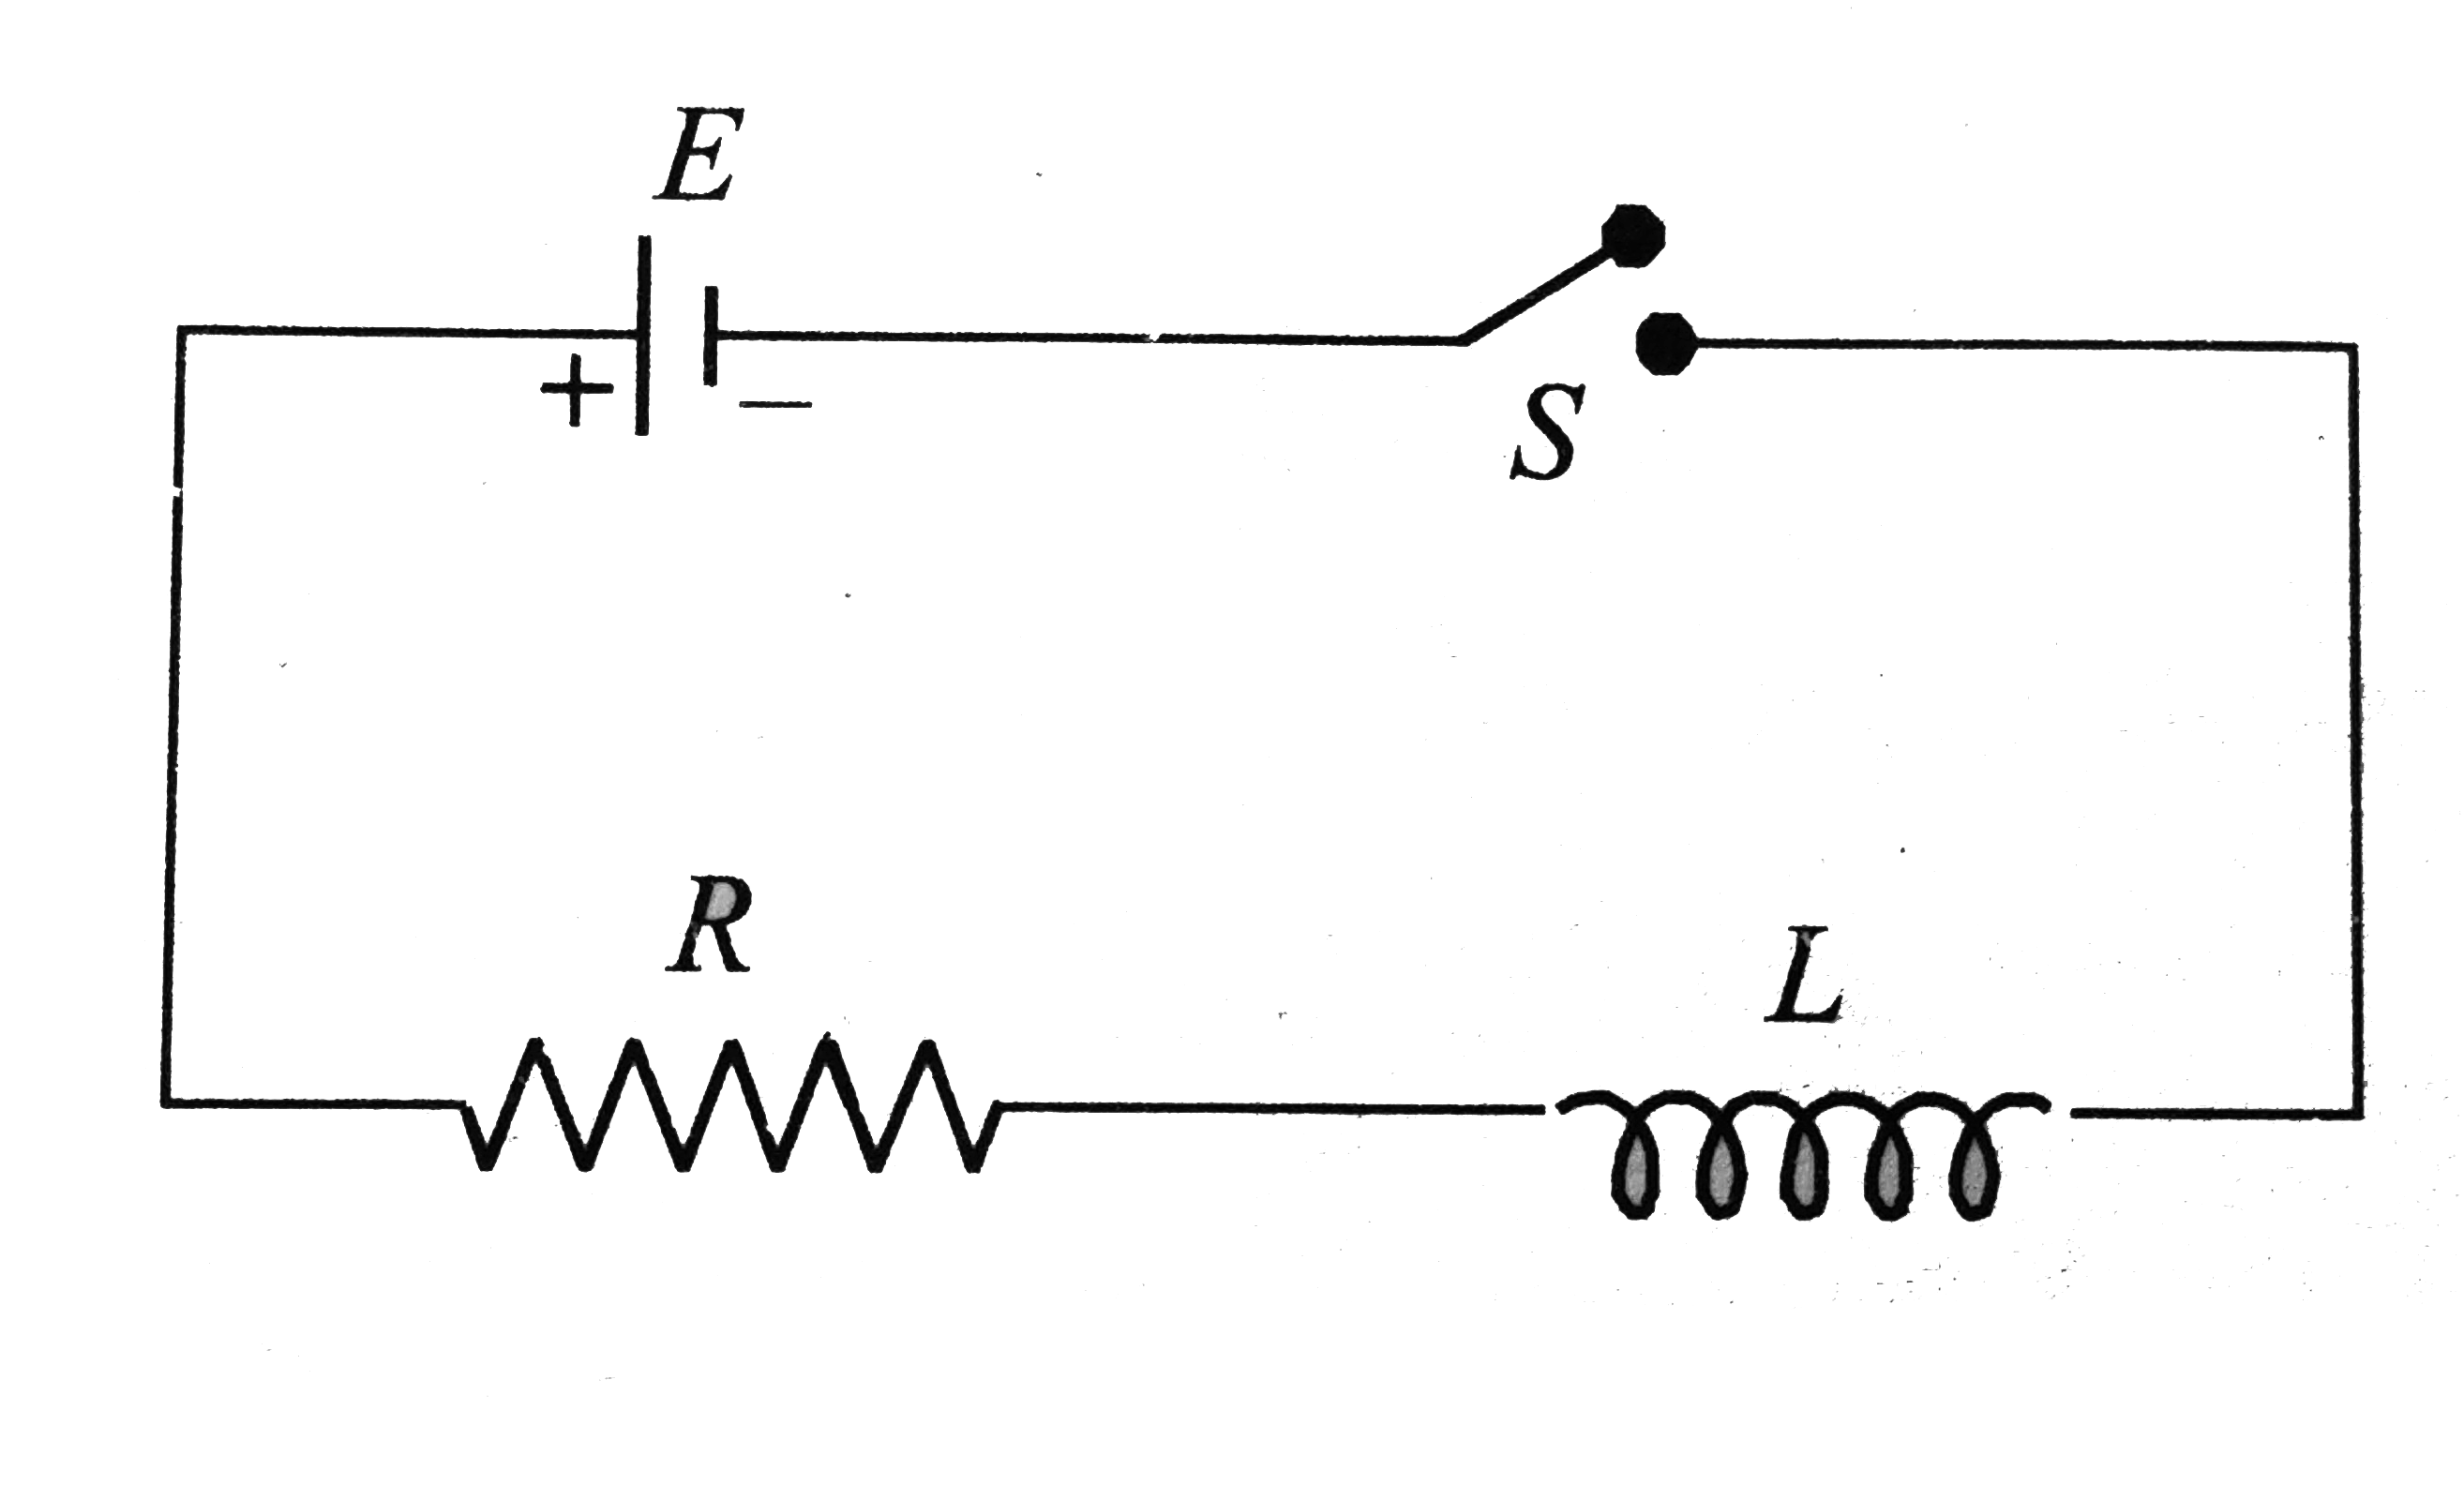
Switch S of the circuit shows in Fig. is closed at t=0. If e denotes the induced emf in L and i the current flowing through the circuit at time t, then which of the following graphs correctly represents the variation of e with i?
View SolutionWhich of the following graph correctly represents the variation of molar conductance (Δm) with dilution for a strong electrolyte ?
View Solution
Knowledge Check
The velocity -displacement graph of a particle is as shown in the figure. Which of the following graphs correctly represents the variation of acceleration with displacement?
 A
A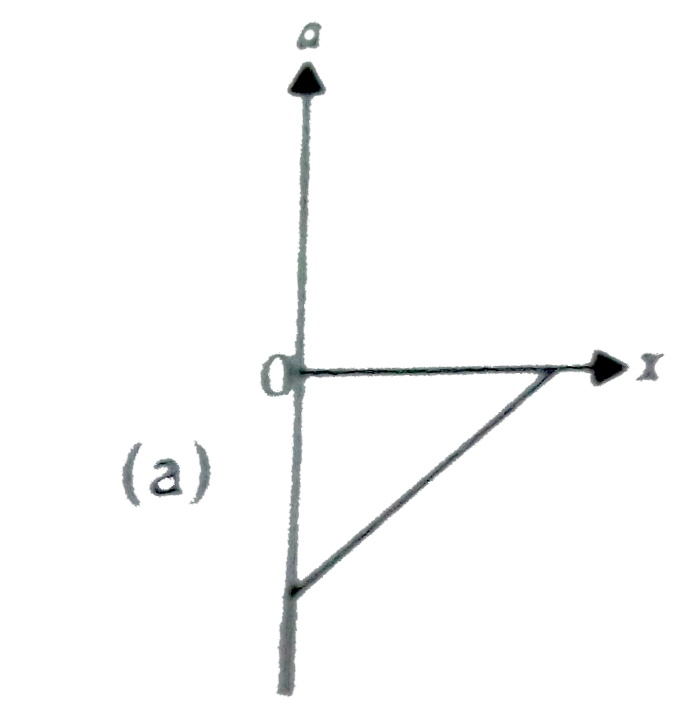 B
B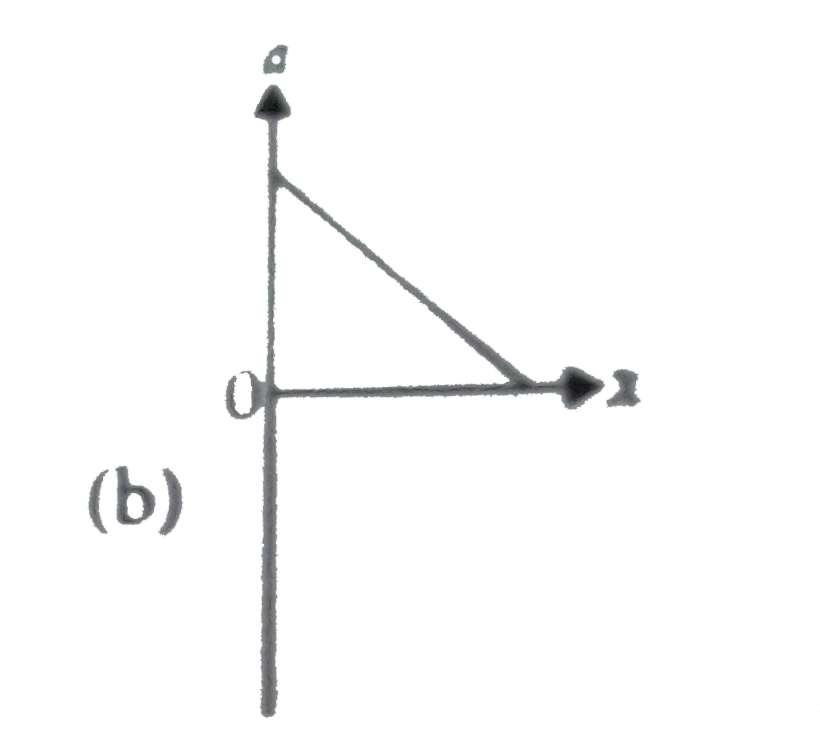 C
C D
D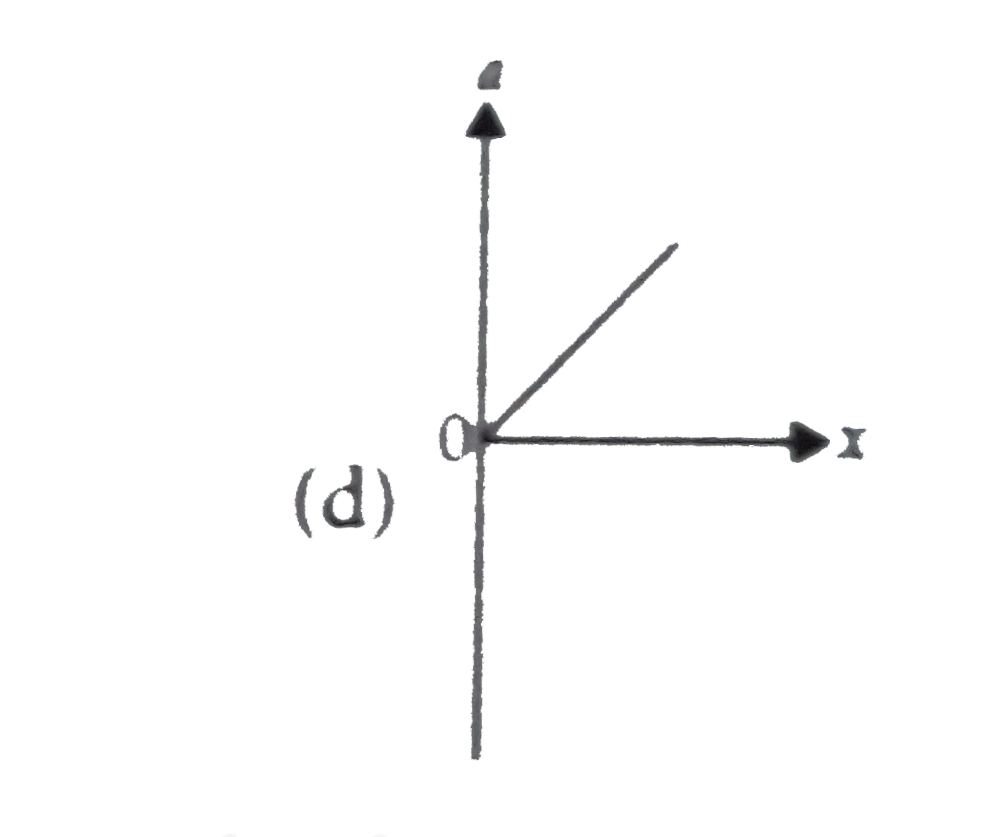
Within elastic limit, which of the following graphs correctly represents the variation of extension in the length of wire with the external load?
A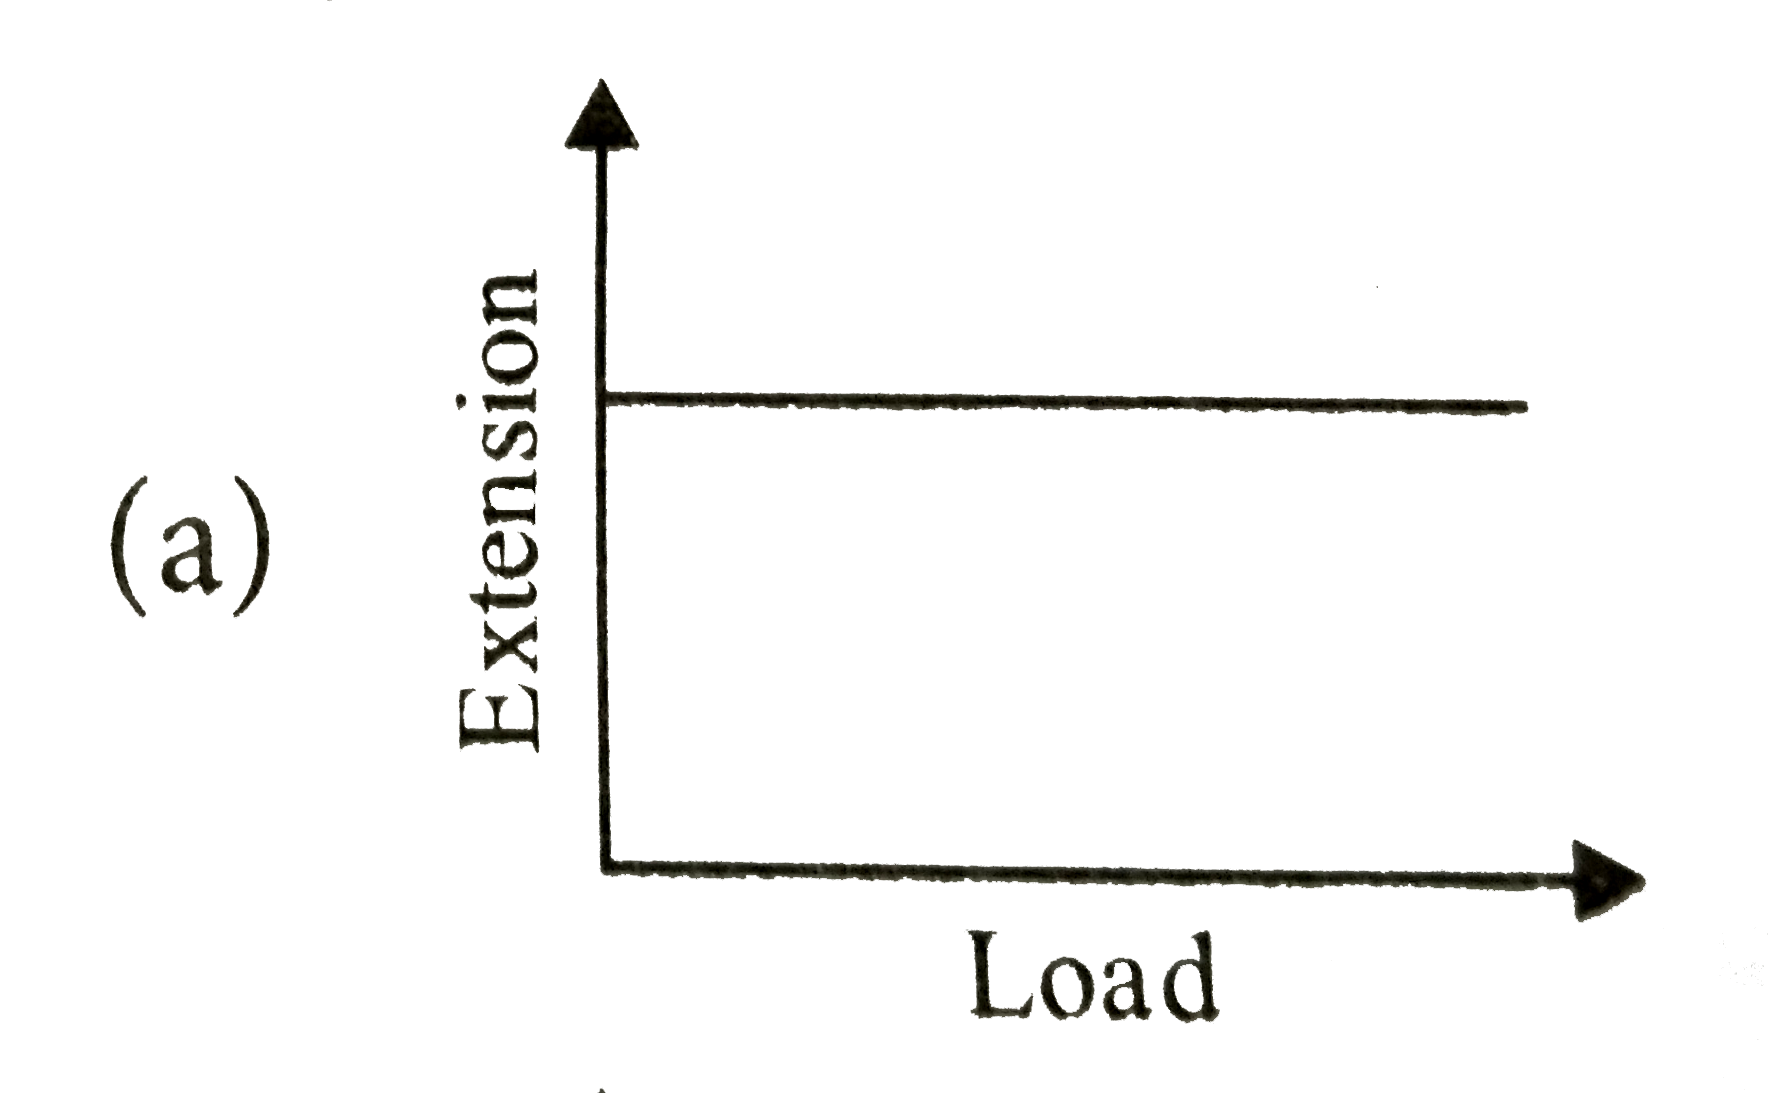 B
B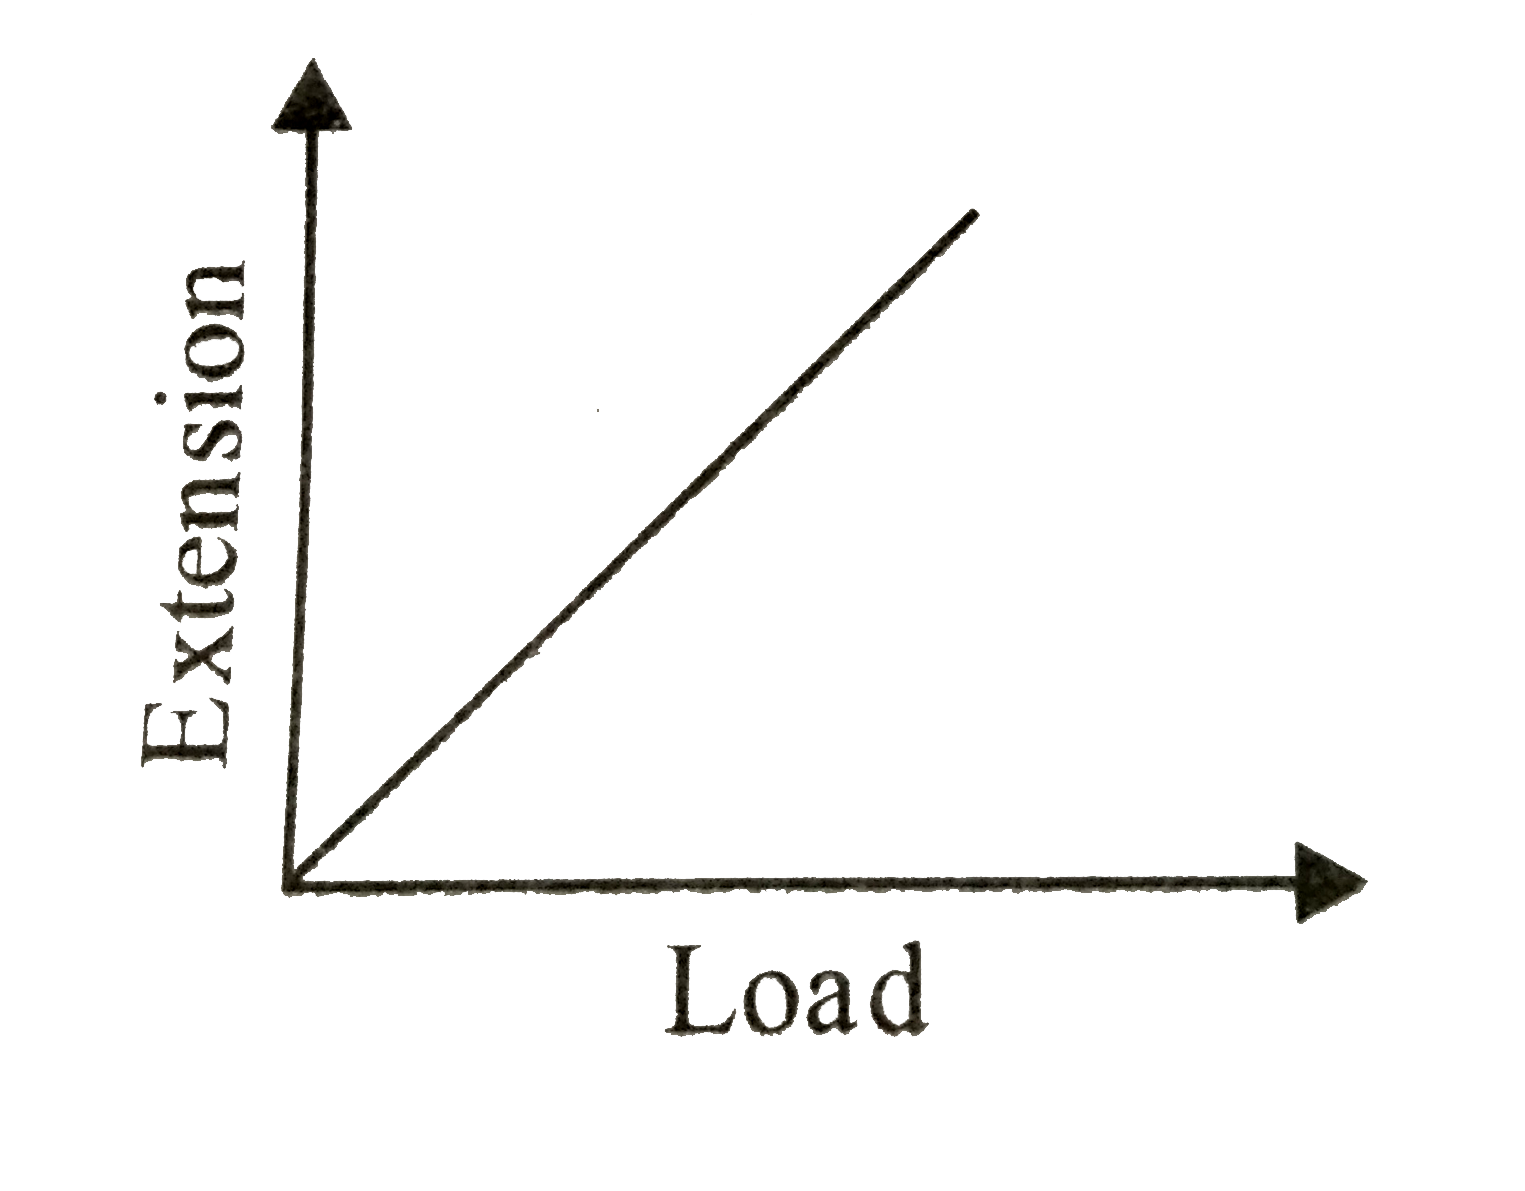 C
C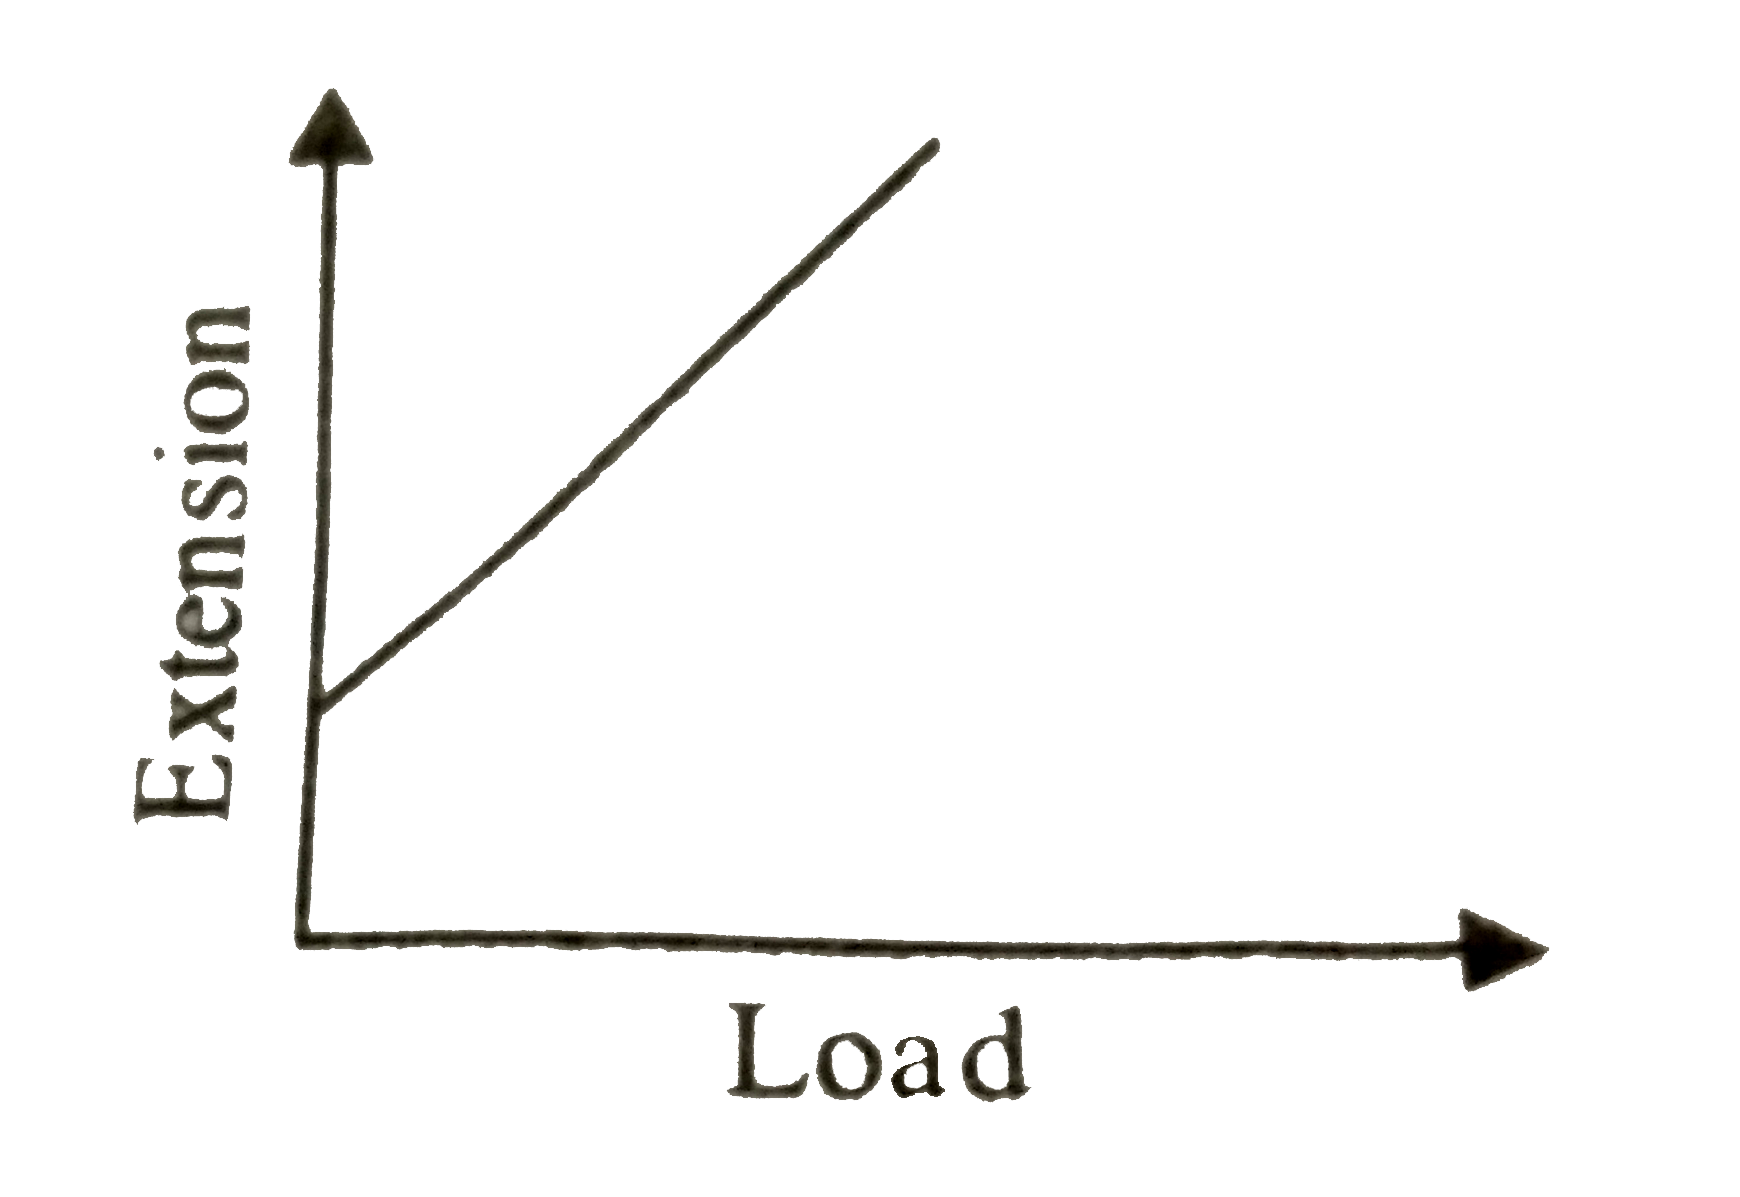 D
D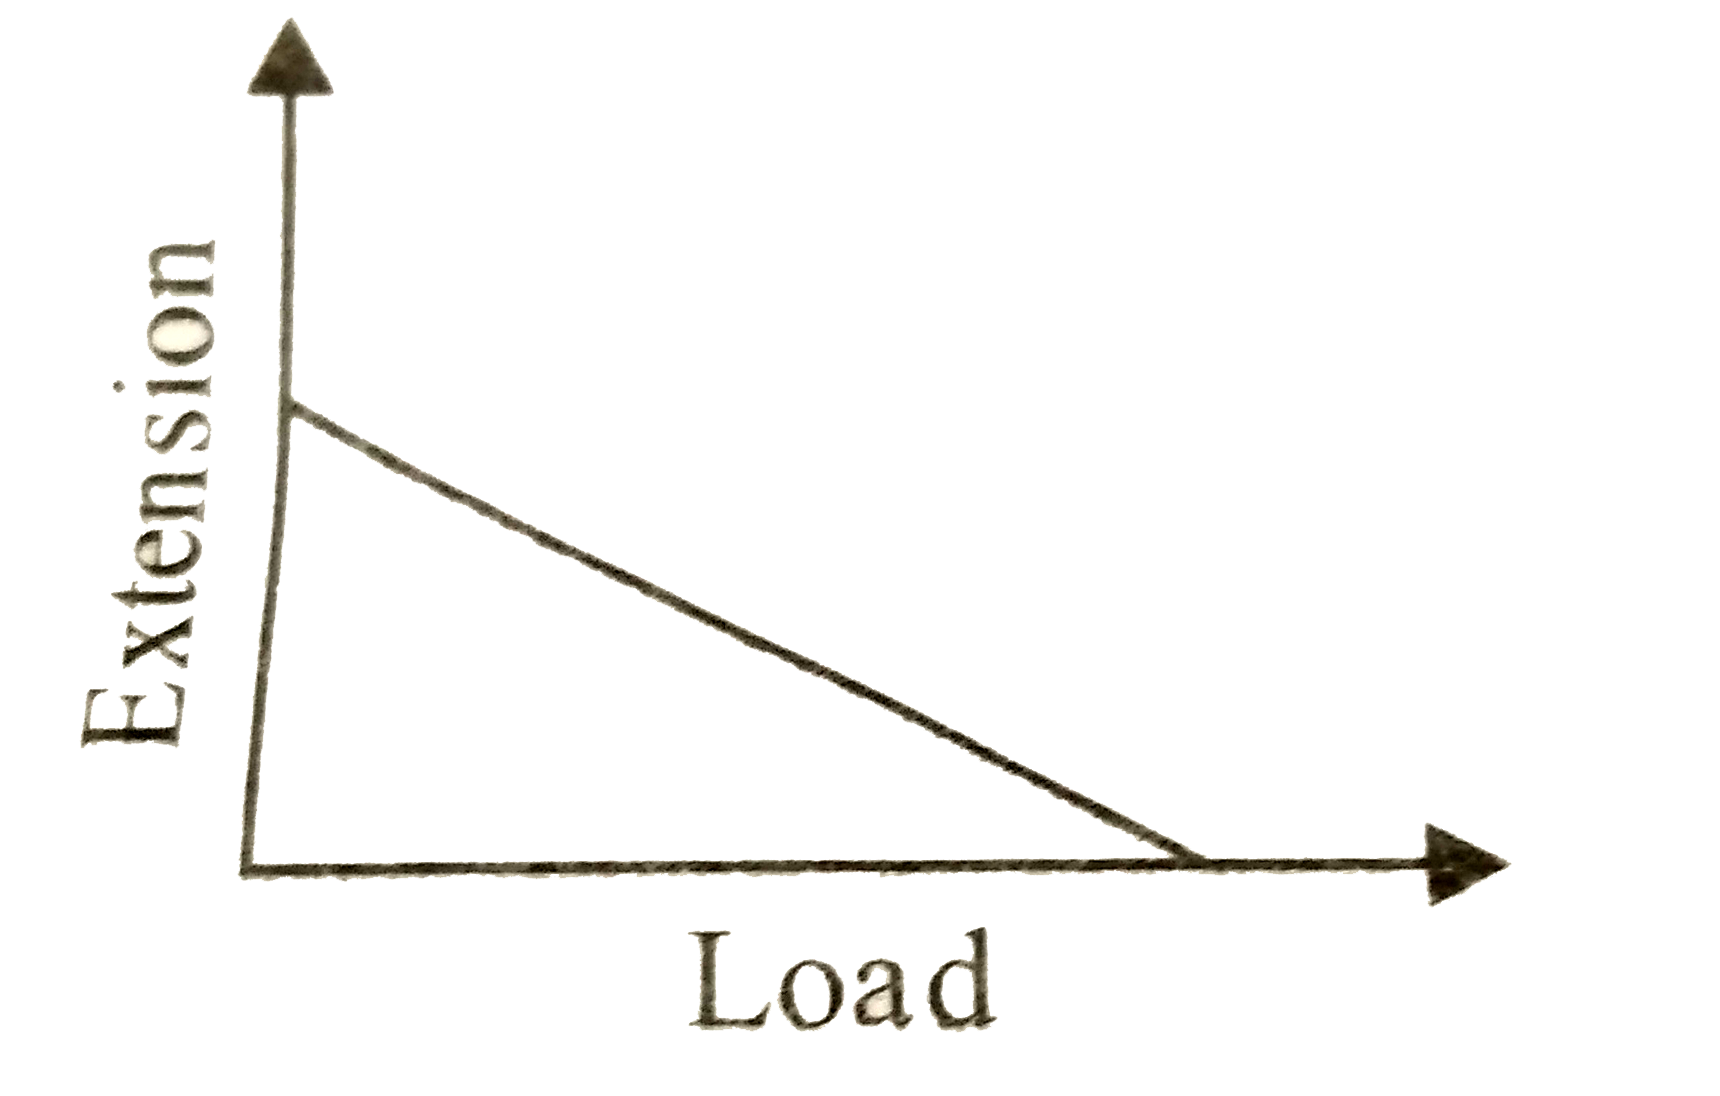
Which of the following reactions are correctly represented?
AR−CH=CH2+HCl→R−CH∣Cl−CH3BR−CH=CH2+HIH2O2−−→hvR−CH2−CH2−ICR−CH=CH2+HBrH2O2−−→hvR−CH2−CH2−BrDR−CH=CH2+HIH2O2−−→hvR−I∣CH−CH3
Which of following graphs correctly represents the variation of particle momentum with de-Broglie wavelength?
View SolutionWhich of the following graphs correctly represents the variation of β=−(dVdP)/V with P for an ideal gas at constant temperature
View SolutionWhich of the following graphs correctly represents the variation of β=−dV/dPV
with P for an ideal gas at constant temperature?
View SolutionWhich of the following graphs correctly represents the variation of β=−dV/dPV
with P for an ideal gas at constant temperature?
View SolutionWhich of the following diagram correctly represents the variation of internal energy (U) of gas under expansion at constant temperature.
View Solution
