The relative humidity (in %) of a certain city for a month of 30 days was as follows :
98.198.699.290.386.595.392.996.394.295.189.292.397.193.592.795.197.293.395.297.396.292.184.990.295.798.397.396.192.189
(ii) Which month or season do you think this data is about ? Solution in Kannada
Step by step video & image solution for The relative humidity (in %) of a certain city for a month of 30 days was as follows : {:(98.1,98.6,99.2,90.3,86.5,95.3,92.9,96.3,94.2,95.1),(89.2,92.3,97.1,93.5,92.7,95.1,97.2,93.3,95.2,97.3),(96.2,92.1,84.9,90.2,95.7,98.3,97.3,96.1,92.1,89):} (ii) Which month or season do you think this data is about ? by Maths experts to help you in doubts & scoring excellent marks in Class 9 exams.
Updated on:21/07/2023Topper's Solved these Questions
- STATISTICSBOOK - SUBHASH PUBLICATIONCHAPTER - STATISTICSEXERCISE - EXERCISE 14.3
16 Videos
- STATISTICSBOOK - SUBHASH PUBLICATIONCHAPTER - STATISTICSEXERCISE - EXERCISE 14.3
16 Videos
- QUADRILATERALSBOOK - SUBHASH PUBLICATIONCHAPTER - QUADRILATERALSEXERCISE - EXERCISE 7.2
10 Videos
- SURFACE AREAS AND VOLUMESBOOK - SUBHASH PUBLICATIONCHAPTER - SURFACE AREAS AND VOLUMESEXERCISE - EXERCISE 13.9
1 Videos
Similar Questions
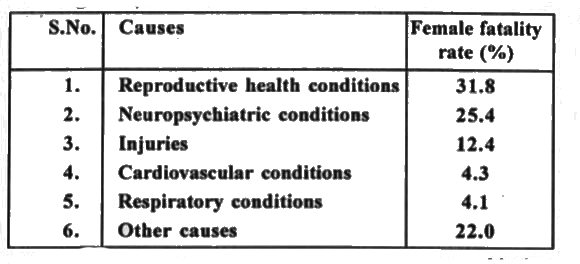
A survey conducted by an organisation for the cause of illness nad death among the women between the ages 15-44 (in years) worldwide, found the following figures (in %) :

(ii) Which condition is the major cause of women's ill health and death worldwide ?
View SolutionA survey conducted by an organisation for the cause of illness nad death among the women between the ages 15-44 (in years) worldwide, found the following figures (in %) :

(ii) Which condition is the major cause of women's ill health and death worldwide ?
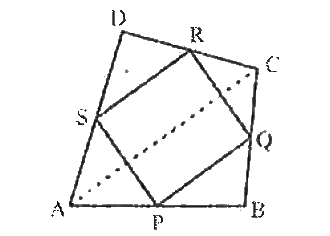
View SolutionABCD is a quadrilateral in which P, Q, R and S are mid- points of the sides AB, BC, CD and DA. AC is a diagonal. Show that :
SR|A|C and SR=12AC

View SolutionThe diameter of a sphere is decreased by 25%. By what per cent does its curved surface area decrease ?
View SolutionThe relative humidity (in %) of a certain city for a month of 30 days was as follows: 98.1 98.6 99.2 90.3 86.5 95.3 92.9 96.3 94.2 95.189.2 92.3 97.1 93.5 92.7 95.1 97.2 93.3 95.2 97.396.2 92.1 84.9 90.2 95.7 98.3 97.3 96.1 92.1 89 (i) Construct a grouped frequency distribution table with classes 84 - 86, 86 - 88, etc.(ii) Which month or season do you think this data is about?(iii) What is the range of this data?
View Solution30 दिन वाले महीने में एक नगर के सापेक्ष आर्द्रता (% में ) यह रही है :
98.198.699.290.386.595.392.996.394.295.189.292.397.193.592.795.197.293.395.297.396.292.184.990.295.798.397.396.192.189
(i) वर्ग 84 - 86, 86 - 88 आदि लेकर एक वर्गीकृत बारम्बारता बंटन बनाइए ।
(ii) क्या आप बता सकते हैं कि ये आंकड़े किस महीने या ऋतू से संबंधित है ?
(iii) इन आंकड़ों का परिसर क्या है ?
View Solution30 दिन वाले महीने में एक नगर की सापेक्ष आर्द्रता ( % में ) यह रही है :
98.1, 98.6, 99.2, 90.3, 86.5, 95.3, 92.9, 96.3, 94.2, 95.1, 89.2, 92.3, 97.1, 93.5, 92.7, 95.1, 97.2, 93.3, 95.2, 97.3, 96.2, 92.1, 84.9, 90.2, 95.7, 98.3, 97.3, 96.1, 92.1, 89
(i) वर्ग 84-86, 86-88 आदि लेकर एक वर्गीकृत बारम्बारता बंटन बनाइए।
(ii) क्या आप बता सकते हैं कि ये आँकड़े किस महीने या ऋतु से संबंधित हैं?
(iii) इन आँकड़ों का परिसर क्या है?
View Solution30 दिन वाले महीने में एक नगर कि सापेक्ष आर्द्रता (% में) निम्नलिखित रही है -
92.998.195.190.399.298.686.595.394.296.397.289.297.393.597.192.392.795.195.293.397.396.289.090.284.992.195.798.392.196.1
इन आँकड़ों का परिसर क्या है ?
View Solution30 दिन वाले महीने में एक नगर कि सापेक्ष आर्द्रता (% में) निम्नलिखित रही है -
92.998.195.190.399.298.686.595.394.296.397.289.297.393.597.192.392.795.195.293.397.396.289.090.284.992.195.798.392.196.1
वर्ग 84-86, 86-88 आदि लेकर एक वर्गीकृत बारंबारता बंटन सारणी बनाएँ |
View Solution30 दिन वाले महीने में एक नगर कि सापेक्ष आर्द्रता (% में) निम्नलिखित रही है -
92.998.195.190.399.298.686.595.394.296.397.289.297.393.597.192.392.795.195.293.397.396.289.090.284.992.195.798.392.196.1
कितने दिन आर्द्रता 87% से कम रही ?
View Solution30 दिन वाले महीने में एक नगर कि सापेक्ष आर्द्रता (% में) निम्नलिखित रही है -
92.998.195.190.399.298.686.595.394.296.397.289.297.393.597.192.392.795.195.293.397.396.289.090.284.992.195.798.392.196.1
कितने दिन आर्द्रता 92% या इससे अधिक और 96% से कम रही ?
View SolutionThe relative humidity (in %) of a certain city for a month of 30 days was as follows :
98.198.699.290.386.595.392.996.394.295.189.292.397.193.592.795.197.293.395.297.396.292.184.990.295.798.397.396.192.189
(i) Construct a grouped frequency distribution table with classes 84-86 ,86-88, etc.
View SolutionThe relative humidity (in %) of a certain city for a month of 30 days was as follows :
98.198.699.290.386.595.392.996.394.295.189.292.397.193.592.795.197.293.395.297.396.292.184.990.295.798.397.396.192.189
(iii) What is the range of this data ?
View Solution
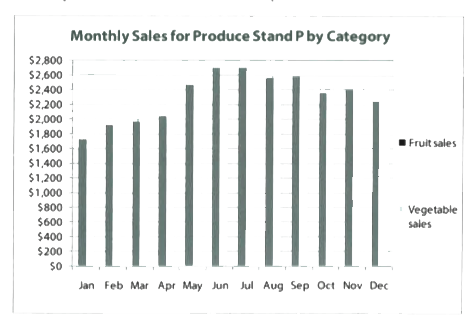
Which month had the largest percentage of vegetable sales relative to total sales?
View SolutionThe relative humidity (in percent) values of a city for the month of September are given below. (Because 99.5 - 89.5 = 10) What is the data amplitude?
View SolutionThe relative humidity (in %) of a certain City for a September month of 30 days was as follows:

(i) Construct a grouped frequency distribution table with classes 84-86, 86,-88 etc.
(ii) What is the range of the data?
View Solution
