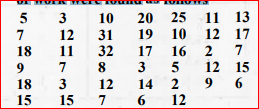
The distance (in km) of 40 engineers from their residence to their place of work were found as follows :
5310202511137123119101217181132171627978351215183121429615157612
Construct a grouped frequency distribution table with class size for the data given above taking the first interval as 0-5 (5 not included). What main features do you observe from this tabular representation ? Solution in Kannada
Step by step video & image solution for The distance (in km) of 40 engineers from their residence to their place of work were found as follows : {:(5,3,10,20,25,11,13,7,12,31),(19,10,12,17,18,11,32,17,16,2),(7,9,7,8,3,5,12,15,18,3),(12,14,2,9,6,15,15,7,6,12):} Construct a grouped frequency distribution table with class size for the data given above taking the first interval as 0-5 (5 not included). What main features do you observe from this tabular representation ? by Maths experts to help you in doubts & scoring excellent marks in Class 9 exams.
Updated on:21/07/2023Topper's Solved these Questions
- STATISTICSBOOK - SUBHASH PUBLICATIONCHAPTER - STATISTICSEXERCISE - EXERCISE 14.3
16 Videos
- STATISTICSBOOK - SUBHASH PUBLICATIONCHAPTER - STATISTICSEXERCISE - EXERCISE 14.3
16 Videos
- QUADRILATERALSBOOK - SUBHASH PUBLICATIONCHAPTER - QUADRILATERALSEXERCISE - EXERCISE 7.2
10 Videos
- SURFACE AREAS AND VOLUMESBOOK - SUBHASH PUBLICATIONCHAPTER - SURFACE AREAS AND VOLUMESEXERCISE - EXERCISE 13.9
1 Videos
Similar Questions
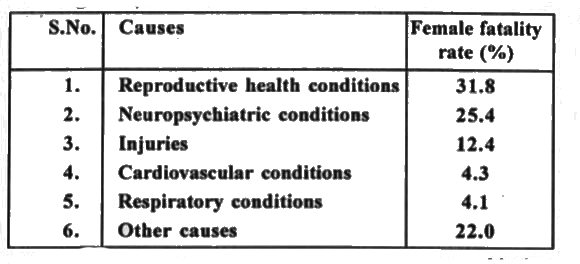
A survey conducted by an organisation for the cause of illness nad death among the women between the ages 15-44 (in years) worldwide, found the following figures (in %) :

(ii) Which condition is the major cause of women's ill health and death worldwide ?
View SolutionA survey conducted by an organisation for the cause of illness nad death among the women between the ages 15-44 (in years) worldwide, found the following figures (in %) :

(ii) Which condition is the major cause of women's ill health and death worldwide ?
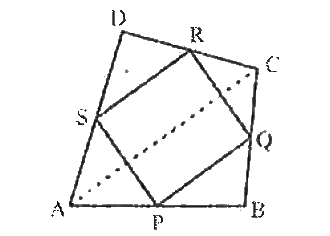
View SolutionABCD is a quadrilateral in which P, Q, R and S are mid- points of the sides AB, BC, CD and DA. AC is a diagonal. Show that :
SR|A|C and SR=12AC

View SolutionThe diameter of a sphere is decreased by 25%. By what per cent does its curved surface area decrease ?
View SolutionThe distance (in km) of 40 engineers from their residence to their place of work were found as follows.

Construct a grouped frequency distribution table with calss- size 5 for the data given above taking the first interval as 0-5 (5 not included). What main features do you observe from this tabular representation?
View Solution40 इंजीनियरों की उनके आवास से कार्य-स्थल की (किलोमीटर में ) दूरियाँ ये है :
5310202511137123119101217181132171627978351215183121429615157612
0 - 5 को (जिसमे 5 सम्मिलित नहीं है) पहला अंतराल लेकर ऊपर दिए हुए आंकड़ों से वर्ग-माप 5 वाली एक वर्गीकृत बारम्बारता बंटन सारणी बनाइए । इस सारणीबद्ध निरूपण में आपको कौन-से मुख्य लक्षण देखने को मिलते है?
View SolutionDistance (in km) of 40 engineers from their place of residence to their place of work were found as follows.

What is the empirical probability that an engineer lives.
less than 7 km from her place of work ?
View SolutionDistance (in km) of 40 engineers from their place of residence to their place of work were found as follows.

What is the empirical probability that an engineer lives.
more than or equal to 7 km from her place of work ?
View SolutionDistance (in km) of 40 engineers from their place of residence to their place of work were found as follows.

What is the empirical probability that an engineer lives.
within 12 km from her place of work ?
View Solution40 इंजीनियरों की उनके आवास से कार्य-स्थल की(किलोमीटर में) दूरियाँ ये हैं :
5 3 10 20 25 11 13 7 12 31
19 10 12 17 18 11 32 17 16 2
7 9 7 8 3 5 12 15 18 3
12 14 2 9 6 15 15 7 6 12
(0-5 को (जिसमें 5 सम्मिलित नहीं है) पहला अंतराल लेकर ऊपर दिए हुए आंकड़ों से वर्ग-माप 5 वाली एक वर्गीकृत बारंबारता बंटन सारणी बनाइए। इस सारणी बद्ध निरूपण में आपको कौन-से मुख्य लक्षण देखने को मिलते हैं?
View SolutionThe distance (in km) of 40 engineers from their residence to their place of work were found as follows :

Construct a grouped frequency distribution table with class size 5 for the data given above taking the first interval as 0-5 (5 not included). What main features do you observe from this tabular representation ?
View SolutionDistance (in km) of 40 engineers from their place of residence to their place of work were found as follows
 Construct n grouped frequency distribution table with class size 5 for the data given above taking the first interval as 0— 5 (5 not included). What main features do you observe from this tabular representation ?
View Solution40 ਇੰਜੀਨੀਅਰਾਂ ਦੀ ਉਹਨਾਂ ਦੇ ਘਰ ਤੋਂ ਦਫਤਰ ਦੀ (ਕਿਲੋਮੀਟਰਾਂ ਵਿਚ) ਦੂਰੀਆਂ ਇਹ ਹਨ:-
 0-5 ਨੂੰ (ਜਿਸ ਵਿੱਚ 5 ਸ਼ਾਮਿਲ ਨਹੀਂ) ਪਹਿਲਾ ਵਰਗ ਅੰਤਰਾਲ ਲੈ ਕੇ ਦਿੱਤੇ ਗਏ ਅੰਕੜਿਆਂ ਤੋਂ ਵਰਗ ਮਾਪ 5 ਵਾਲੀ ਇੱਕ ਵਰਗੀਕ੍ਰਿਤ ਬਾਰੰਬਾਰਤਾ ਵੰਡ ਸਾਰਣੀ ਬਣਾਓ। ਇਸ ਸਾਰਣੀਬੱਧ ਪ੍ਰਦਰਸ਼ਨ ਵਿੱਚ ਤੁਹਾਨੂੰ ਕਿਹੜੇ ਮੁੱਖ ਲੱਛਣ ਦਿਖਾਈ ਦਿੰਦੇ ਹਨ?
View SolutionThe distance (in km) of 40 engineers from their residence to their place of work were found as follows.

Construct a grouped frequency distribution table with calss- size 5 for the data given above taking the first interval as 0-5 (5 not included).
View Solution40 इंजीनियरों की उनके आवास से कार्य-स्थल की (किलोमीटर में) दूरियां ये हैं :
 0-5 को (जिसमें 5 सम्मिलित नहीं है) पहला अंतराल लेकर ऊपर दिए हुए आंकड़ों से वर्ग-माप 5 वाली एक वर्गीकृत बारंबारता बंटन सारणी बनाइए। इस सारणी बद्ध निरूपण में आपको कौन-से मुख्य लक्षण देखने को मिलते हैं?
View Solution
