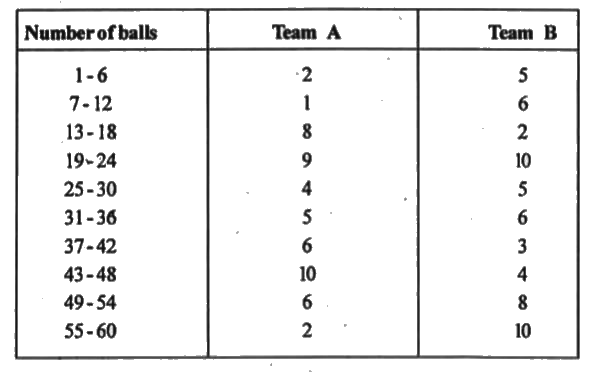
The runs scored by two teams A and B on the first 60 balls in a cricket match are given below :

Represent the data of both the teams on the same graph by frequency polygons. Solution in Kannada
Step by step video & image solution for The runs scored by two teams A and B on the first 60 balls in a cricket match are given below : Represent the data of both the teams on the same graph by frequency polygons. by Maths experts to help you in doubts & scoring excellent marks in Class 9 exams.
Updated on:21/07/2023Topper's Solved these Questions
- STATISTICSBOOK - SUBHASH PUBLICATIONCHAPTER - STATISTICSEXERCISE - EXERCISE 14.2
8 Videos
- QUADRILATERALSBOOK - SUBHASH PUBLICATIONCHAPTER - QUADRILATERALSEXERCISE - EXERCISE 7.2
10 Videos
- SURFACE AREAS AND VOLUMESBOOK - SUBHASH PUBLICATIONCHAPTER - SURFACE AREAS AND VOLUMESEXERCISE - EXERCISE 13.9
1 Videos
Similar Questions
The blood groups of 30 students of class VIII are recorded as follows :
A,B,O,O,AB,O,A,O,B,A,O,B,A,O,O,A,AB,O,A,A,O,O,AB,B,A,O,B,A,B,O.
Represent this data in the form of a frequency distribution table. Which is the most common, and which is the rarest, blood group among these students ?
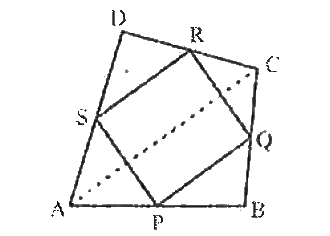
View SolutionABCD is a quadrilateral in which P, Q, R and S are mid- points of the sides AB, BC, CD and DA. AC is a diagonal. Show that :
SR|A|C and SR=12AC

View SolutionThe diameter of a sphere is decreased by 25%. By what per cent does its curved surface area decrease ?
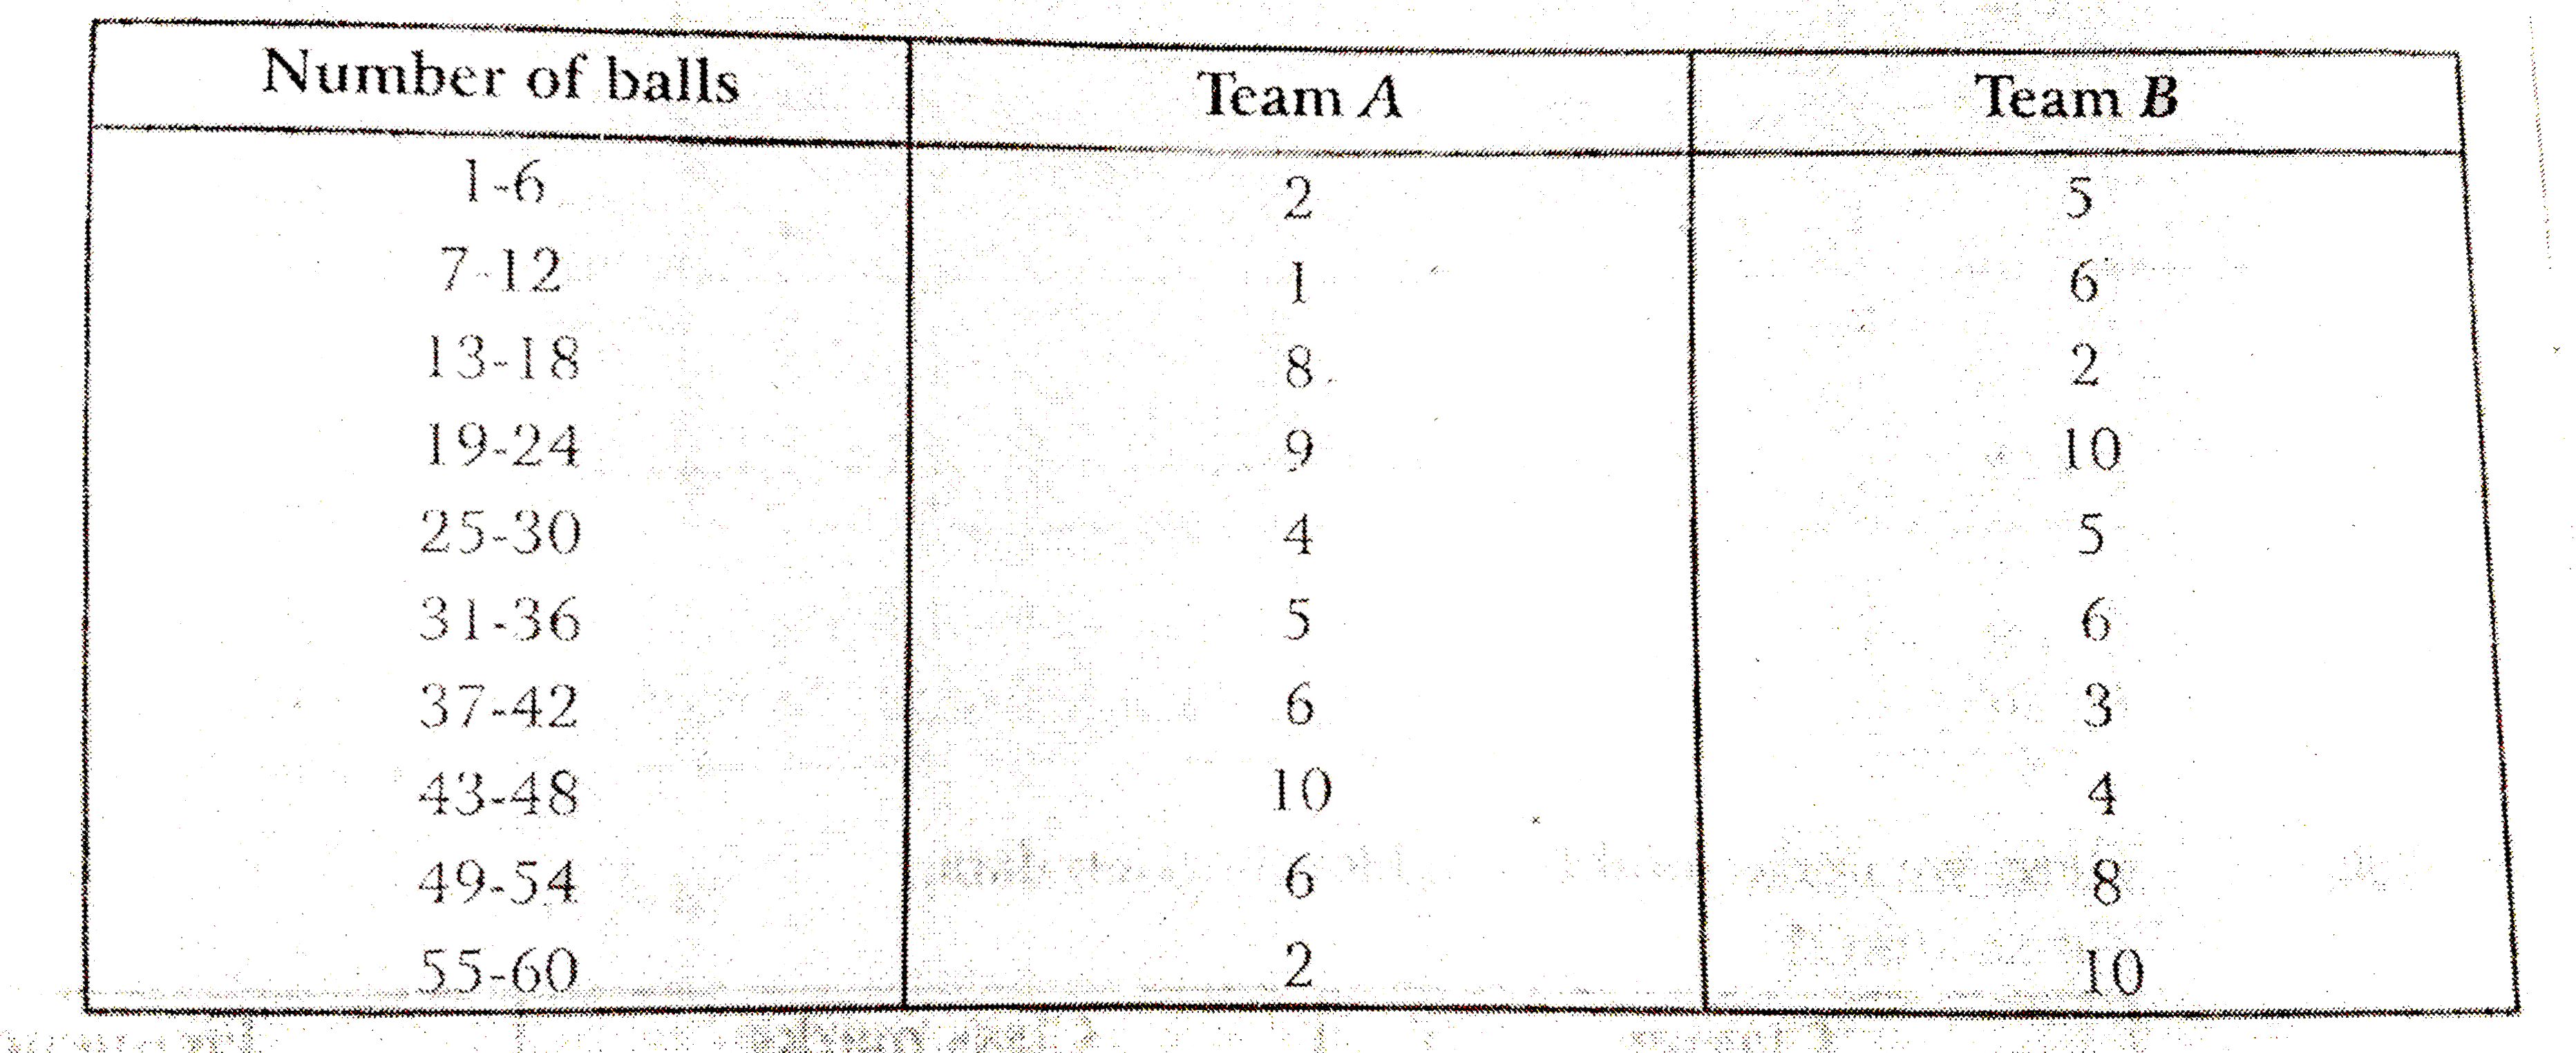
View SolutionThe runs scored by two teams A and B on the first 60 balls in a cricket match are given below:

Represent the data of both the teams on the same graph by frequency polygons.
View SolutionDetermine the point of symmetry of a regular hexagon.
View SolutionMatch the following Column A to Column B

View SolutionMatch the following Column A to Column B

View SolutionMatch the following Column A to Column B

View SolutionFind the area of figure given below.

View SolutionFind the area of the figure given below.

View SolutionThe area of the shaded part in the figure given below is ______.

View SolutionThe inequation represented by the graph given below is :
View SolutionThe inequation that best describes the graph given below is _________
View SolutionThe inequation that best describes the following graph is _________
View SolutionWhich inequations represent the shaded region in the given figure
View Solution
