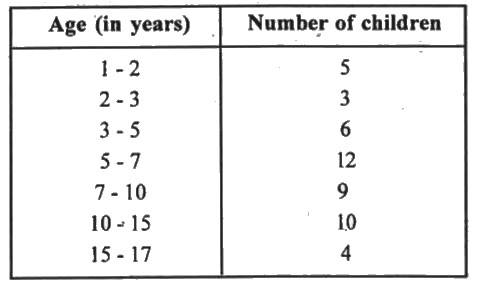
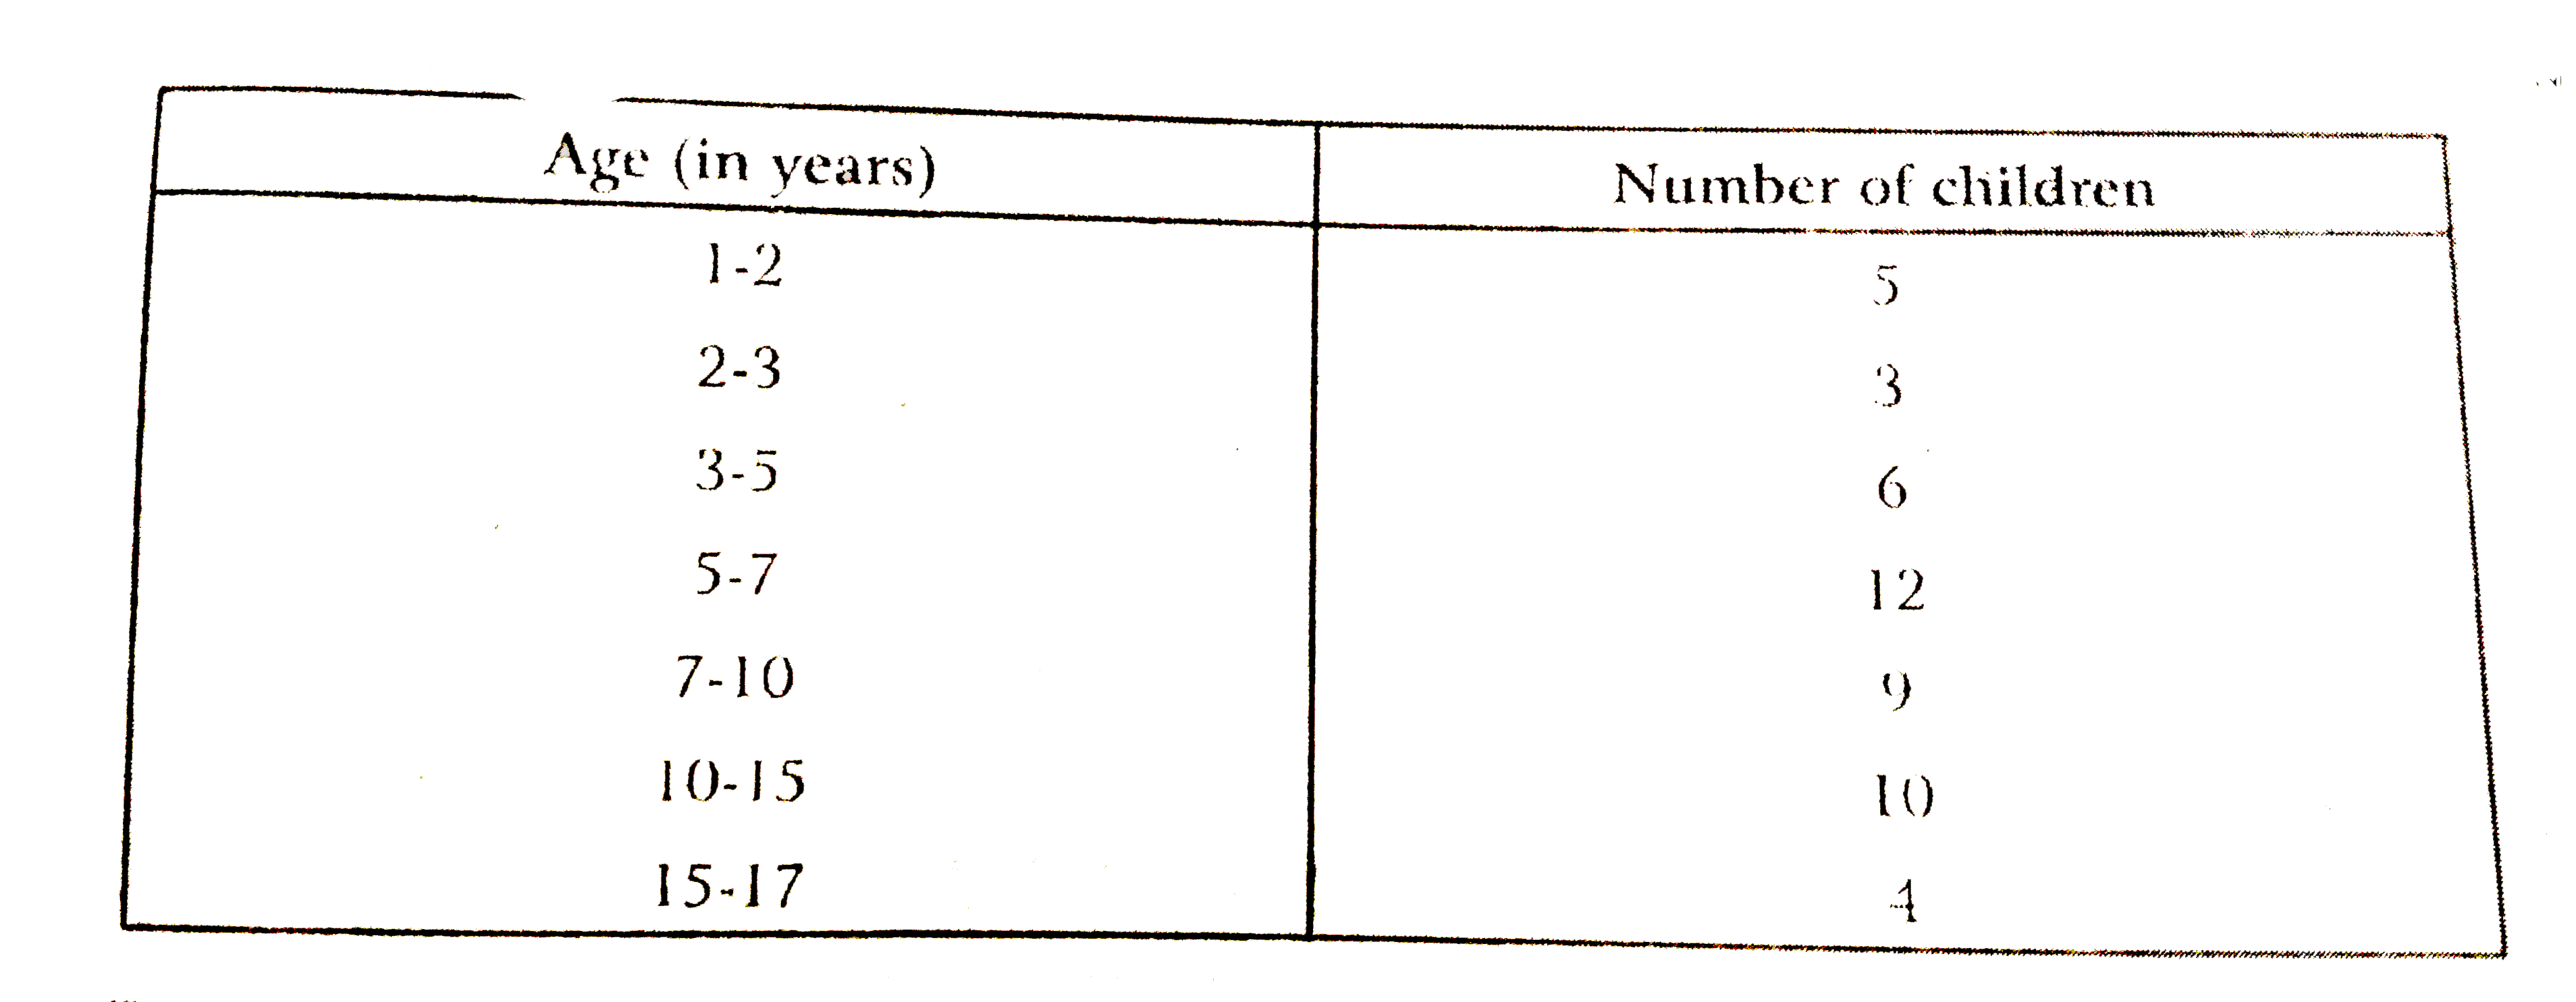
A random survey of the number of childern of various age groups playing in a park was found as follows :

Draw a histogram to represent the data above. Solution in Kannada
Step by step video & image solution for A random survey of the number of childern of various age groups playing in a park was found as follows : Draw a histogram to represent the data above. by Maths experts to help you in doubts & scoring excellent marks in Class 9 exams.
Updated on:21/07/2023Topper's Solved these Questions
- STATISTICSBOOK - SUBHASH PUBLICATIONCHAPTER - STATISTICSEXERCISE - EXERCISE 14.2
8 Videos
- QUADRILATERALSBOOK - SUBHASH PUBLICATIONCHAPTER - QUADRILATERALSEXERCISE - EXERCISE 7.2
10 Videos
- SURFACE AREAS AND VOLUMESBOOK - SUBHASH PUBLICATIONCHAPTER - SURFACE AREAS AND VOLUMESEXERCISE - EXERCISE 13.9
1 Videos
Similar Questions
The blood groups of 30 students of class VIII are recorded as follows :
A,B,O,O,AB,O,A,O,B,A,O,B,A,O,O,A,AB,O,A,A,O,O,AB,B,A,O,B,A,B,O.
Represent this data in the form of a frequency distribution table. Which is the most common, and which is the rarest, blood group among these students ?
View SolutionABCD is a quadrilateral in which P, Q, R and S are mid- points of the sides AB, BC, CD and DA. AC is a diagonal. Show that :
SR|A|C and SR=12AC

View SolutionThe diameter of a sphere is decreased by 25%. By what per cent does its curved surface area decrease ?
View SolutionA random survey of the number of children of various age groups playing in a park was found as following Draw a histogram to represent
View SolutionA random survey of the number of children of various are groups playing in park was found as follows :

Draw a histogram to represent the data above.
View SolutionHow many lines of symmetry does the above figure have ?
View SolutionWhich of the following are correct chain isomers of butane ? (i)
View SolutionDetermine the point of symmetry of a regular hexagon.
View SolutionDtermine the images of the following figure about the given line :
View SolutionDraw the bisector of ∠AOB=58∘
ltimg src="https://d10lpgp6xz60nq.cloudfront.net/physics_images/PS_MATH_VII_C05_S01_009_Q01.png" width="80%"gt
View SolutionMatch the following Column A to Column B

View SolutionMatch the following Column A to Column B

View SolutionMatch the following Column A to Column B

View SolutionThe inequation represented by the graph given below is :
View SolutionThe inequation that best describes the graph given below is _________
View SolutionThe inequation that best describes the following graph is _________
View Solution
