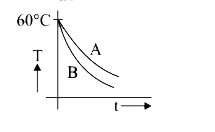
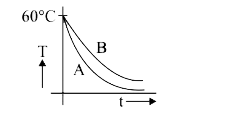
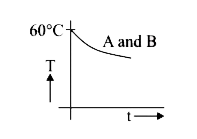
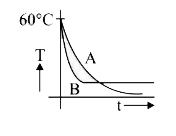
Two identical beakers A and B contain equal volumes of two different liquids at 60∘C each and left to cool down. Liquid in A has density of 8×10²kg/m3 and specific heat of 2000Jkg−1K−1 while liquid in B has density of 103kgm−3 and specific heat of 4000Jkg−1K−1 . Which of the following best describes their temperature versus time graph schematically ? (assume the emissivity of both the beakers to be the same)


The correct Answer is:B
To solve the problem, we need to analyze the cooling rates of the two liquids in beakers A and B based on their specific heat capacities and masses. Here’s a step-by-step breakdown of the solution:
Step 1: Calculate the Mass of the Liquids
The mass of the liquid in each beaker can be calculated using the formula:
Mass(m)=Density(ρ)×Volume(V)
- For beaker A:
mA=ρA×V=(800kg/m3)×V
- For beaker B:
mB=ρB×V=(1000kg/m3)×V
Step 2: Identify the Specific Heat Capacities
The specific heat capacities of the liquids are given as:
- For liquid A: cA=2000J/kg/K
- For liquid B: cB=4000J/kg/K
Step 3: Calculate the Heat Capacity (C) of Each Liquid
The heat capacity C is calculated as:
C=m×c
- For beaker A:
CA=mA×cA=(800V)×(2000)=1600000VJ/K
- For beaker B:
CB=mB×cB=(1000V)×(4000)=4000000VJ/K
Step 4: Compare the Heat Capacities
From the calculations:
- CA=1600000V
- CB=4000000V
Since CB>CA, it indicates that beaker B has a higher heat capacity than beaker A.
Step 5: Apply Newton's Law of Cooling
According to Newton's law of cooling, the rate of change of temperature is given by:
dθdt=−k(T−T0)C
Where:
- T is the temperature of the liquid,
- T0 is the surrounding temperature,
- k is a constant.
Since CB>CA, the rate of temperature change dθdt will be smaller for beaker B compared to beaker A.
Step 6: Analyze the Temperature vs. Time Graph
Since the cooling rate of beaker B is slower than that of beaker A, the temperature of liquid A will decrease faster than that of liquid B. Therefore, the temperature vs. time graph will show:
- Beaker A will have a steeper slope (cooling faster),
- Beaker B will have a gentler slope (cooling slower).
Conclusion
The best schematic representation of the temperature versus time graph will show the temperature of liquid A decreasing faster than that of liquid B.
The mass of the liquid in each beaker can be calculated using the formula:
Mass(m)=Density(ρ)×Volume(V)
mA=ρA×V=(800kg/m3)×V
mB=ρB×V=(1000kg/m3)×V
The specific heat capacities of the liquids are given as:
- For liquid A: cA=2000J/kg/K
- For liquid B: cB=4000J/kg/K
The heat capacity C is calculated as:
C=m×c
CA=mA×cA=(800V)×(2000)=1600000VJ/K
CB=mB×cB=(1000V)×(4000)=4000000VJ/K
From the calculations:
- CA=1600000V
- CB=4000000V
According to Newton's law of cooling, the rate of change of temperature is given by:
dθdt=−k(T−T0)C
- T is the temperature of the liquid,
- T0 is the surrounding temperature,
- k is a constant.
Since the cooling rate of beaker B is slower than that of beaker A, the temperature of liquid A will decrease faster than that of liquid B. Therefore, the temperature vs. time graph will show:
- Beaker A will have a steeper slope (cooling faster),
- Beaker B will have a gentler slope (cooling slower).
The best schematic representation of the temperature versus time graph will show the temperature of liquid A decreasing faster than that of liquid B.
Similar Questions
Knowledge Check
A body A of mass 0.5kg and specific heat 0.85Jg−1K−1 is at a temperature of 60∘C. Another body B of mass 0.3kg and specific heat 0.9Jg−1K−10 is at a temperature of 90∘C. When they are connected through a conducting rod, heat will flow from
AA to BBB to ACheat can't flowDfirst from A to B, then B to A
200g of water and a equal volume of another liquid of mass 250g are placed in turn in the same calorimeter of mass 100g and specific heat capacity 420Jkg−1K−1. The liquids which are constantly stirred are found to cool from 60∘C and 20∘C in 180s and 140s respectively. Find the specific heat capacity of the liquid. The temperature of the surroundings =20∘C
View SolutionA steel ball of density 8.0×10³kg/m3 and radius 2 mm is observed to fall with a terminal velocity 1.0×10⁻²m/s in a liquid of density 1.8×10³kg/m3 . Calculate the viscosity of the liquid.
View SolutionThe difference between two specific heats of a gas is 5000Jkg−1K−1and the ratio of specific heats is 1.6. Find the two specific heats.
View SolutionA calorimeter has mass 100 g and specific heat 0.1 kcal/kg.∘C. It contains 250 g of liquid at 30∘C having specific heat of 0.4 kcal/ kg.∘C . If we drop a piece of ice of mass 10 g at 0∘c into it , what will be the temperature of the mixture ?
View Solution500 kg of water is heated from 20∘ to 100∘ C . Calculate the increase in the mass of water.Given specific heat of water =4.2×10³Jkg−1.∘C−1.
View SolutionWhat will be the result of mixing 2kg of cooper at 100∘C with 0.75 kg of ice at 0∘C (Specific heat capacity of cooper =378Jkg−1K−1 specific heat capacity of water =4200Jkg−1K−1 and specific latent heat of fusion of ice =336×103Jkg−1)
View Solution400 kg of water is heated from 30∘C to 100∘C . What will be the increase in mass of water ? Take specific heat of wateer =4.2×10³ J kg−1.∘C−1 .
View Solution
