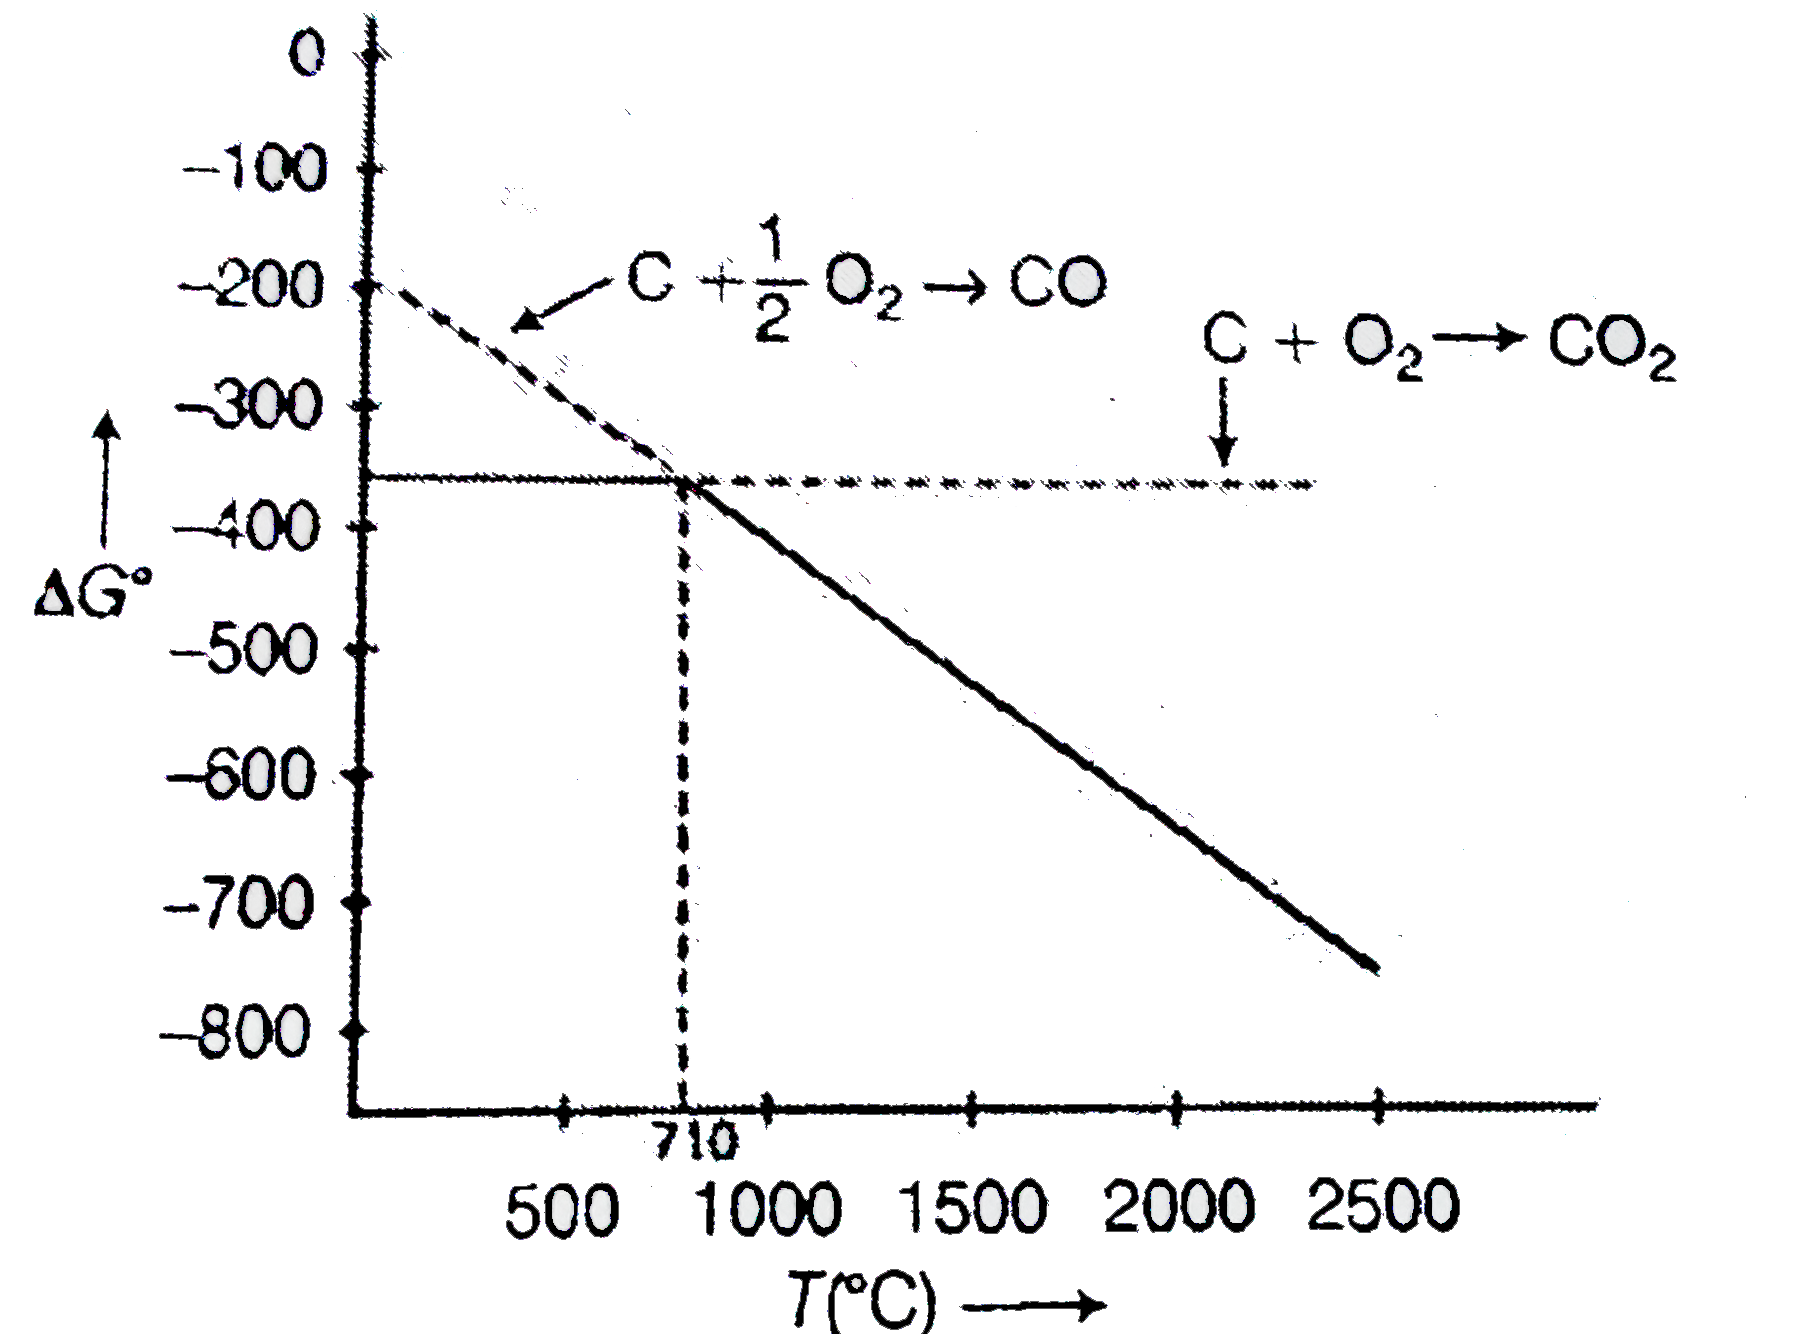
Ellingham diagram represents :
A
change of △G with temperature
B
change of △H with temperatrue
C
change of △G with pressure
D
change of (△G−T△S) with temperature
Text Solution
The correct Answer is:A
Ellingham diagram represents change in value of ΔG with temperature (in K).
|
Similar Questions
Knowledge Check
Ellingham diagram respresents:
Achange of ΔG with temperature.Bchange of ΔH with temperature.Cchange of ΔG with pressure.Dchange of (ΔG−TΔS) with temperature.The statement that is INCORRECT about Ellingham diagram is
Aprovides idea about the reaction rate.Bprovides idea about free energy changeCprovides idea about changes in the phases during the reaction.Dprovides idea about reduction of metal oxide.Consider the following Ellingham diagram for carbon

Which of the following statements is incorrect for the above Ellingham diagramAUpto 710∘C, the reaction of formation of CO2 is energetically more favourable but above 710∘C, the formation of CO is preferredBCarbon can be used to reduce any metal oxide at a sufficiently high temperatureCCarbon reduces many oxides at elevated temperature because ΔG∘ vs temperature line has a negative slopeDΔS∘[C(s)+12O2(g)→CO(g)]
<ΔS∘[C(s)+O2(g)→CO(g)]
With respect to an ore, Ellingham diagram helps to predict the feasiblity of its
View SolutionThe incorrect statement for Ellingham diagram is
View SolutionThe incorrect statement for Ellingham diagram is
View SolutionIn the Ellingham diagram , graph for the formation of CO2__________.
View SolutionIn Ellingham diagram, the slope of the curve of the formation metal oxide:
View Solution
