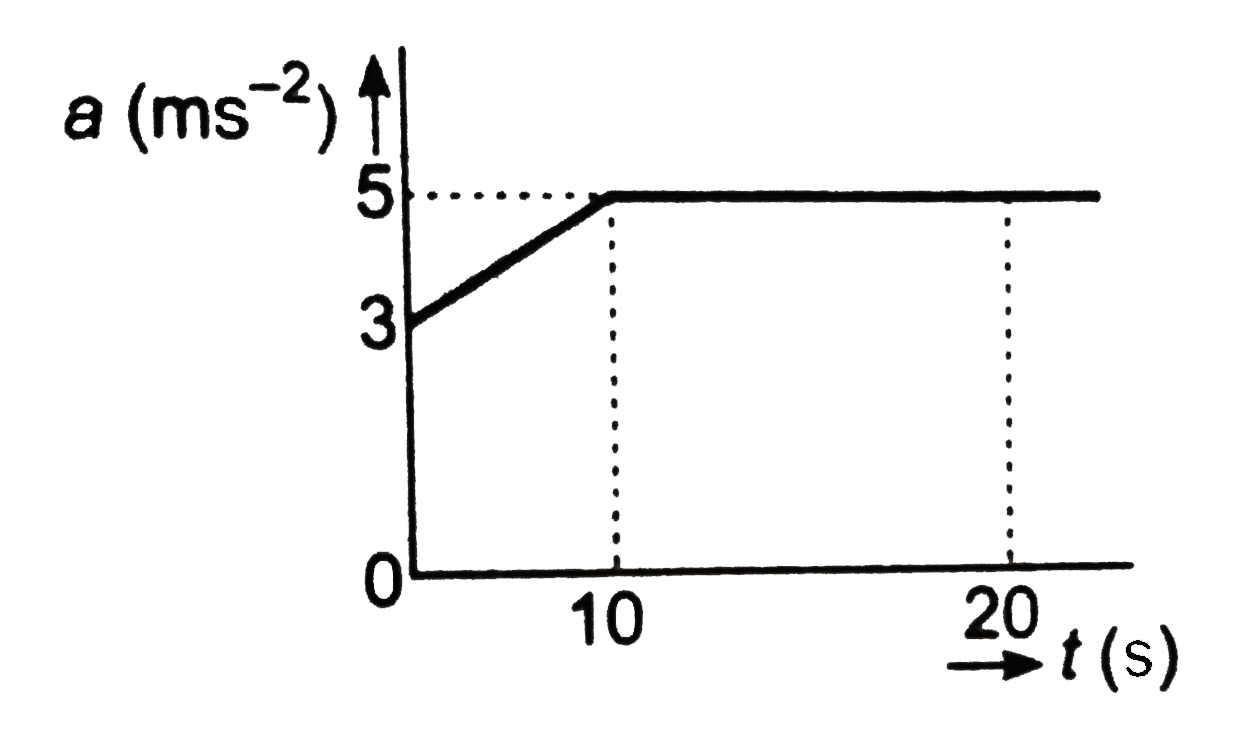
The graph describes an airplane's acceleration during its take-off run. The airplane's velocity when it lifts oof at t=20s is

40m/s
50m/s
90m/s
180m/s
The correct Answer is:C
Area under a-T graph = Change in velocity
Topper's Solved these Questions
- FORCE AND NEWTONS LAWS OF MOTIONBOOK - GRB PUBLICATIONCHAPTER - FORCE AND NEWTONS LAWS OF MOTIONEXERCISE - More than one choice is correct
15 Videos
- FORCE AND NEWTONS LAWS OF MOTIONBOOK - GRB PUBLICATIONCHAPTER - FORCE AND NEWTONS LAWS OF MOTIONEXERCISE - Assertion- Reason
4 Videos
- FORCE AND NEWTONS LAWS OF MOTIONBOOK - GRB PUBLICATIONCHAPTER - FORCE AND NEWTONS LAWS OF MOTIONEXERCISE - Problem for practice
30 Videos
- BASIC MATHEMATICSBOOK - GRB PUBLICATIONCHAPTER - BASIC MATHEMATICSEXERCISE - Problems For Practice
35 Videos
- FRICTION AND CIRCULAR MOTION BOOK - GRB PUBLICATIONCHAPTER - FRICTION AND CIRCULAR MOTION EXERCISE - Comprehension type
11 Videos
Similar Questions
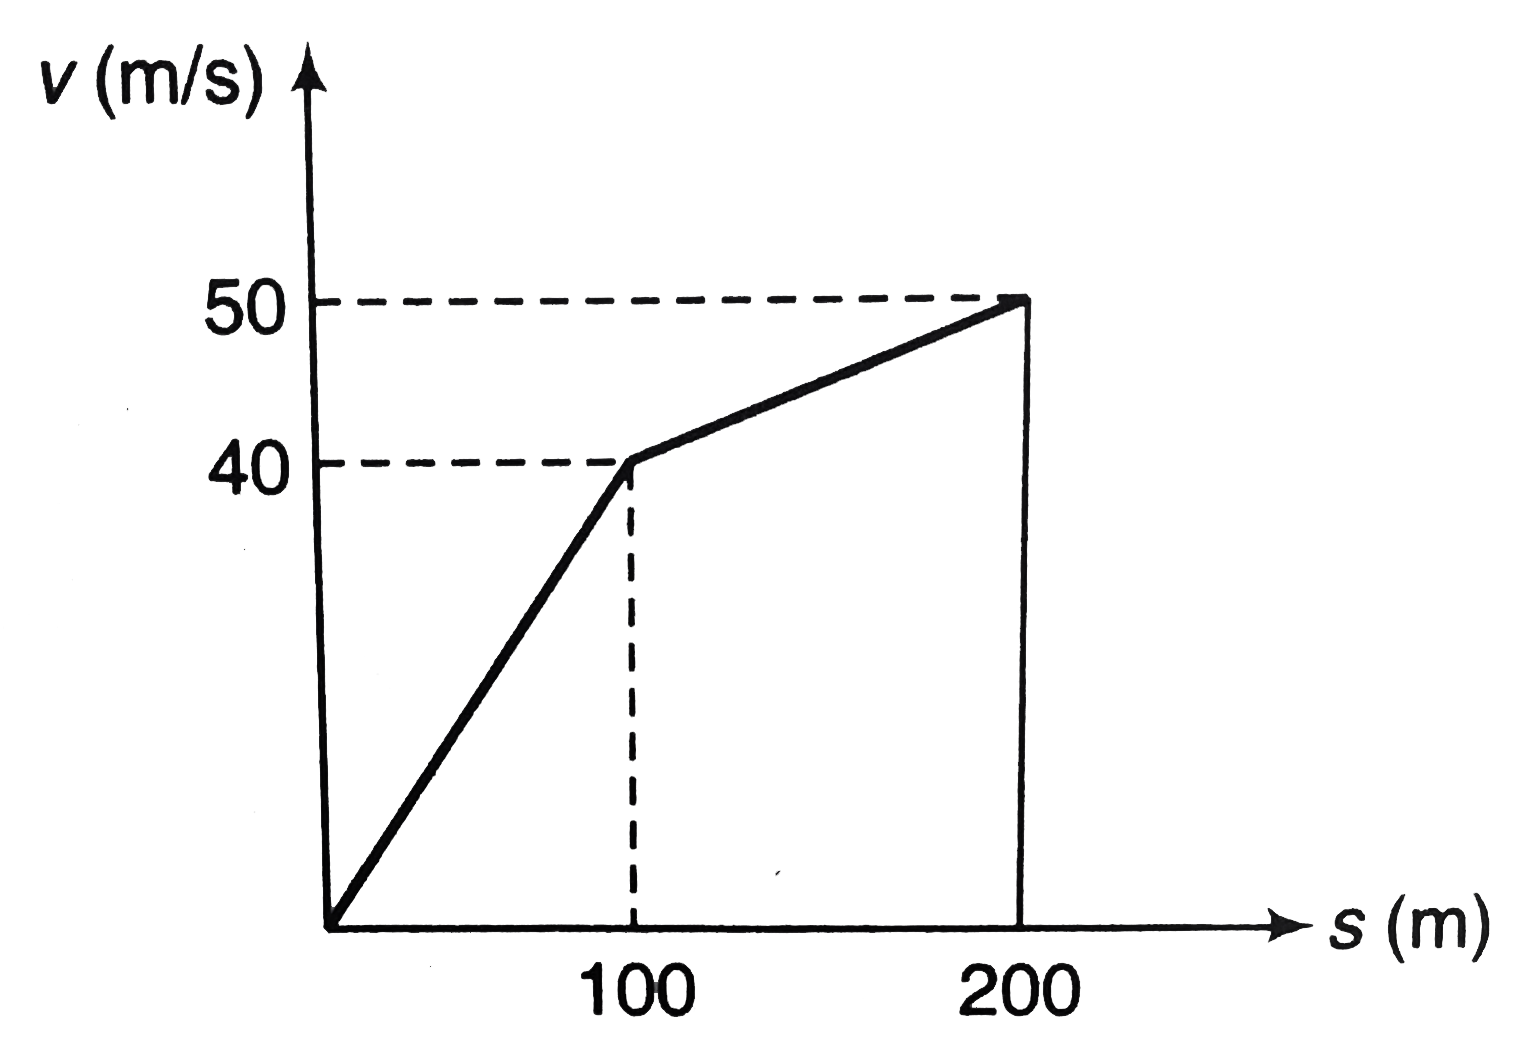
The v-s graph for an airplane travelling on a straight runway is shown. Determine the acceleration of the plane at s=50m and s=150m. Draw the a-s graph.

View SolutionHelicopters are very different from airplanes. They can do three things that airplanes cannot do. First, when airplanes move upward, they must also move forward, but helicopters can move straight up without moving ahead. Second, helicopters can fly backward, which airplanes cannot do. Third, helicopters can use their rotors to hover in the air, which is impossible for airplanes. Helicopters can perform actions that airplanes cannot, they are used for different tasks. Since, helicopters can take off without moving forward, they do not need a runway for take off. They are used in congested areas where there is no room for airplanes or in isolated areas, which do not have airports. Because they can hover, they are used on firefighting missions to drop water on fires. They are used in logging operations to lift trees out of forests. Helicopters are used as air ambulances to airlift patients out of situations, which are difficult to reach by conventional ambulances. The police used helicopters to follow suspects on the ground or to search for cars on the ground. Of course, helicopters have military uses because of their design and capabilities.
A helicopter can hover while an airplane cannot, according to the passage. Hover' in the passage means:
View Solution
Knowledge Check
The graph describes an airplane's acceleration during its take-off run. The airplane's velocity when it lifts of at t=20s is
 A40ms−1B50ms−1C90ms−1D180ms−1
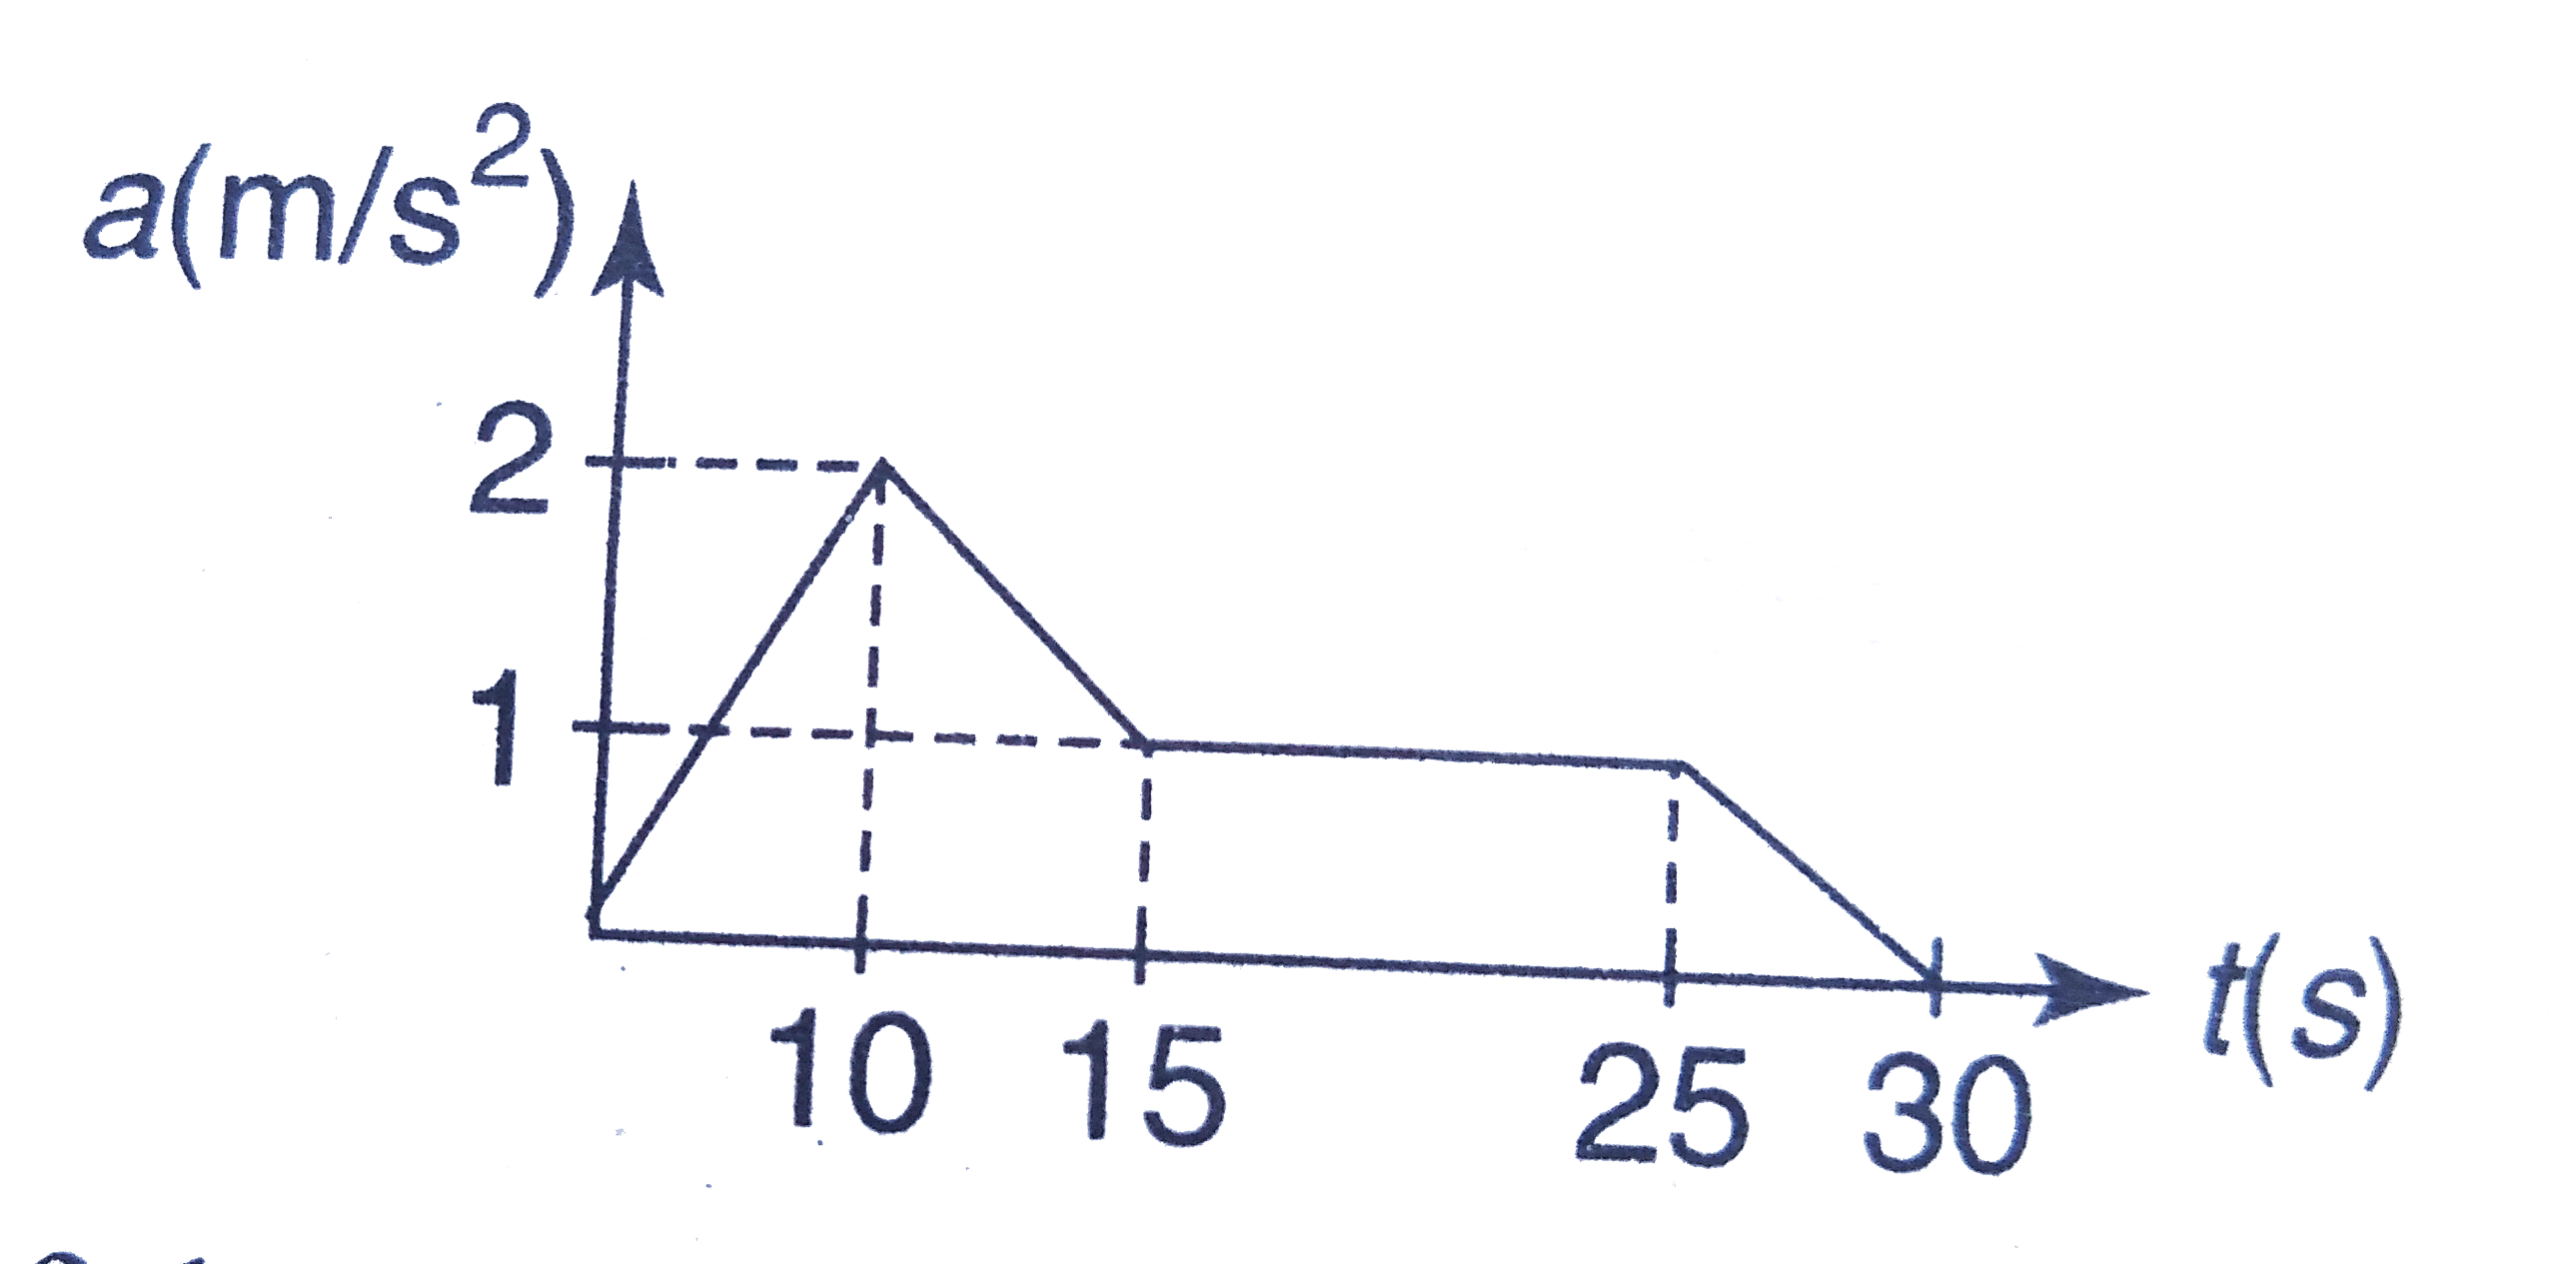
In figure shown, the graph shows the variation of acceleration of body with time t. The velcocity of the body at t=0 is zero. The velocity of the body at t=30s is.
 A30m/sB20m/sC40m/sDnone
In a linear S.H.M., the acceleration of the particle is zero, when its velocity is
AZeroBMaximumCHalf of its maximum valueDMinimum
given passage carefully and answer the questions that follow by selecting the most appropriate option. Helicopters are very different from airplanes. They can do three things that airplanes cannot do. First, when airplanes move upward, they must also move forward, but helicopters can move straight up without moving ahead. Second, helicopters can fly backward, which airplanes cannot do. Third, helicopters can use their rotors to hover in the air, which is impossible for airplanes. Helicopters can perform actions that airplanes cannot, they are used for different tasks. Since, helicopters can take off without moving forward, they do not need a runway for take off. They are used in congested areas where there is no room for airplanes or in isolated areas, which do not have airports. Because they can hover, they are used on firefighting missions to drop water on fires. They are used in logging operations to lift trees out of forests. Helicopters are used as air ambulances to airlift patients out of situations, which are difficult to reach by conventional ambulances. The police used helicopters to follows suspects on the ground or to search for cars on the ground. Of course, helicopters have military uses because of their design and capabilities.
The word 'congested in the passage means
View Solutiongiven passage carefully and answer the questions that follow by selecting the most appropriate option. Helicopters are very different from airplanes. They can do three things that airplanes cannot do. First, when airplanes move upward, they must also move forward, but helicopters can move straight up without moving ahead. Second, helicopters can fly backward, which airplanes cannot do. Third, helicopters can use their rotors to hover in the air, which is impossible for airplanes. Helicopters can perform actions that airplanes cannot, they are used for different tasks. Since, helicopters can take off without moving forward, they do not need a runway for take off. They are used in congested areas where there is no room for airplanes or in isolated areas, which do not have airports. Because they can hover, they are used on firefighting missions to drop water on fires. They are used in logging operations to lift trees out of forests. Helicopters are used as air ambulances to airlift patients out of situations, which are difficult to reach by conventional ambulances. The police used helicopters to follows suspects on the ground or to search for cars on the ground. Of course, helicopters have military uses because of their design and capabilities.
A helicopter can hover while an एयरप्लेन cannot, according to the passage. 'Hover' in the passage means
View Solutiongiven passage carefully and answer the questions that follow by selecting the most appropriate option. Helicopters are very different from airplanes. They can do three things that airplanes cannot do. First, when airplanes move upward, they must also move forward, but helicopters can move straight up without moving ahead. Second, helicopters can fly backward, which airplanes cannot do. Third, helicopters can use their rotors to hover in the air, which is impossible for airplanes. Helicopters can perform actions that airplanes cannot, they are used for different tasks. Since, helicopters can take off without moving forward, they do not need a runway for take off. They are used in congested areas where there is no room for airplanes or in isolated areas, which do not have airports. Because they can hover, they are used on firefighting missions to drop water on fires. They are used in logging operations to lift trees out of forests. Helicopters are used as air ambulances to airlift patients out of situations, which are difficult to reach by conventional ambulances. The police used helicopters to follows suspects on the ground or to search for cars on the ground. Of course, helicopters have military uses because of their design and capabilities.
Point out the grammatical category of थे word 'perform' in the passage.
View Solutiongiven passage carefully and answer the questions that follow by selecting the most appropriate option. Helicopters are very different from airplanes. They can do three things that airplanes cannot do. First, when airplanes move upward, they must also move forward, but helicopters can move straight up without moving ahead. Second, helicopters can fly backward, which airplanes cannot do. Third, helicopters can use their rotors to hover in the air, which is impossible for airplanes. Helicopters can perform actions that airplanes cannot, they are used for different tasks. Since, helicopters can take off without moving forward, they do not need a runway for take off. They are used in congested areas where there is no room for airplanes or in isolated areas, which do not have airports. Because they can hover, they are used on firefighting missions to drop water on fires. They are used in logging operations to lift trees out of forests. Helicopters are used as air ambulances to airlift patients out of situations, which are difficult to reach by conventional ambulances. The police used helicopters to follows suspects on the ground or to search for cars on the ground. Of course, helicopters have military uses because of their design and capabilities.
Why is a helicopter used as an ambulance?
View Solutiongiven passage carefully and answer the questions that follow by selecting the most appropriate option. Helicopters are very different from airplanes. They can do three things that airplanes cannot do. First, when airplanes move upward, they must also move forward, but helicopters can move straight up without moving ahead. Second, helicopters can fly backward, which airplanes cannot do. Third, helicopters can use their rotors to hover in the air, which is impossible for airplanes. Helicopters can perform actions that airplanes cannot, they are used for different tasks. Since, helicopters can take off without moving forward, they do not need a runway for take off. They are used in congested areas where there is no room for airplanes or in isolated areas, which do not have airports. Because they can hover, they are used on firefighting missions to drop water on fires. They are used in logging operations to lift trees out of forests. Helicopters are used as air ambulances to airlift patients out of situations, which are difficult to reach by conventional ambulances. The police used helicopters to follows suspects on the ground or to search for cars on the ground. Of course, helicopters have military uses because of their design and capabilities.
Point out the grammatical category of the word 'very in the passage.
View Solution
