Two containers of sand S and H are arranged like the blocks figure (a) The container alone have negligible mass, the sand in them has a total mass Mtot , the sand in the hanging container H has mass m. You are to measure the magnitude a of the acceleration of the system in a series of experiments where m varies from experiment to experiment by Mtot does not, that is, you will shift sand between the containers before each trial mMtot is taken on the horizontal axis for all the plots.
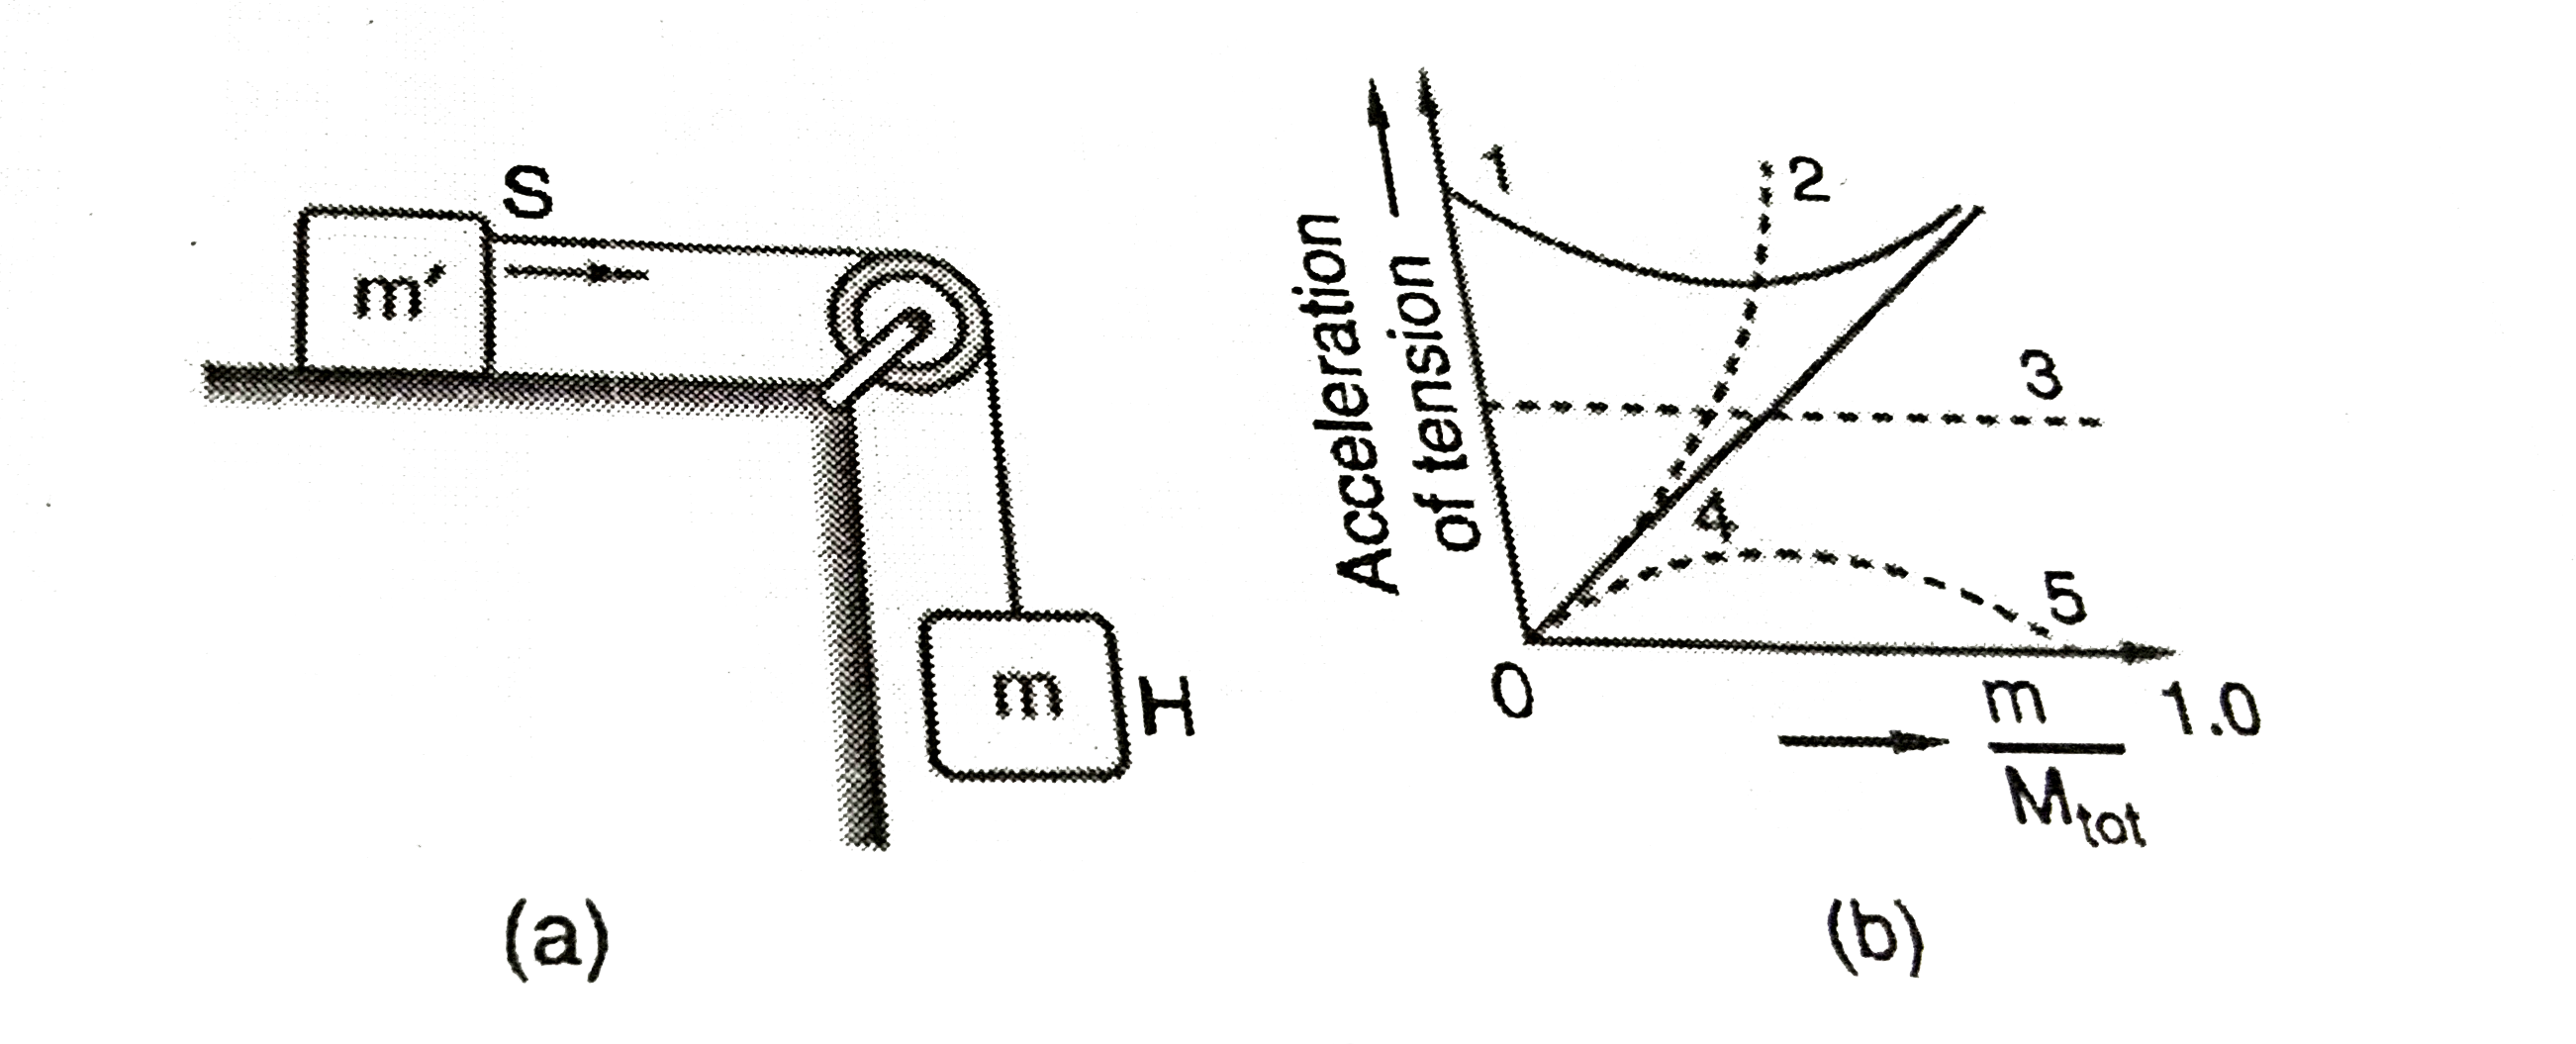
The curve which gives tension in the connecting string (taken on y-axis) as a function of ratio (mMtot) is:
1
2
4
5
The correct Answer is:D
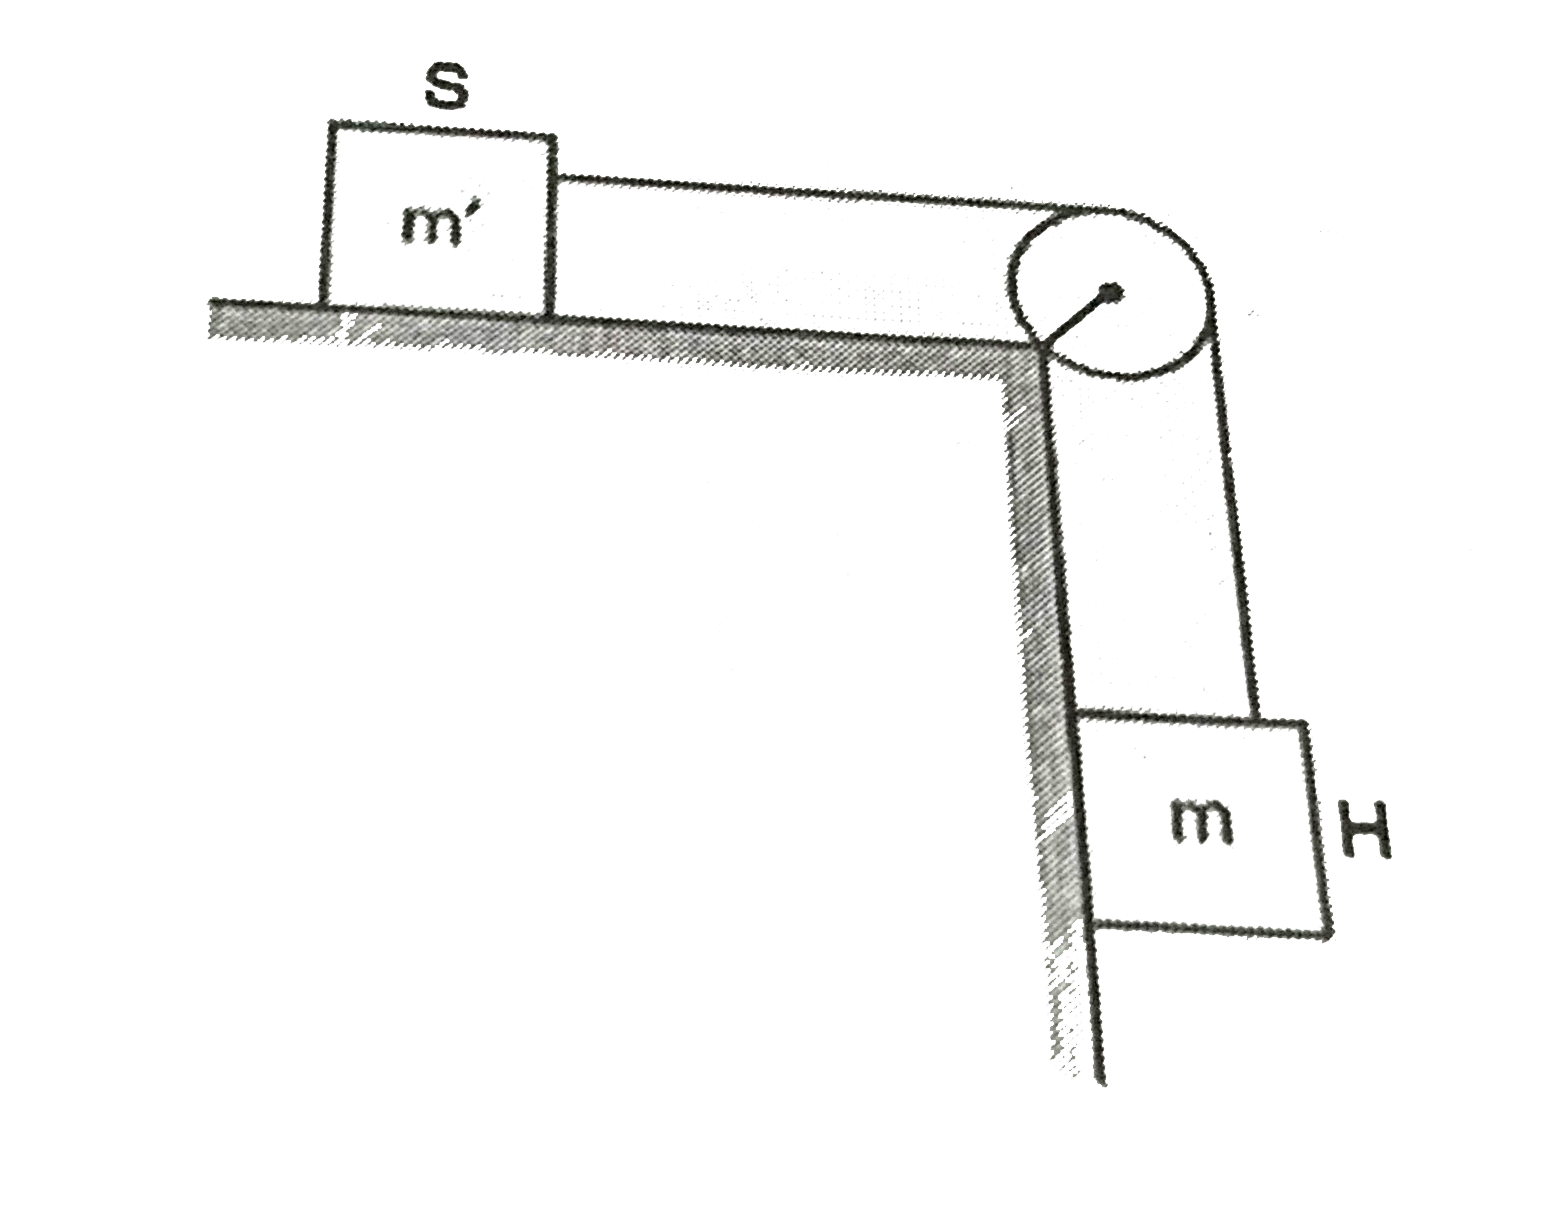
mg−T=ma …(i)
T−m'g=m'a ….(ii)
Adding (i) and (ii)
g(m−m')=a(m+m')
g(m−m')=Mtotal+a
As m+m'=Mtotal
So, m'=(Mtotal−m)
Topper's Solved these Questions
- FORCE AND NEWTONS LAWS OF MOTIONBook:GRB PUBLICATIONChapter:FORCE AND NEWTONS LAWS OF MOTIONExercise:Integer question
Explore 15 Videos
- BASIC MATHEMATICSBook:GRB PUBLICATIONChapter:BASIC MATHEMATICSExercise:Problems For Practice
Explore 35 Videos
- FRICTION AND CIRCULAR MOTION Book:GRB PUBLICATIONChapter:FRICTION AND CIRCULAR MOTION Exercise:Comprehension type
Explore 11 Videos
Similar Questions
Two containers of sand are arranged like the block as shown in fig. the containers alone have negligible mass, the sand in them has a total mass Mtot , the sand in the hanging container H hs mass m.
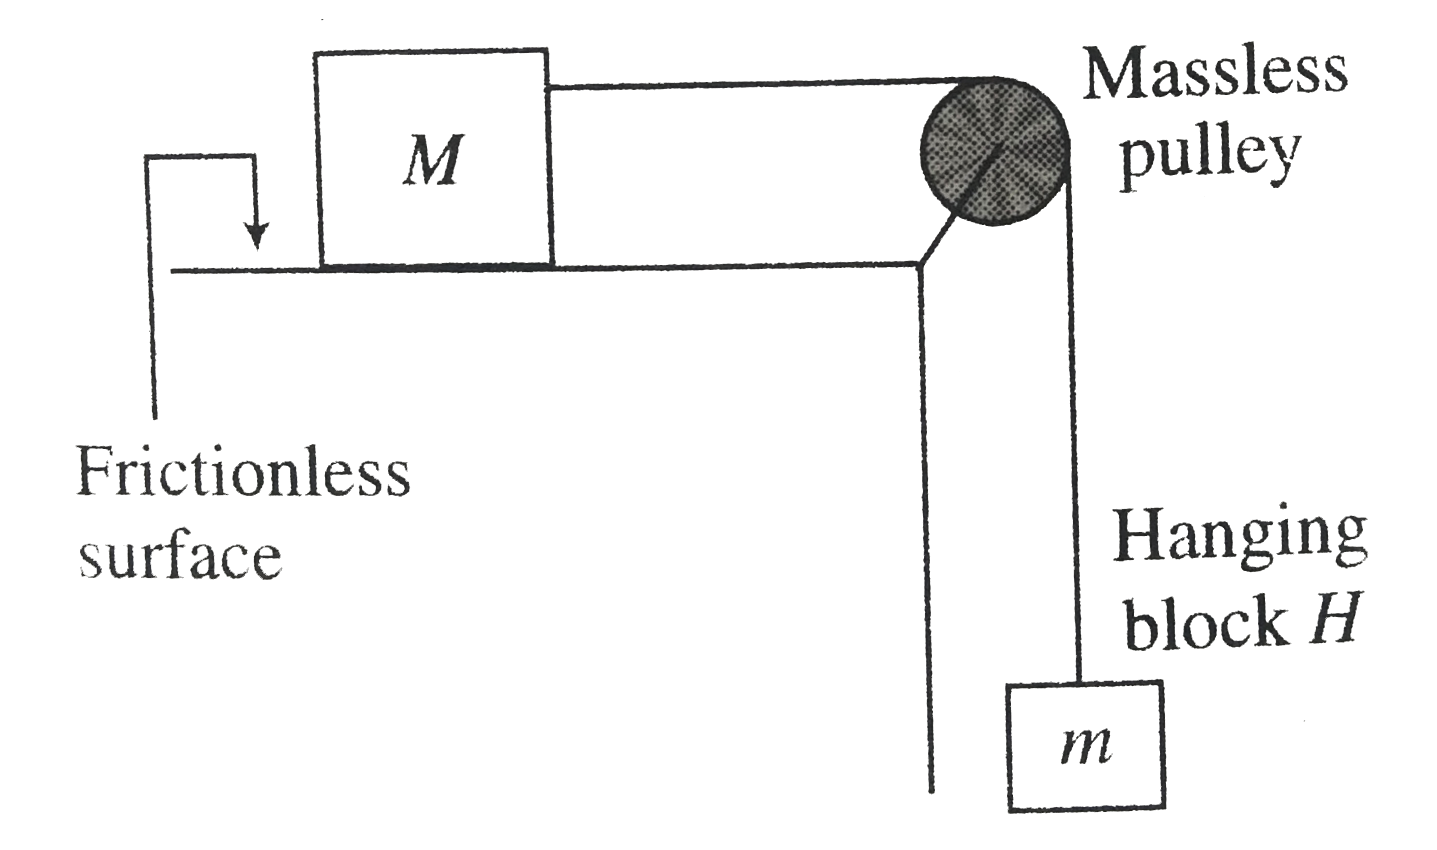
To measure the magnitude a of the acceleration of the system, a large number of experiments carried out where m varies from experiment to experiment but Mtot does not, that is, sand in shifted between the containers before each trial .
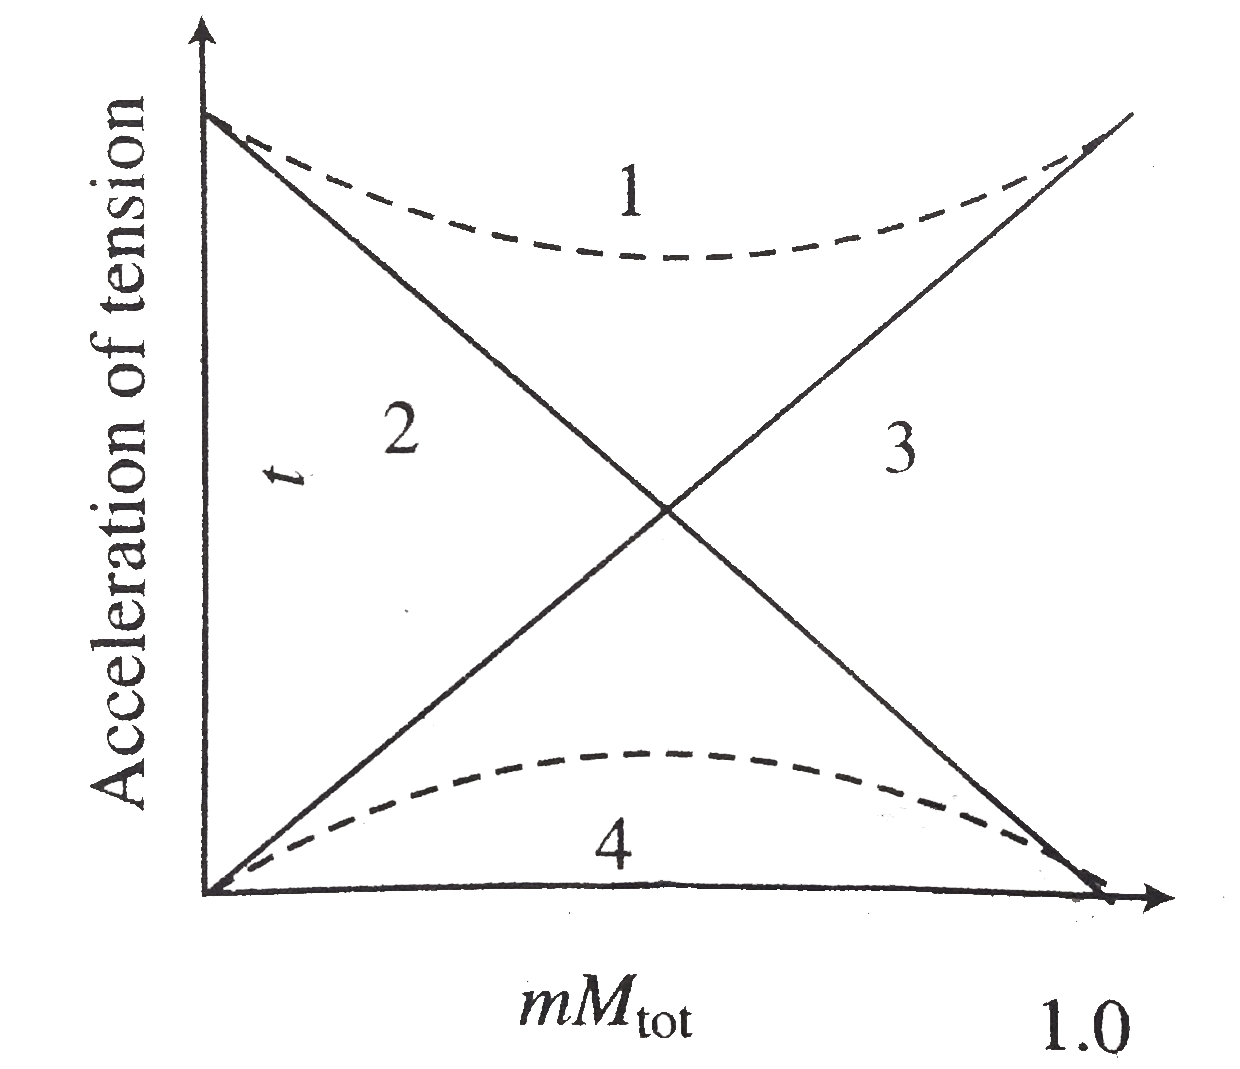
Which of them gives the tension in the connecting cord (vertical axis is for tension) ?
View SolutionTwo containers of sand are arranged like the block as shown in fig. the containers alone have negligible mass, the sand in them has a total mass Mtot , the sand in the hanging container H hs mass m.
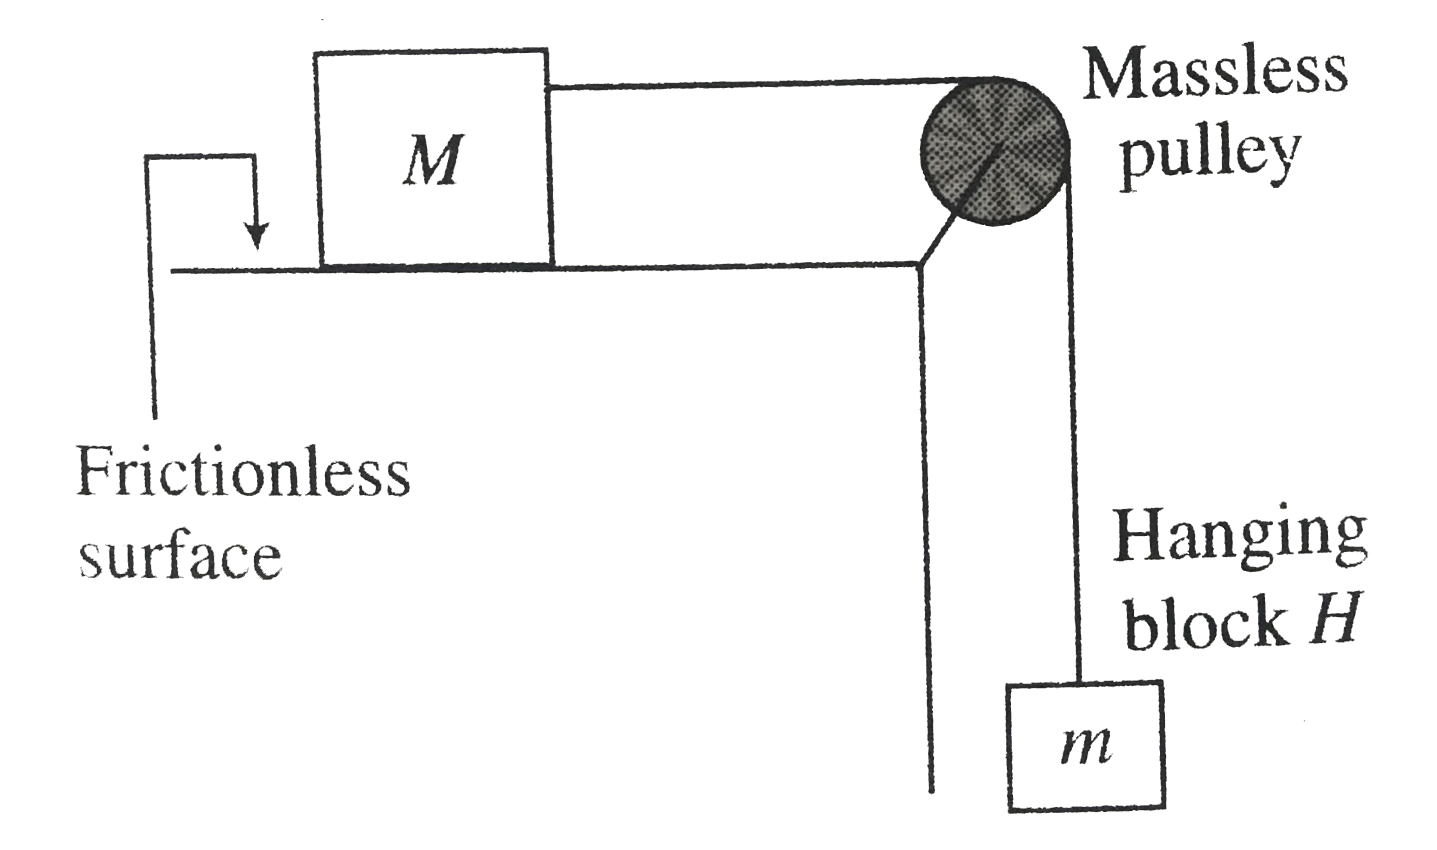
To measure the magnitude a of the acceleration of the system, a large number of experiments carried out where m varies from experiment to experiment but Mtot does not, that is, sand in shifted between the containers before each trial .
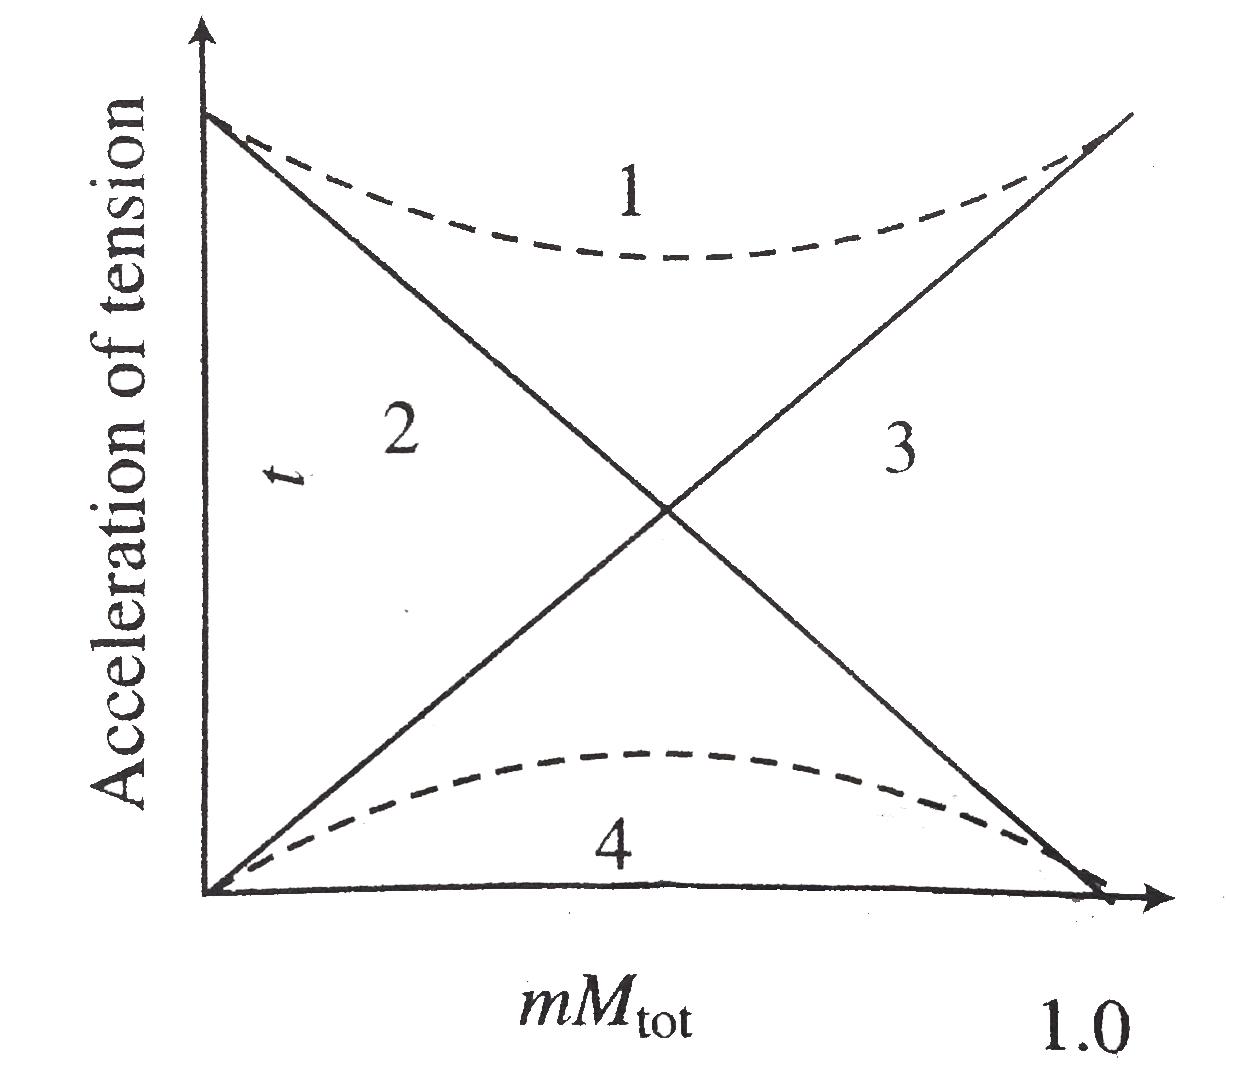
Which of the curves in graph correctly gives acceleration magnitude as a function of the ratio m/Mtot (vertical axis is for acceleration)?
View Solution
Knowledge Check
Two containers of sand are arranged like the block as shown in fig. the containers alone have negligible mass, the sand in them has a total mass Mtot , the sand in the hanging container H hs mass m.

To measure the magnitude a of the acceleration of the system, a large number of experiments carried out where m varies from experiment to experiment but Mtot does not, that is, sand in shifted between the containers before each trial .

Which of them gives the tension in the connecting cord (vertical axis is for tension) ?A1B2C3D4Two containers of sand are arranged like the block as shown in fig. the containers alone have negligible mass, the sand in them has a total mass Mtot , the sand in the hanging container H hs mass m.

To measure the magnitude a of the acceleration of the system, a large number of experiments carried out where m varies from experiment to experiment but Mtot does not, that is, sand in shifted between the containers before each trial .

Which of the curves in graph correctly gives acceleration magnitude as a function of the ratio m/Mtot (vertical axis is for acceleration)?A1B2C3D4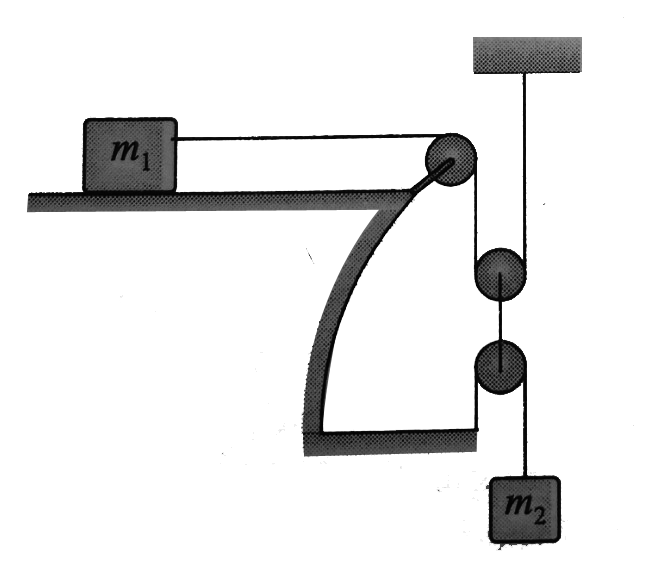
Two blocks of masses m1 and m2 are connected as shown in the figure. The acceleration of the block m2 is :Am2gm1+m2Bm1gm1+m2C4m2g−m1gm1+m2Dm2gm1+4m2
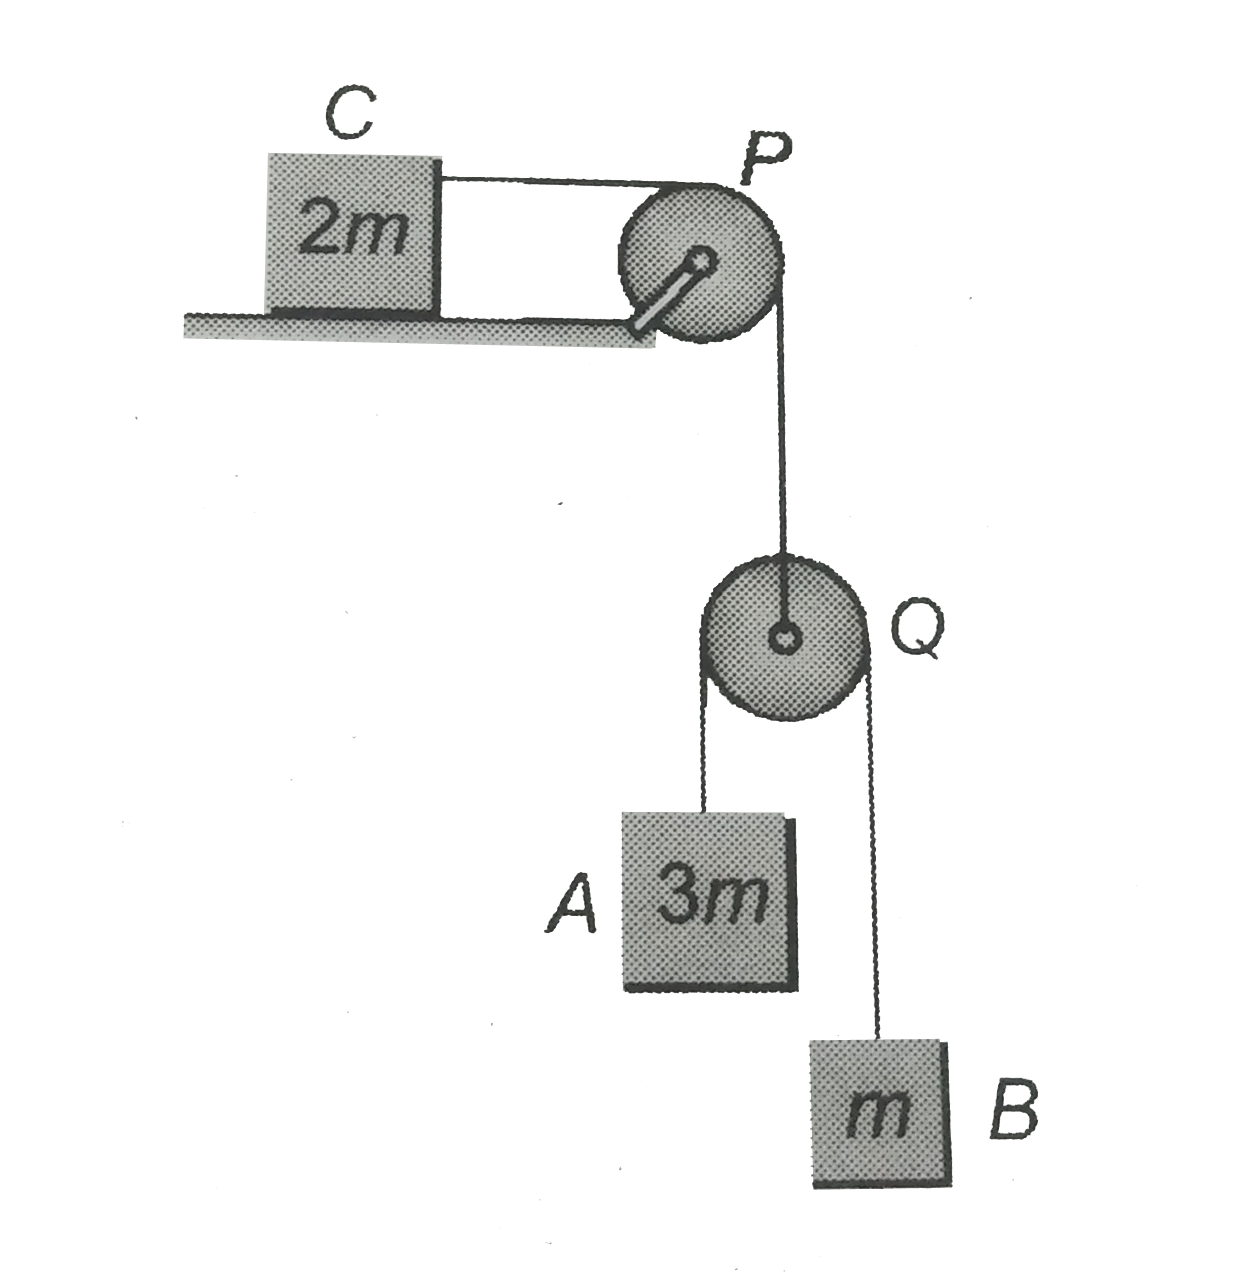
In the arrangement shown in the figure, the blocks have masses 3m,m and 2m, the friction is absent, the masses of the pulleys and the threads are negligible. Find the acceleration of mass 3m.
View Solution
Two blocks of masses m1 and m2 are connected as shown in the figure. The acceleration of the block m2 is :
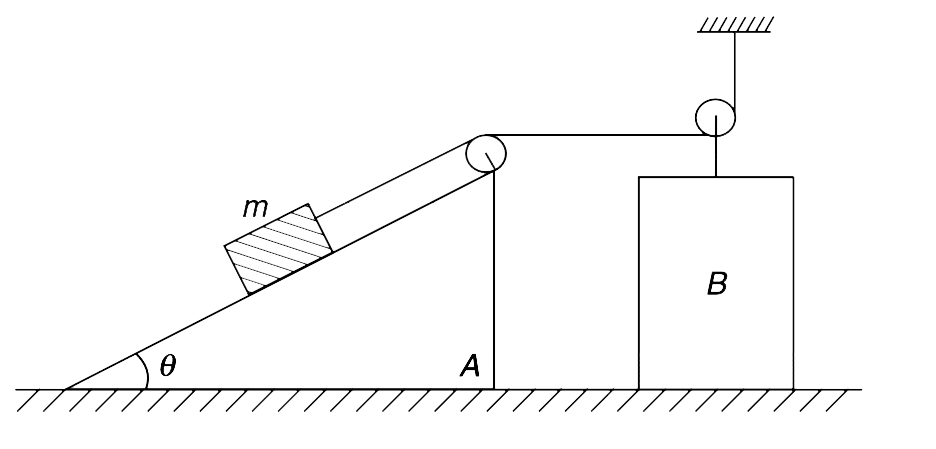
View SolutionIn the system shown in the figure all surfaces are smooth and both the pulleys are mass less. Block on the incline surface of wedge A has mass m. Mass of A and B are M = 4 m and M0=2 m respectively. Find the acceleration of wedge A when the system is released from rest.
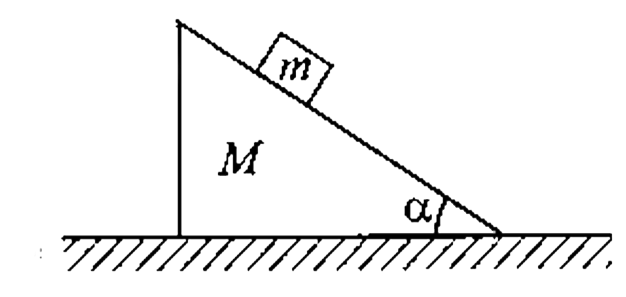
View SolutionFigure-2.54 shows a block of mass m is placed on an inclined wedge of mass M If the system is released from rest find the acceleration of m and M.
View SolutionIn the figure, blocks A and B of masses 2m and m are connected with a string and system is hanged vertically wioth the help of spring. Spring has negligible mass. Find out magnitude of acceleration of masses 2 m and m just after the instant when the string is cut
View Solution
