A graph between kinetic energy and momentum of a particle is plotted as shown in the figure. The mass of the moving particle is :
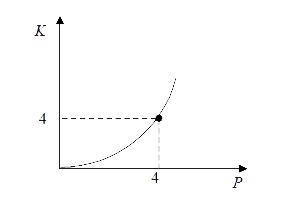
1 kg
2 kg
3 kg
4 kg
The correct Answer is:B
Step by step video & image solution for A graph between kinetic energy and momentum of a particle is plotted as shown in the figure. The mass of the moving particle is : by Physics experts to help you in doubts & scoring excellent marks in Class 12 exams.
Updated on:21/07/2023Topper's Solved these Questions
- CENTRE OF MASSBOOK - MOTIONCHAPTER - CENTRE OF MASSEXERCISE - Exercise - 2 (Level-I)
40 Videos
- CENTRE OF MASSBOOK - MOTIONCHAPTER - CENTRE OF MASSEXERCISE - Exercise - 2 (Level-II)
28 Videos
- CENTRE OF MASSBOOK - MOTIONCHAPTER - CENTRE OF MASSEXERCISE - Exercise - 4 Level-II
20 Videos
- Capacitance BOOK - MOTIONCHAPTER - Capacitance EXERCISE - EXERCISE -4 LEVEL II
19 Videos
- CIRCULAR MOTIONBOOK - MOTIONCHAPTER - CIRCULAR MOTIONEXERCISE - EXERCISE - 4
16 Videos
Similar Questions
Knowledge Check
The relation between kinetic energy K and linear momentum p of a particle is represented by
AK2=2mpB2K2=mpCp2=2mkD2mK=pThe relation between kinetic energy K and linear momentum p of a particle is represented by
AK2=2mpB2K2=mpCp2=2mKD2mK=pThe graph between kinetic energy and displacement of a particle performing S.H.M. is
AparabolaBstraight lineCellipseDcircle
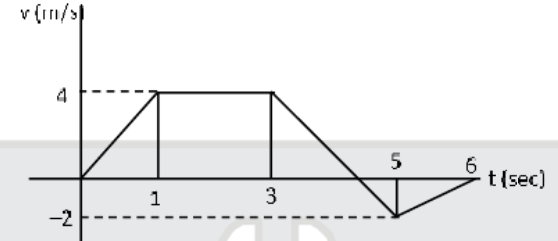
velocity time graph of a particle is shown in figure. Find displacement of the particle.
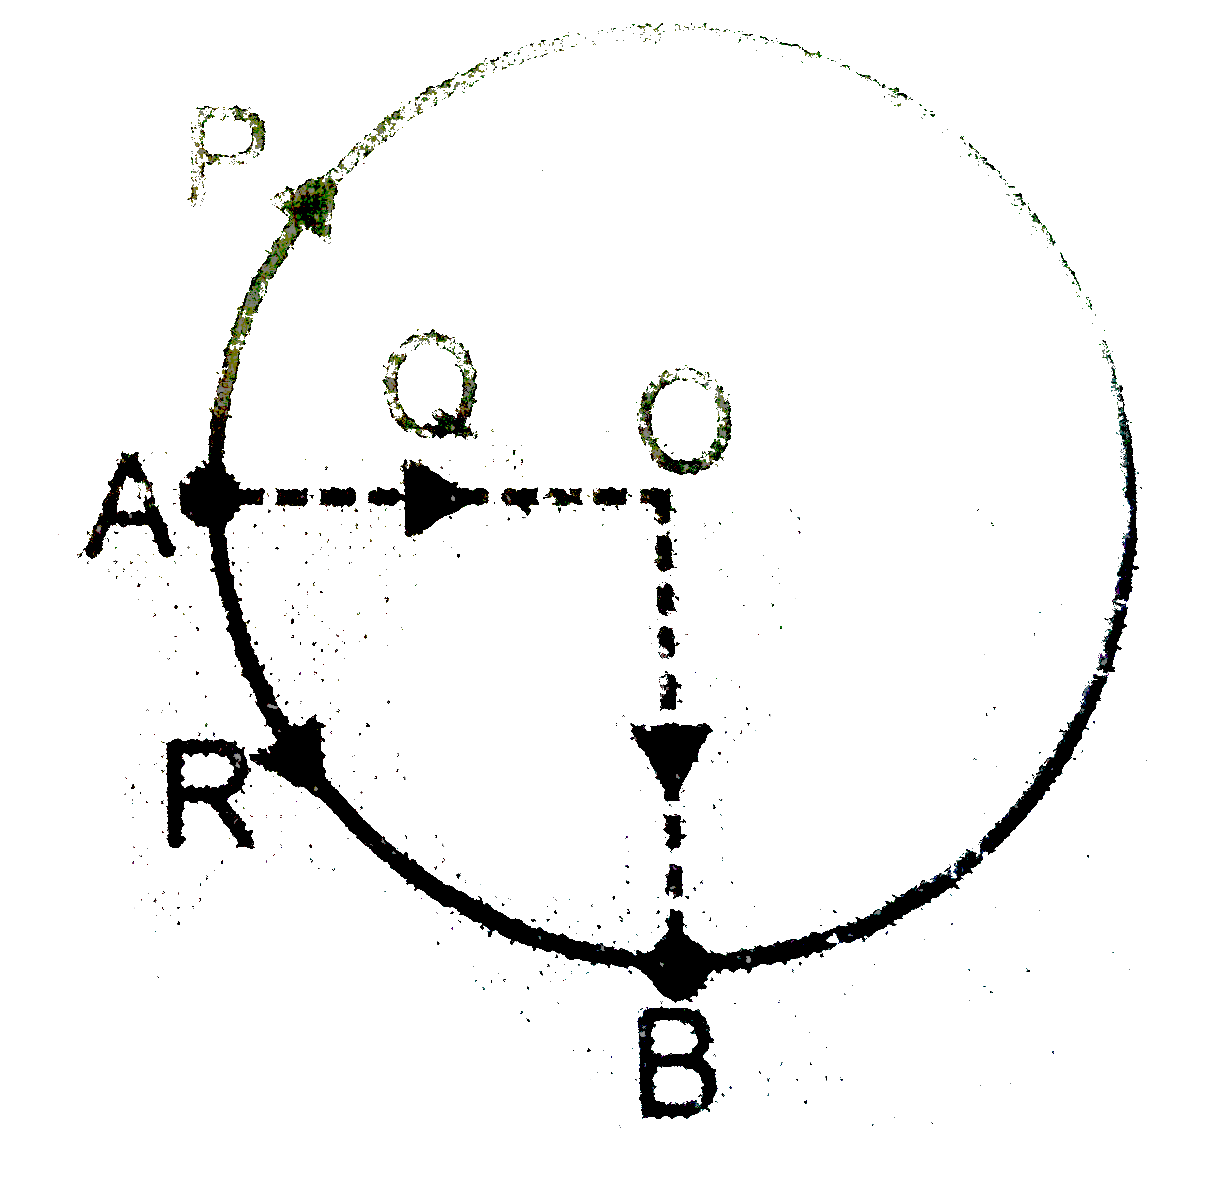
View SolutionA graph between the square of the velocity of a particle and the distance(s) moved is shown in figure. The acceleration of the particle in kilometers per hour square is:-
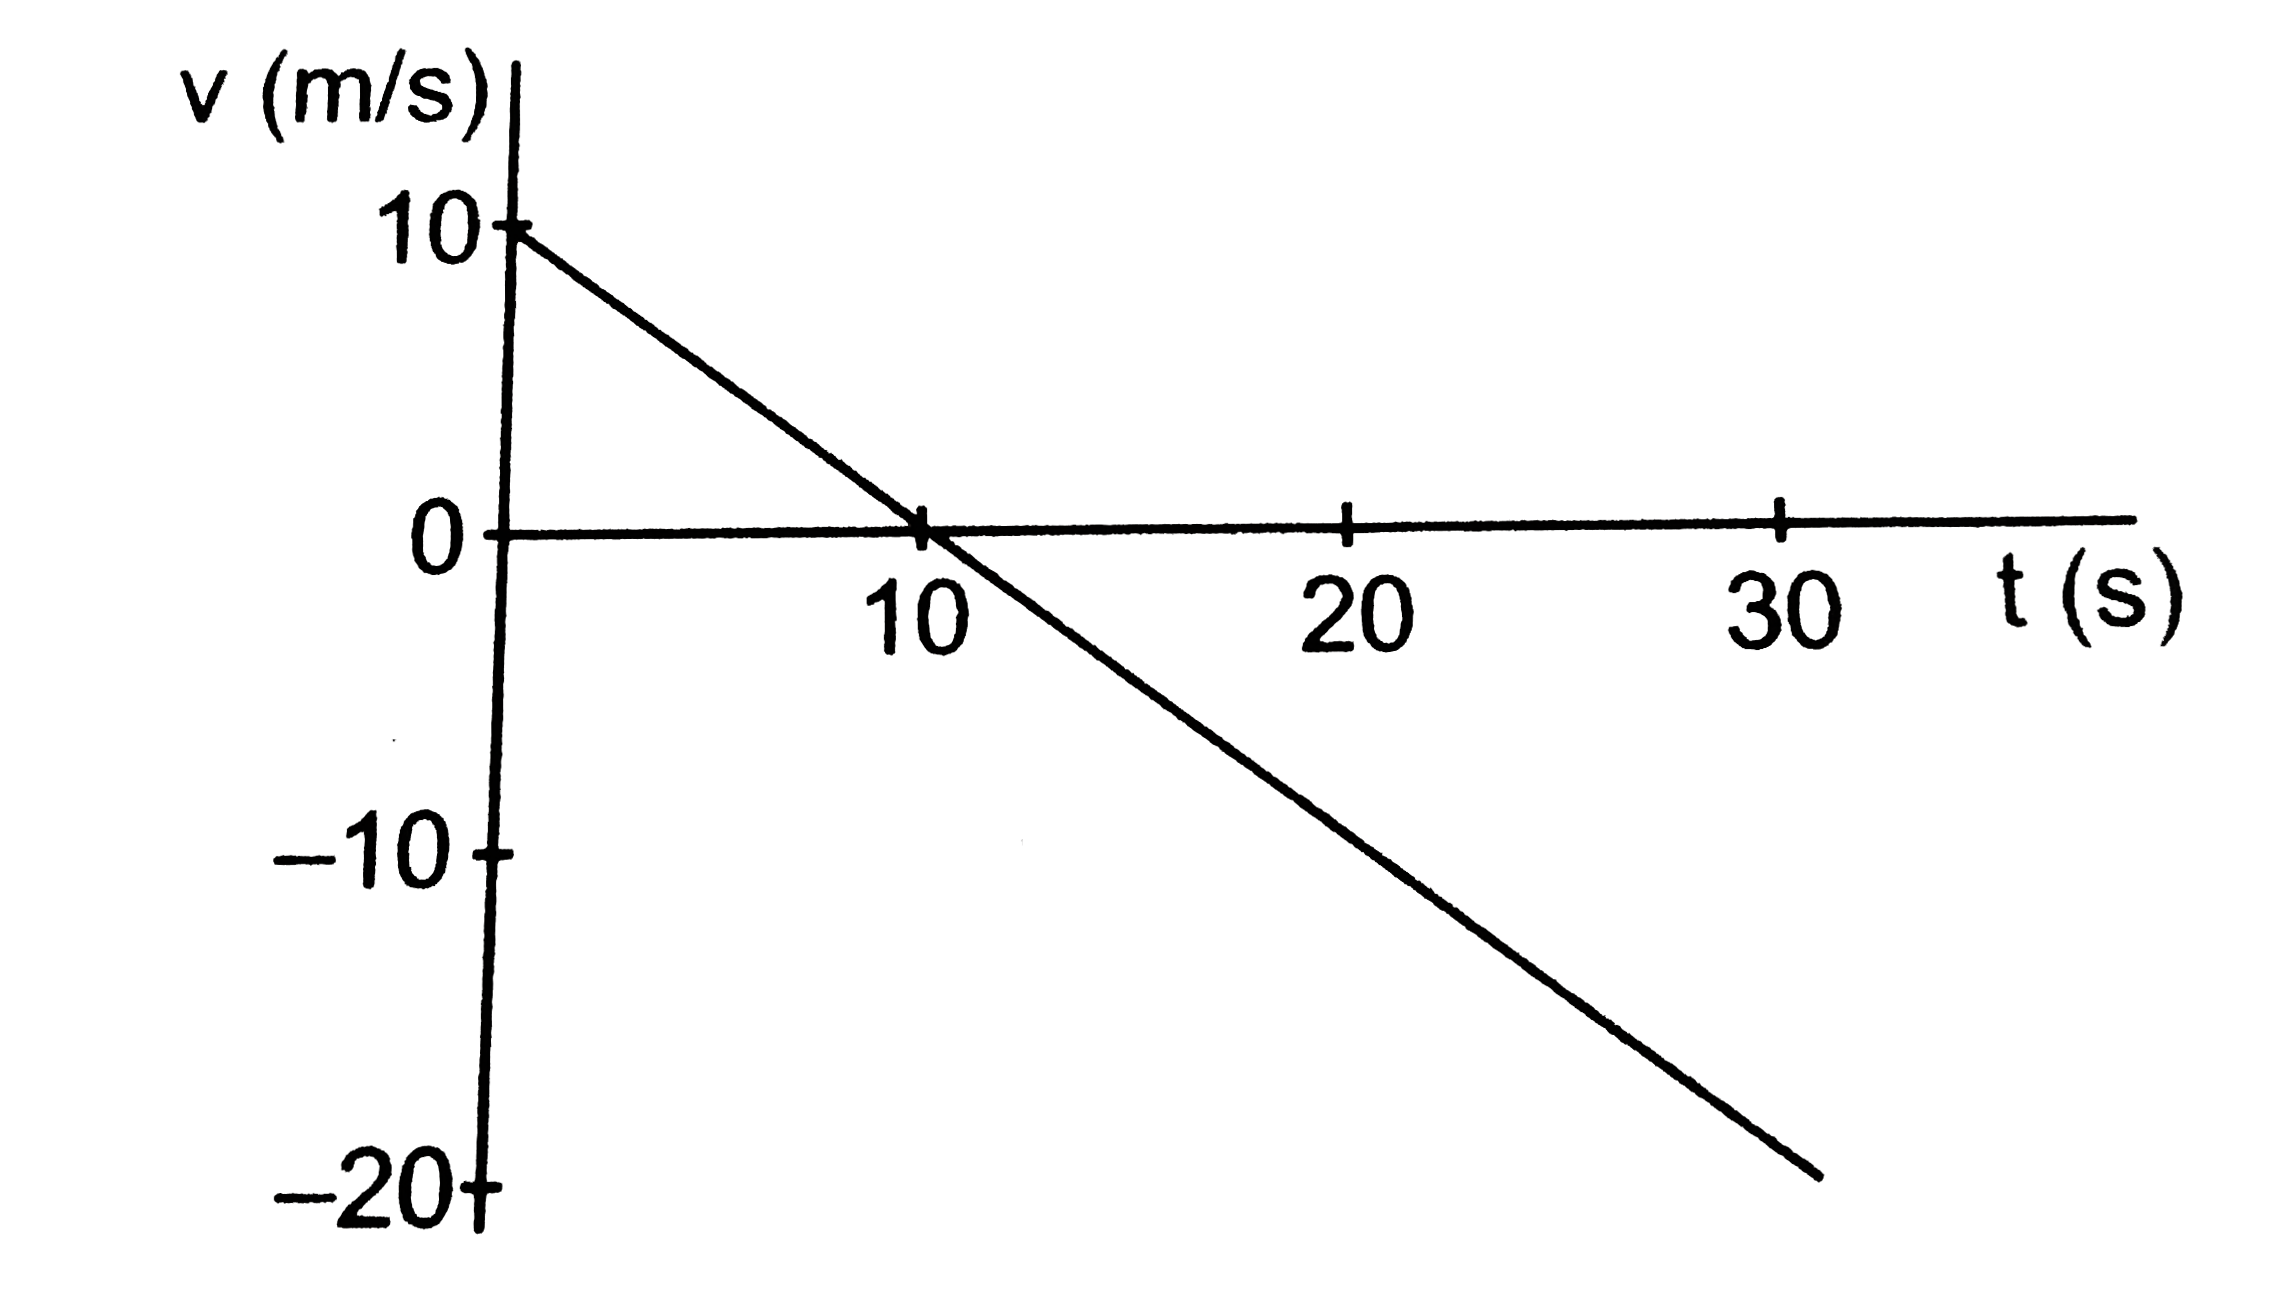
View SolutionThe velocity time plot for a particle moving on straight line is shown in the figure.
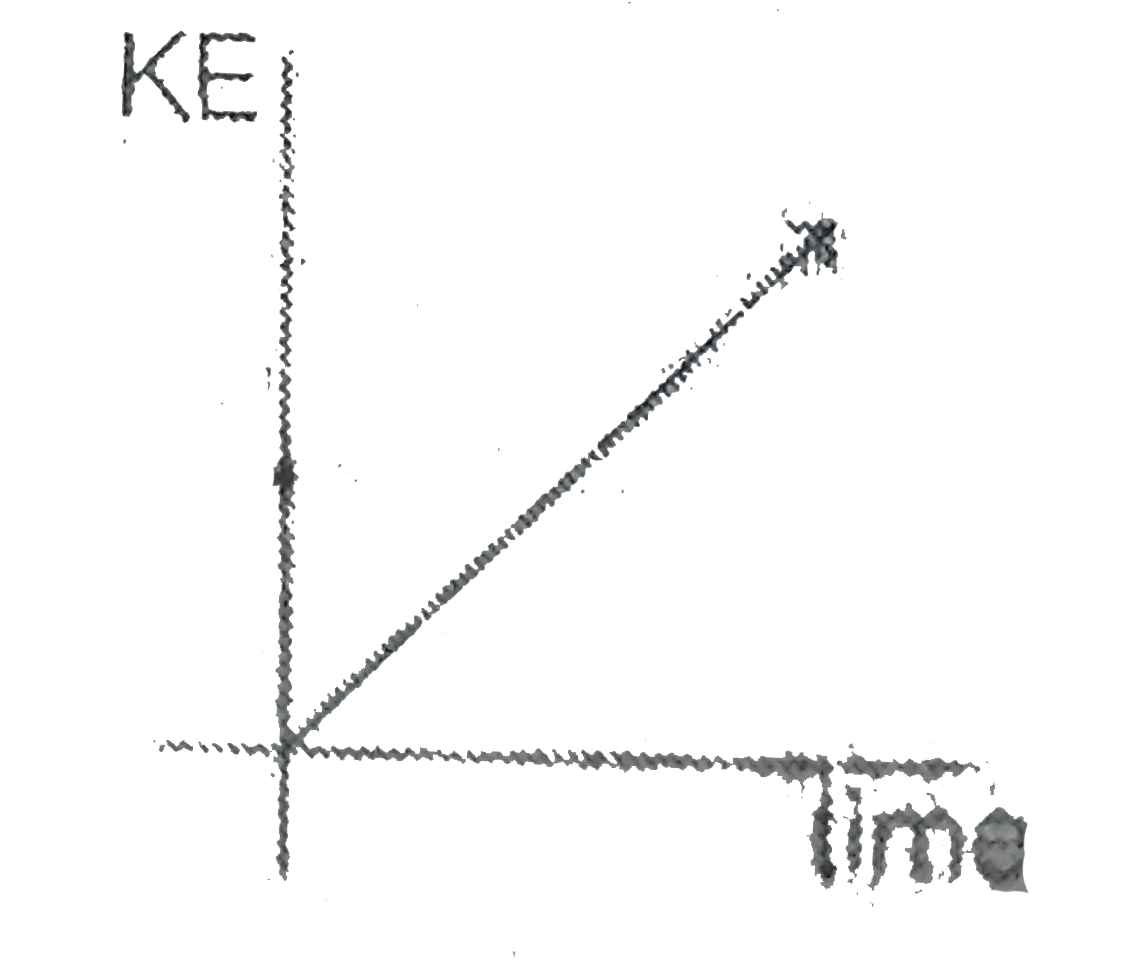
View SolutionThe kinetic energy (KE) versus time graph for a particle moving along a straight line is as shown in the figure. The force versus time graph for the particle may be
View SolutionIf the momentum of a particle is plotted on X−axis and its kinetic energy on the Y−axis, the graph is a
View Solution

