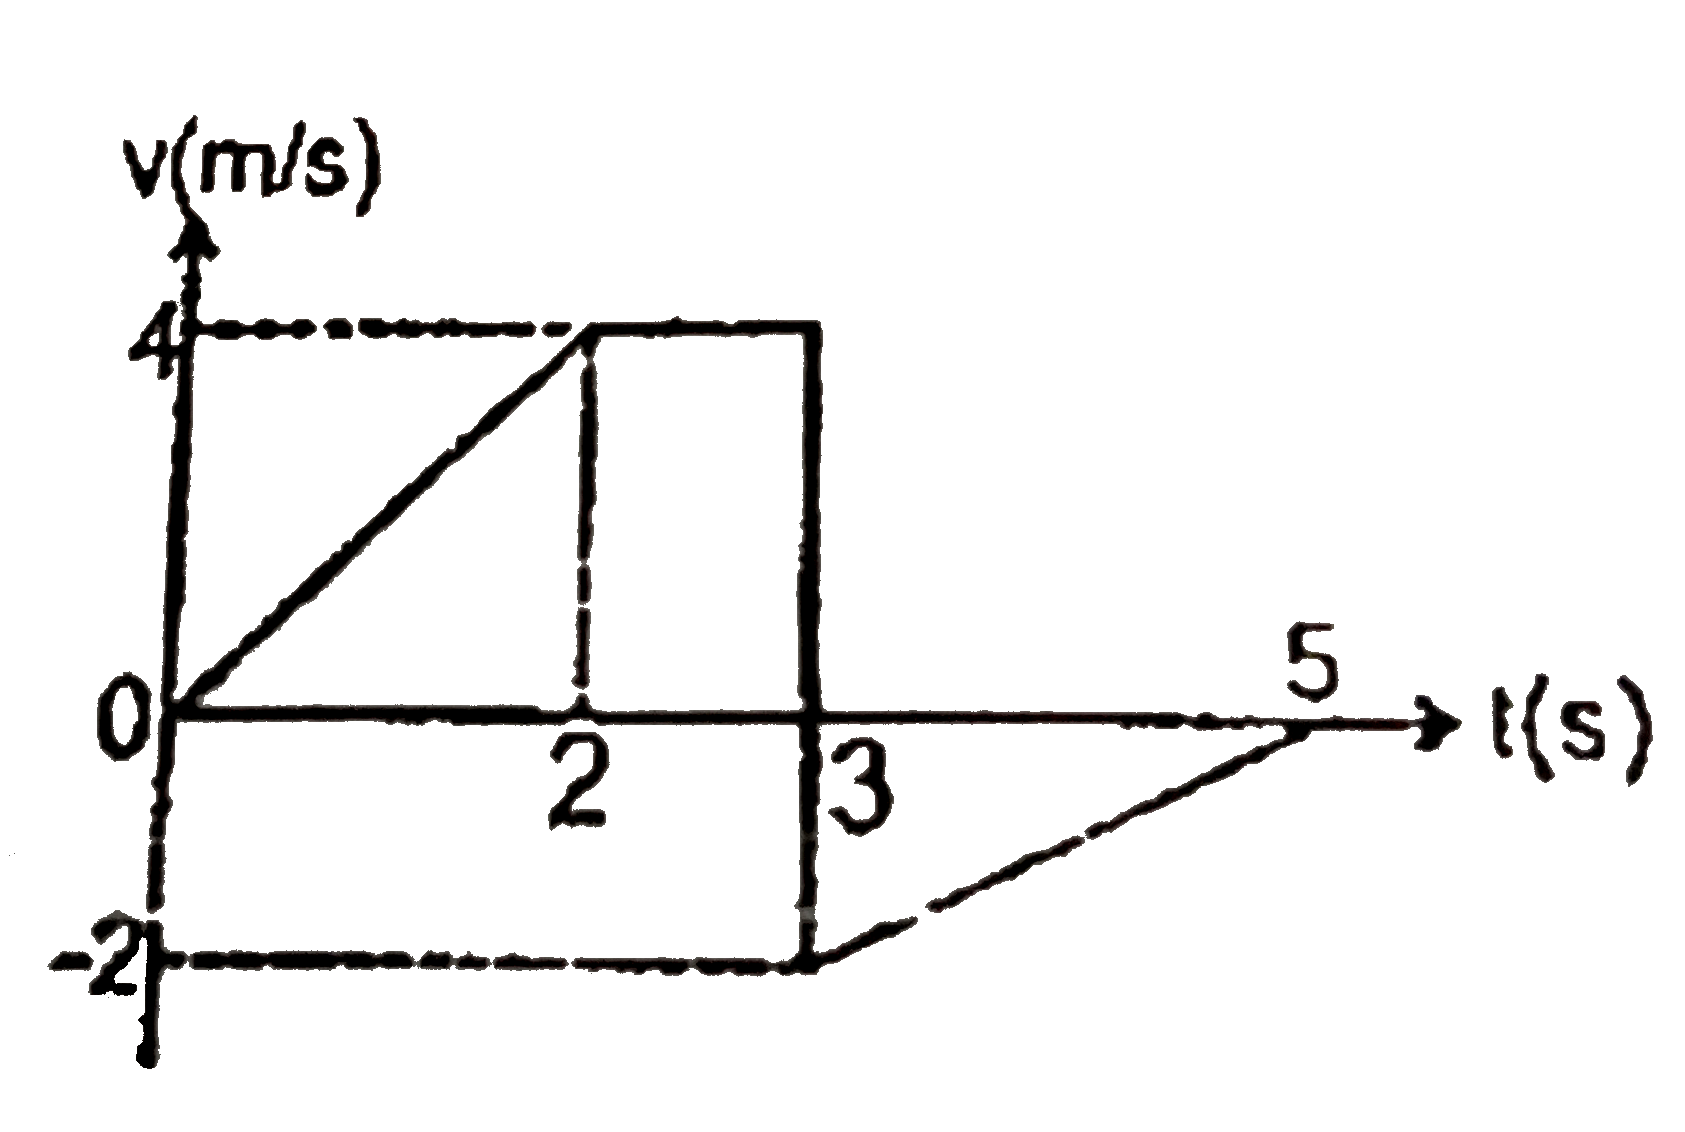
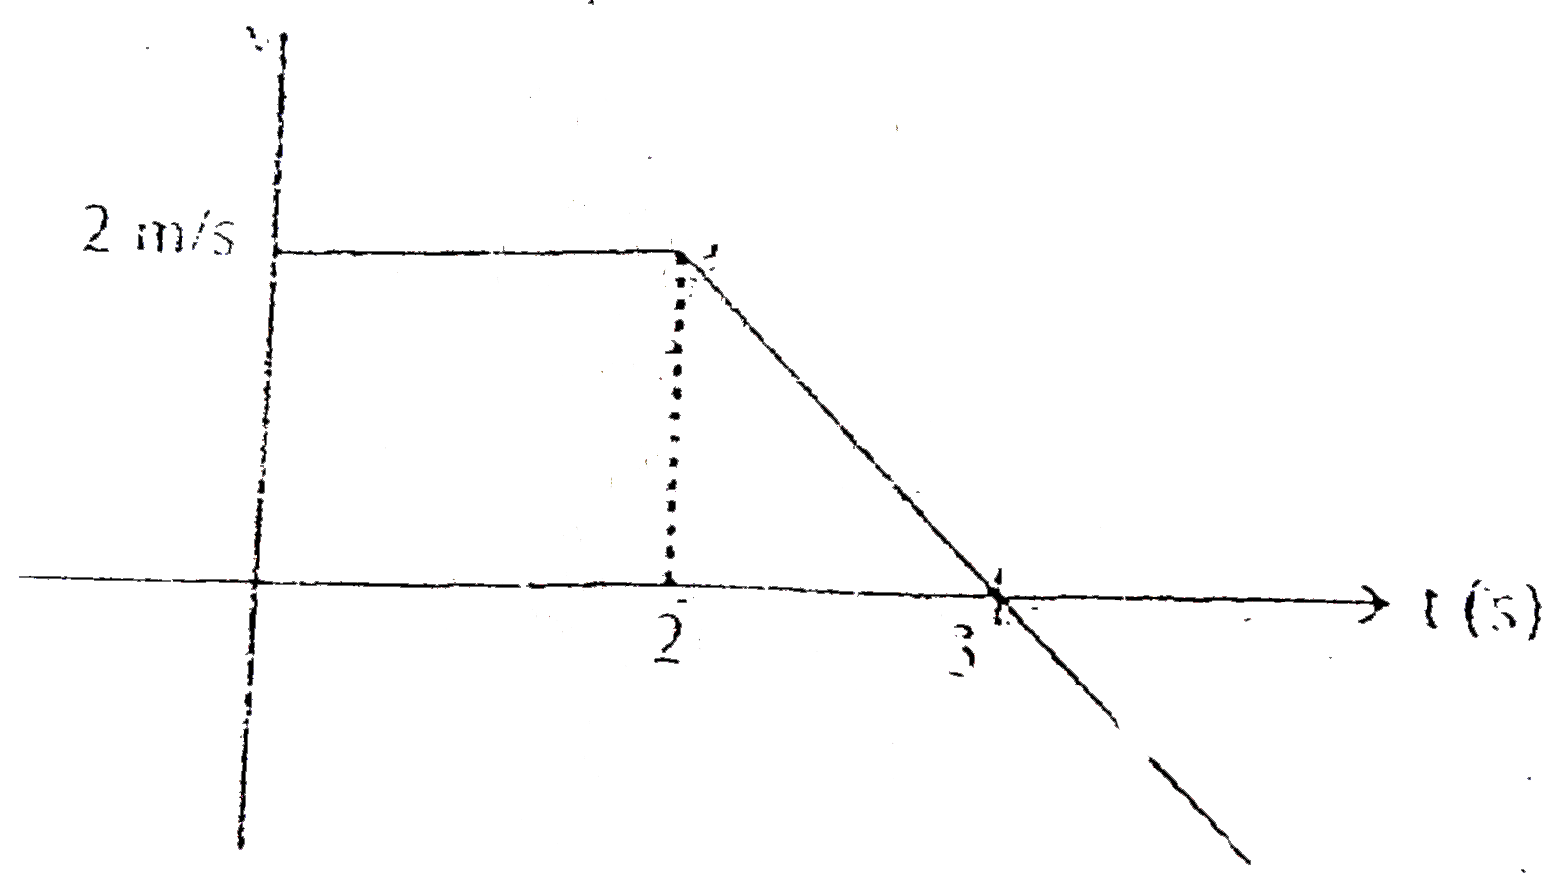
velocity time graph of a particle is shown in figure. Find displacement of the particle.
7
11
5
15
The correct Answer is:B
Step by step video, text & image solution for velocity time graph of a particle is shown in figure. Find displacement of the particle. by Physics experts to help you in doubts & scoring excellent marks in Class 12 exams.
Topper's Solved these Questions
Similar Questions
Knowledge Check
- Question 1 - Select One
The velocity − time graph of a particle is as shown in figure
 AIt moves with a constant acceleration throughoutBIt moves with an acceleration of constant magnitude but changing direction at the end of every two secondCThe displacement of the particle is zeroDThe velocity becomes zero at t=4 second
 - Question 2 - Select One
The velocity displacement graph of a particle is shown in figure. The acceleration of the particle when x=0 is.
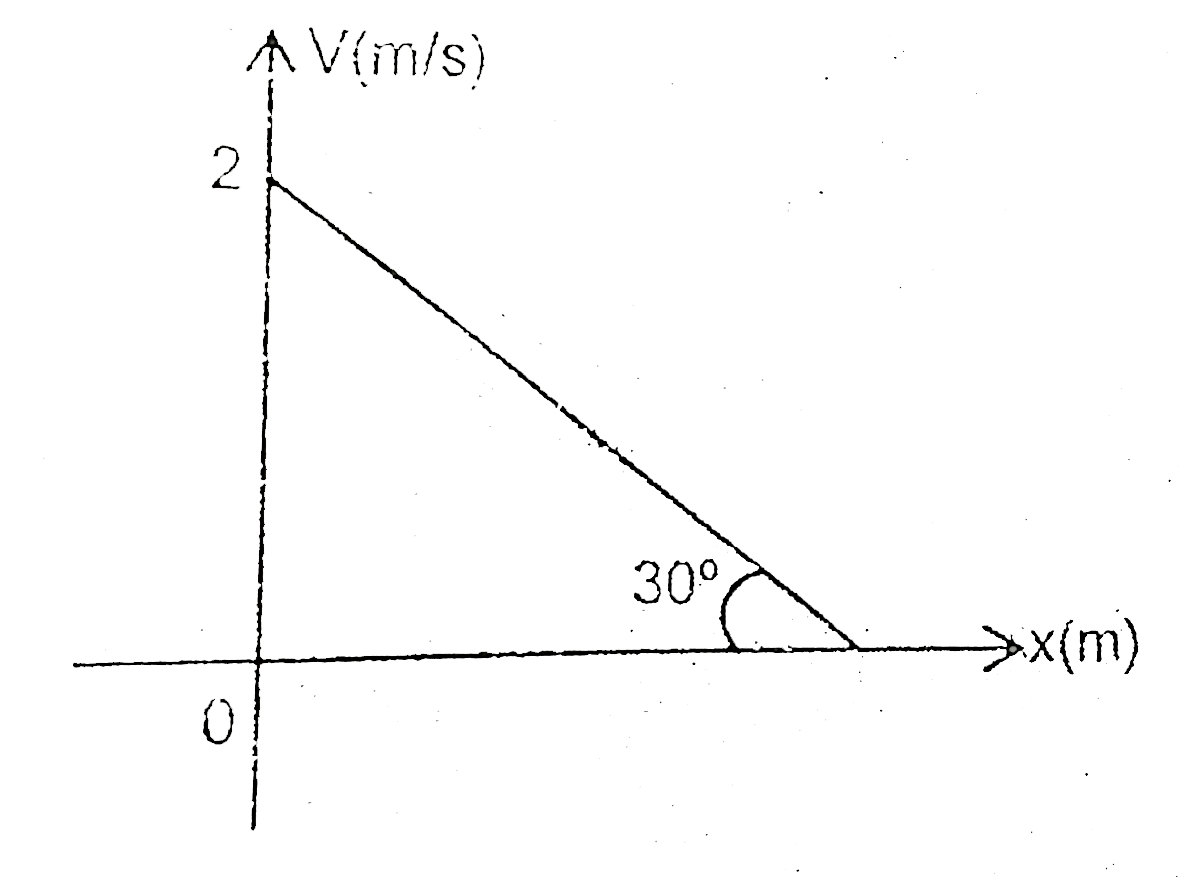 A1√3m/s2B−2√3m/s2C23m/s2DNone of the above
 - Question 3 - Select One
The velocity -displacement graph of a particle is as shown in the figure. Which of the following graphs correctly represents the variation of acceleration with displacement?
 A
A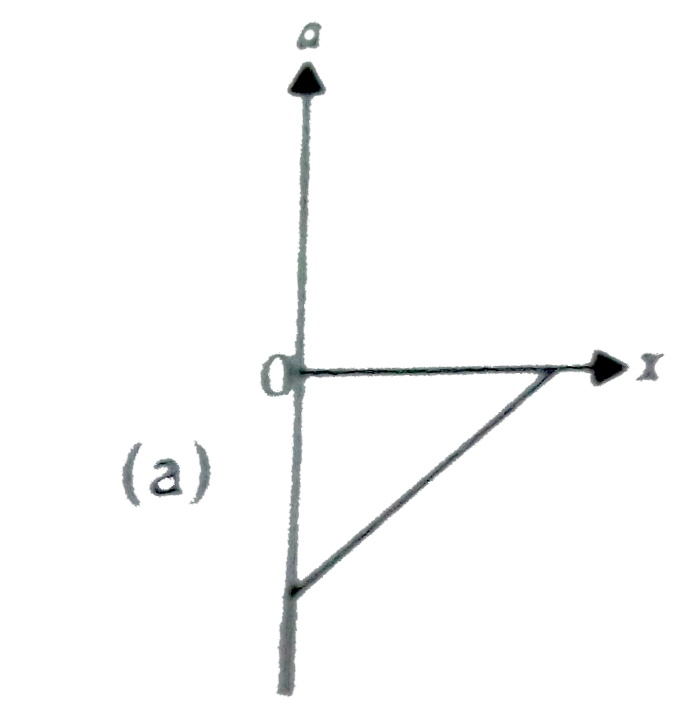 B
B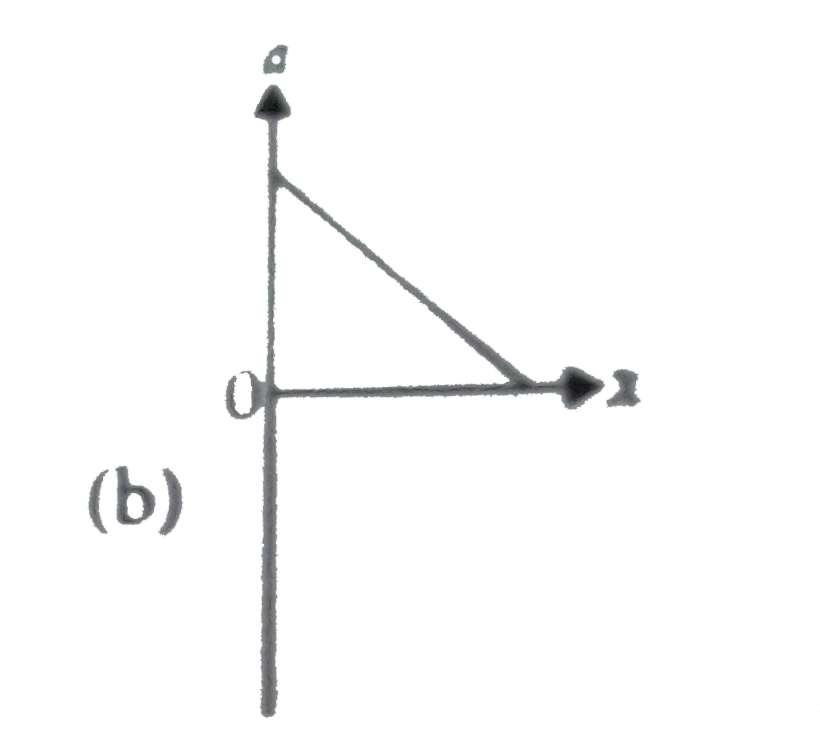 C
C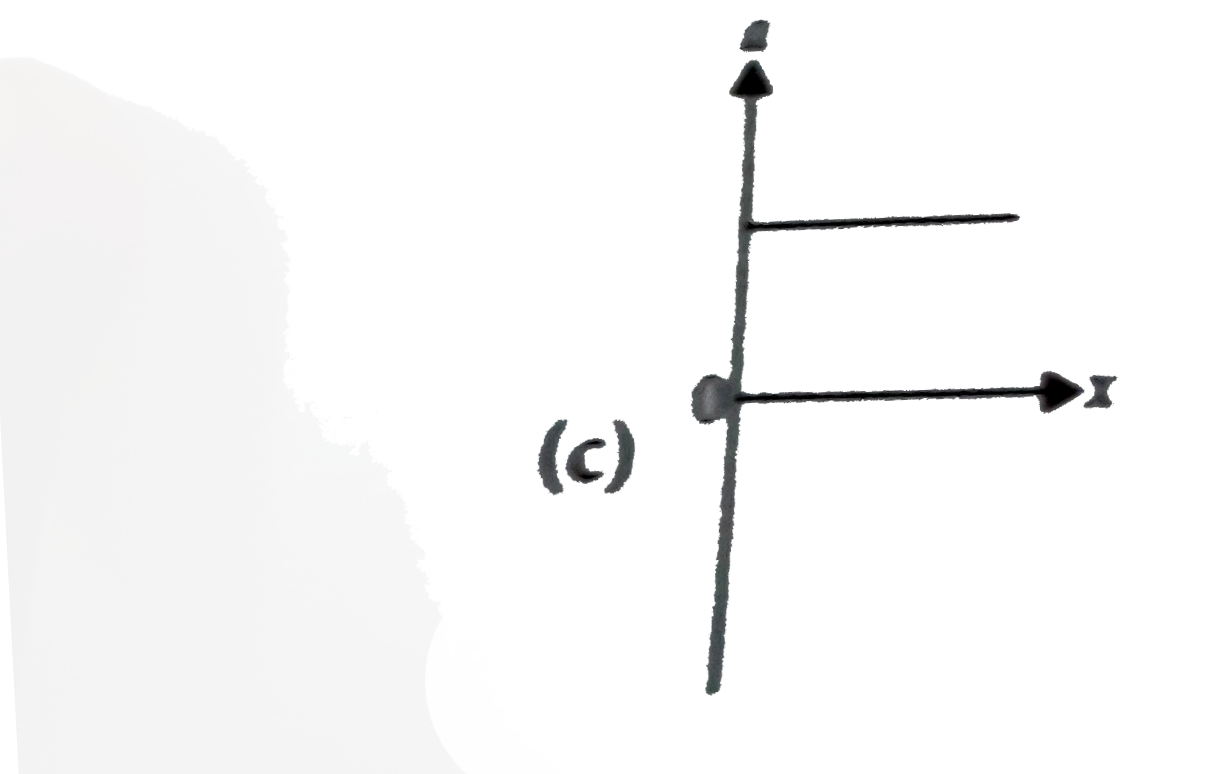 D
D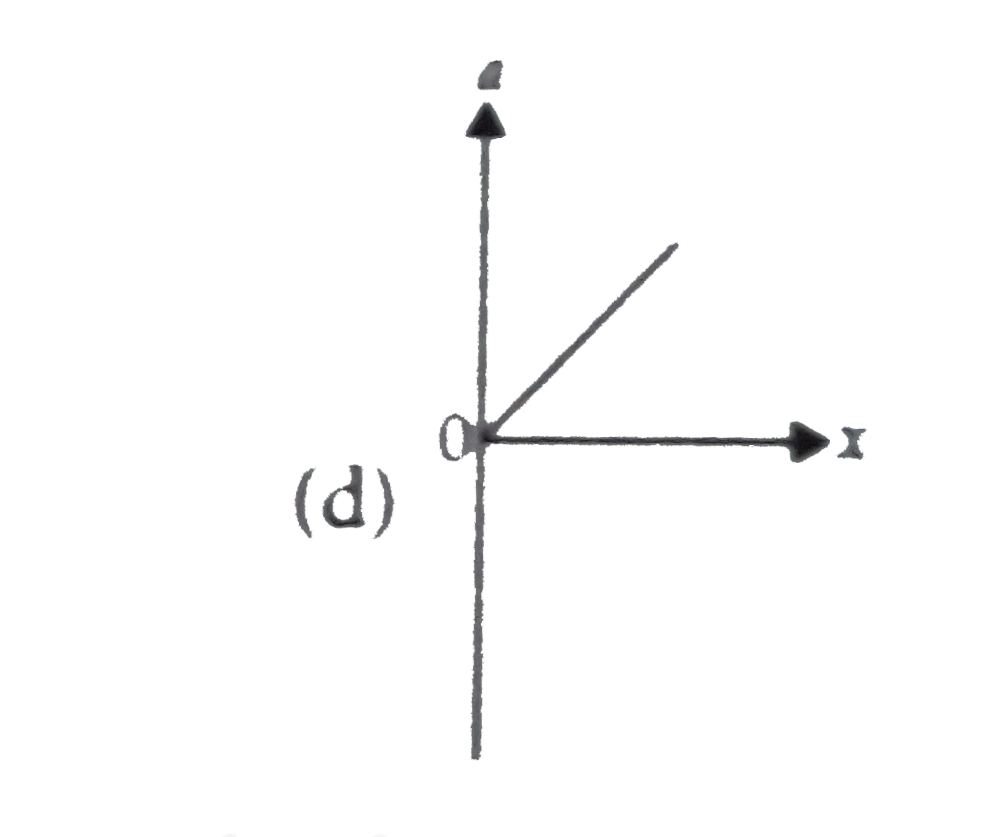
The displacement-time graph of a moving particle is shown in the figure. The velocity of the particle is zero at the point ______.
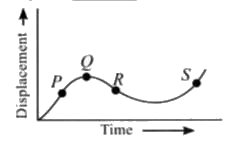 View Solution
The velocity time graph for a particle is shown in figure. Draw acceleration time graph from it.
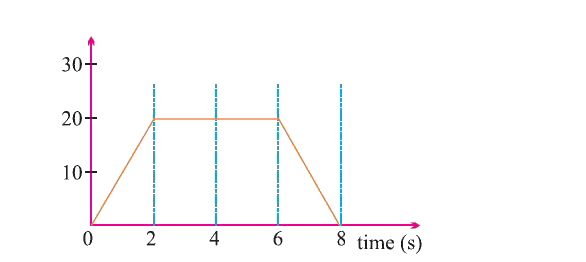 View Solution
The acceleration - time graph of a particle is as shown in figure Initial velocity of particle is 10m/s Displacement of the particle (in m) at the end of 8 sec is ___ Round off to nearest integer.
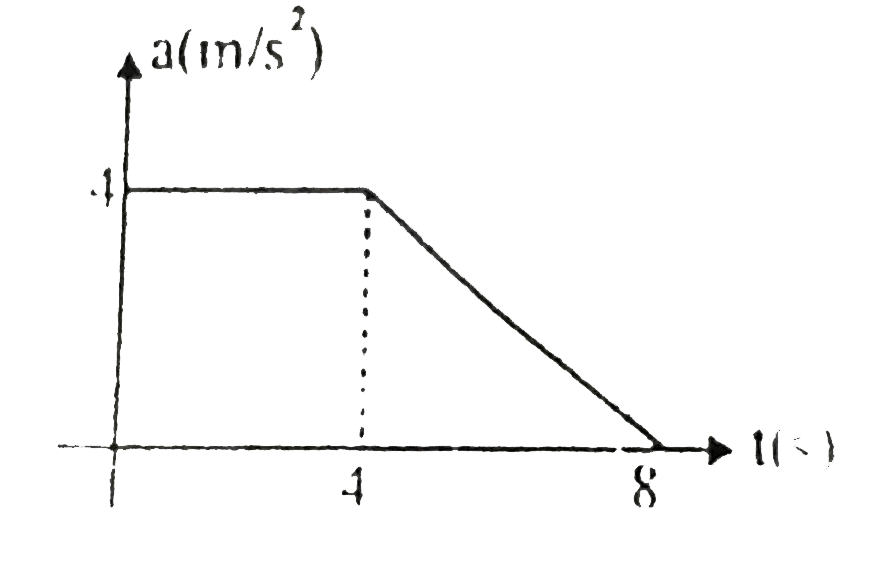 View Solution
Velocity-time graph of a particle in SHM is as shown in figure. Match the following
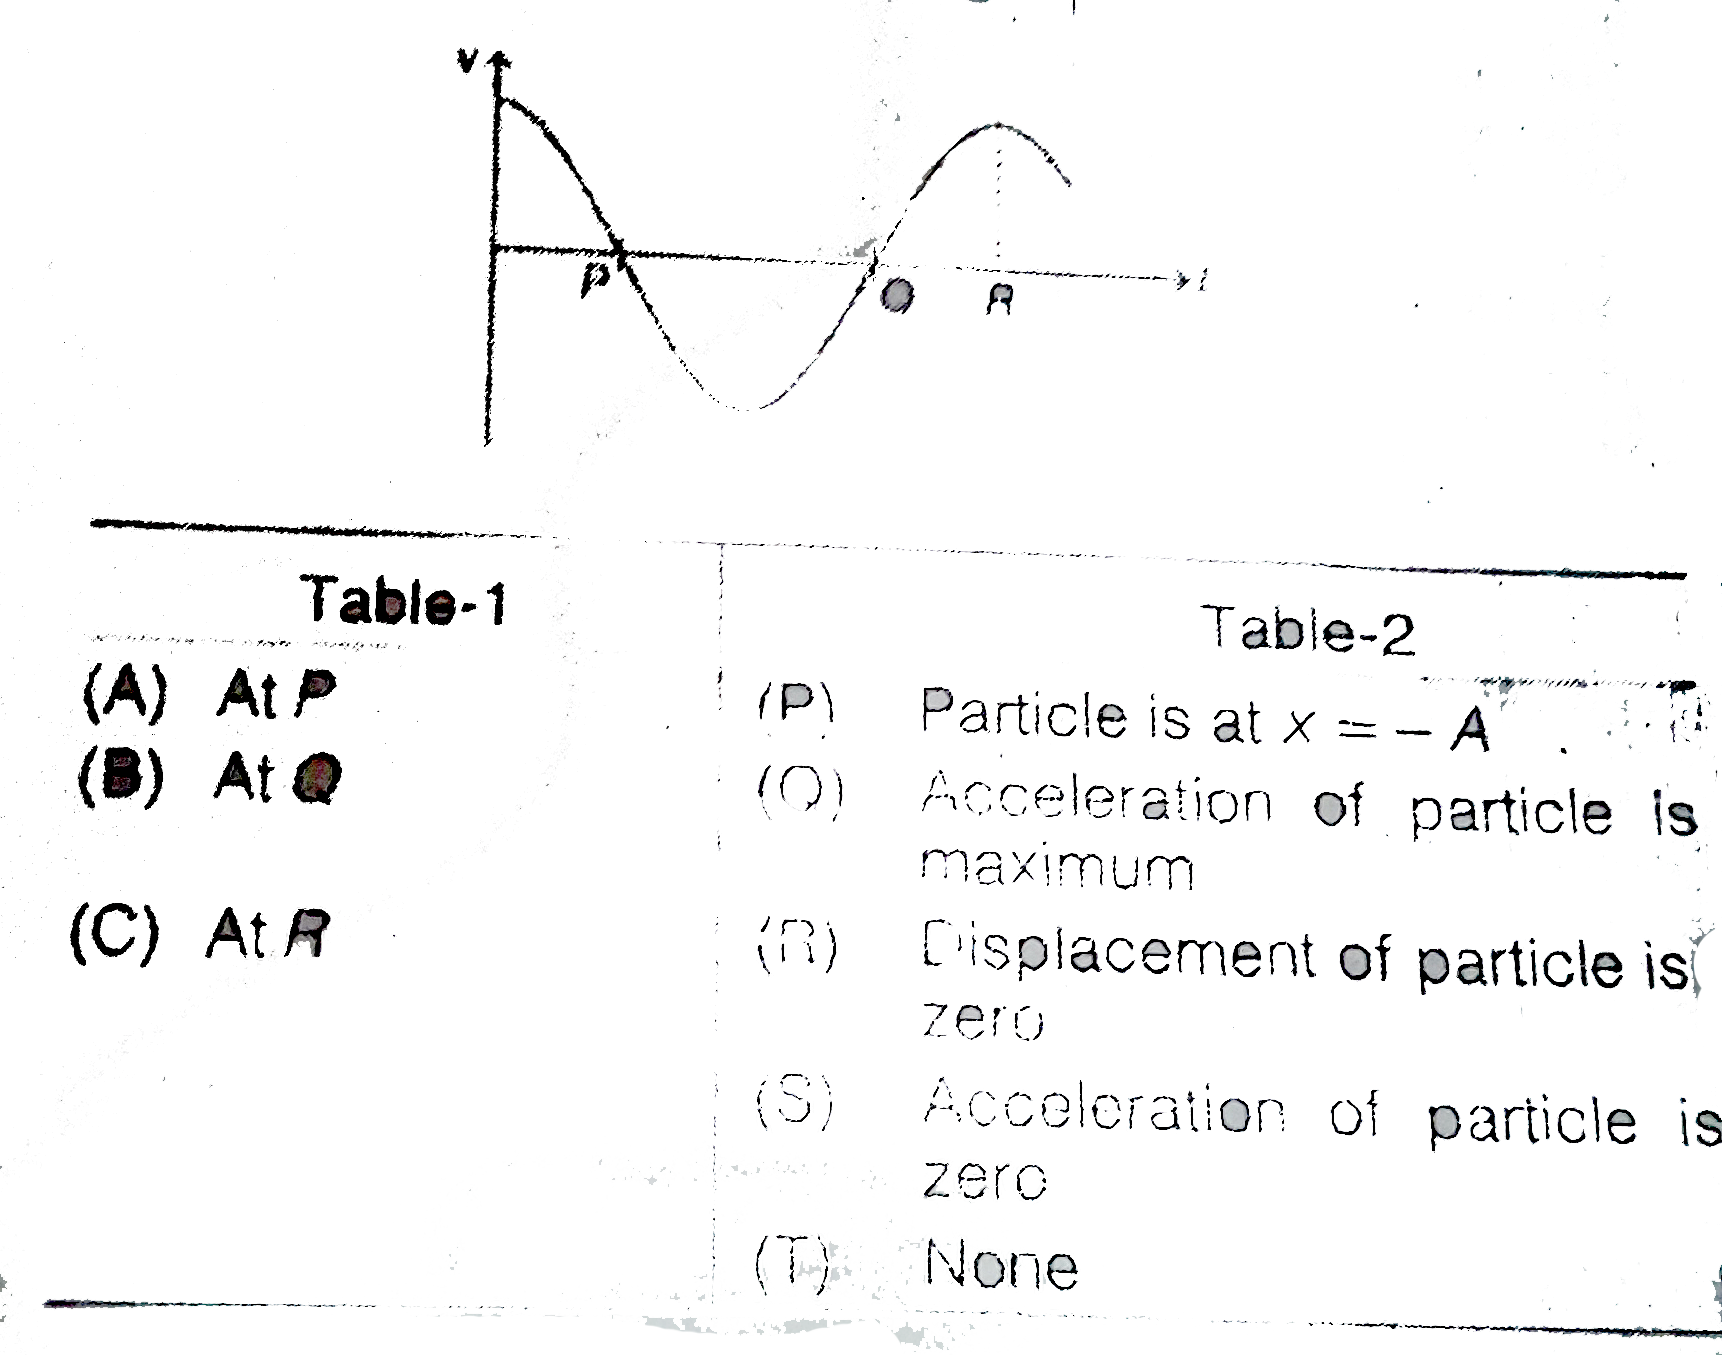 View Solution
A particle is moving on X−axis. Its velocity time graph is given in the figure. Find distance travelled by the particle in 5sec.
 View Solution


