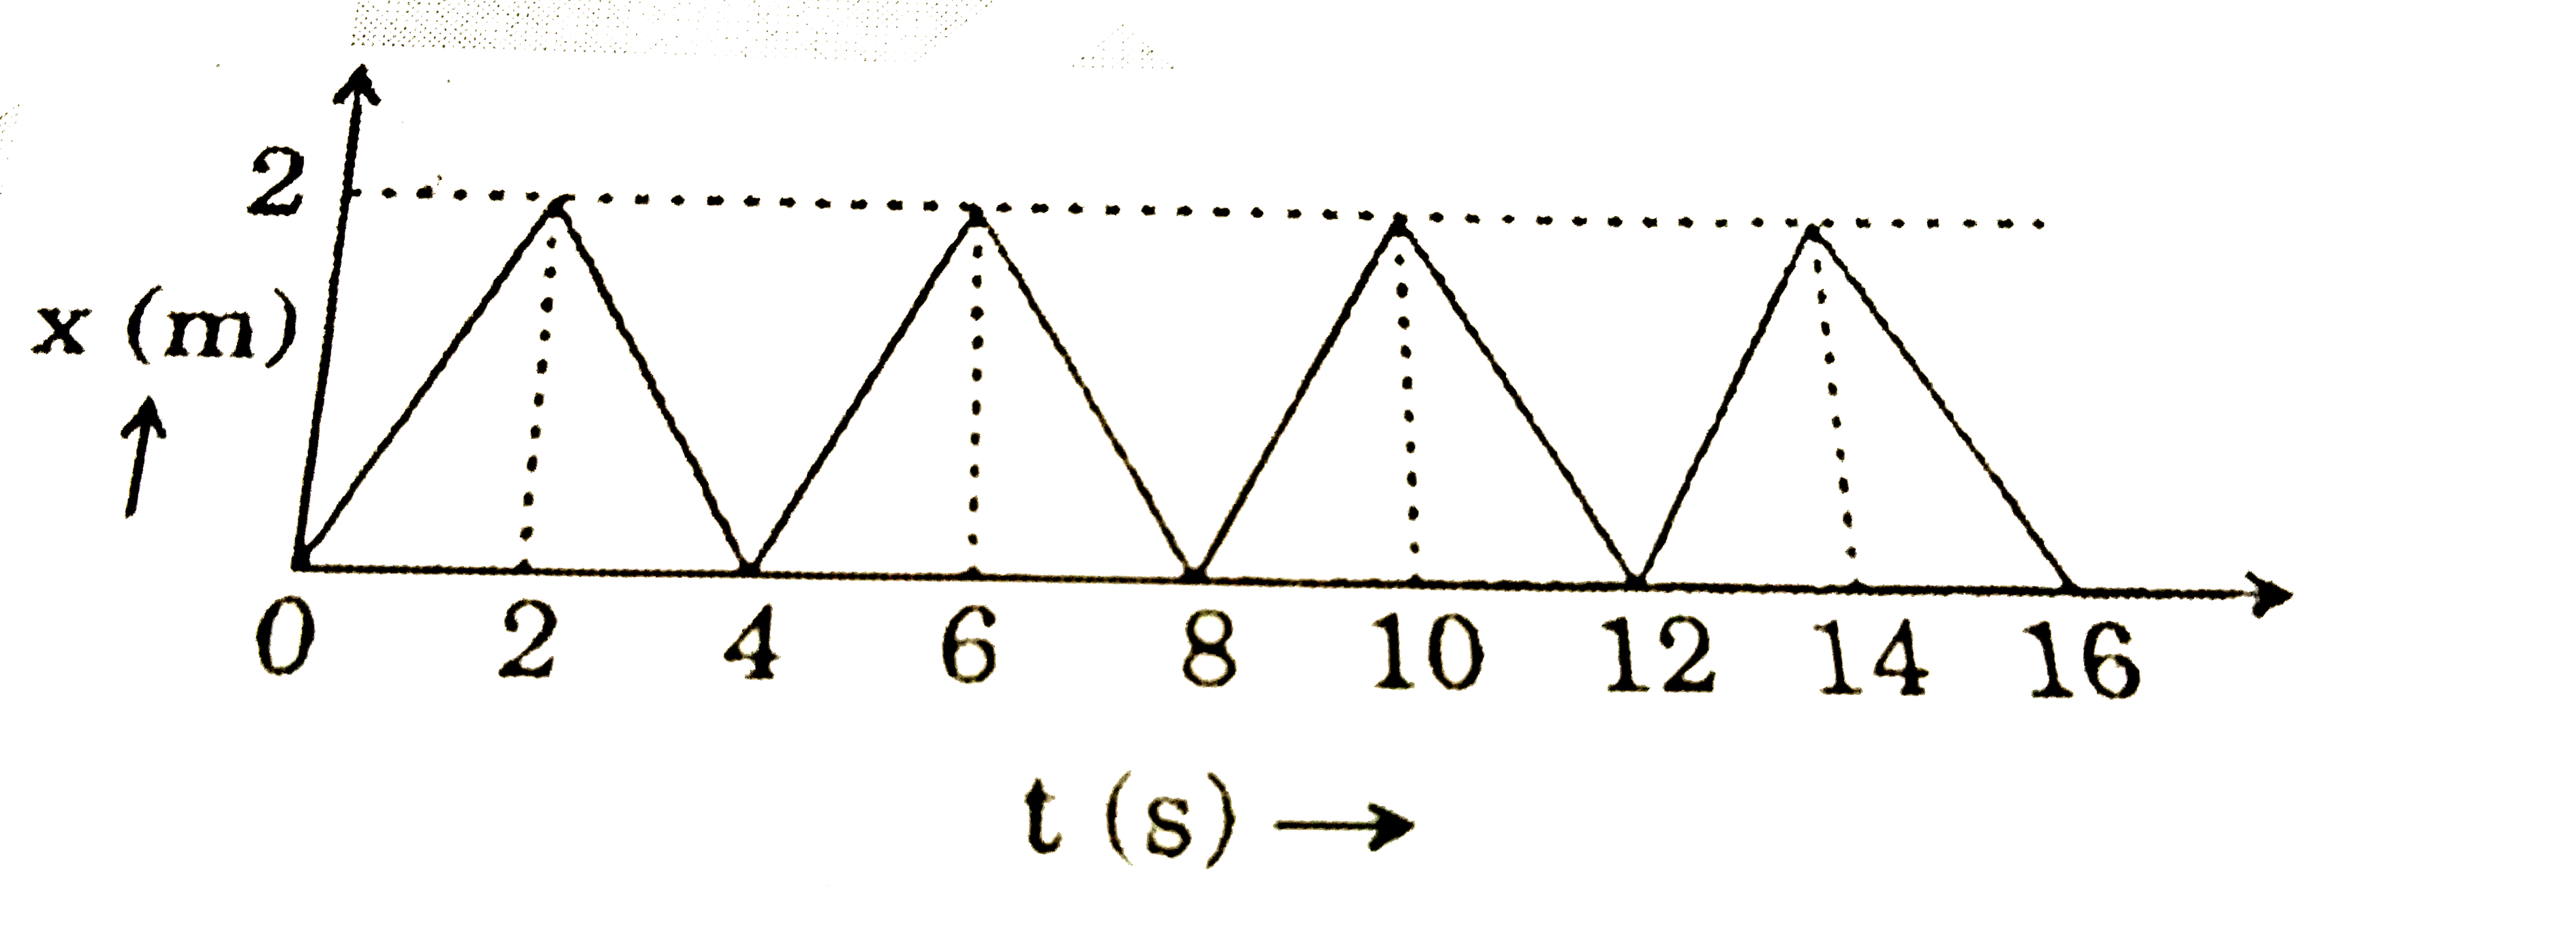
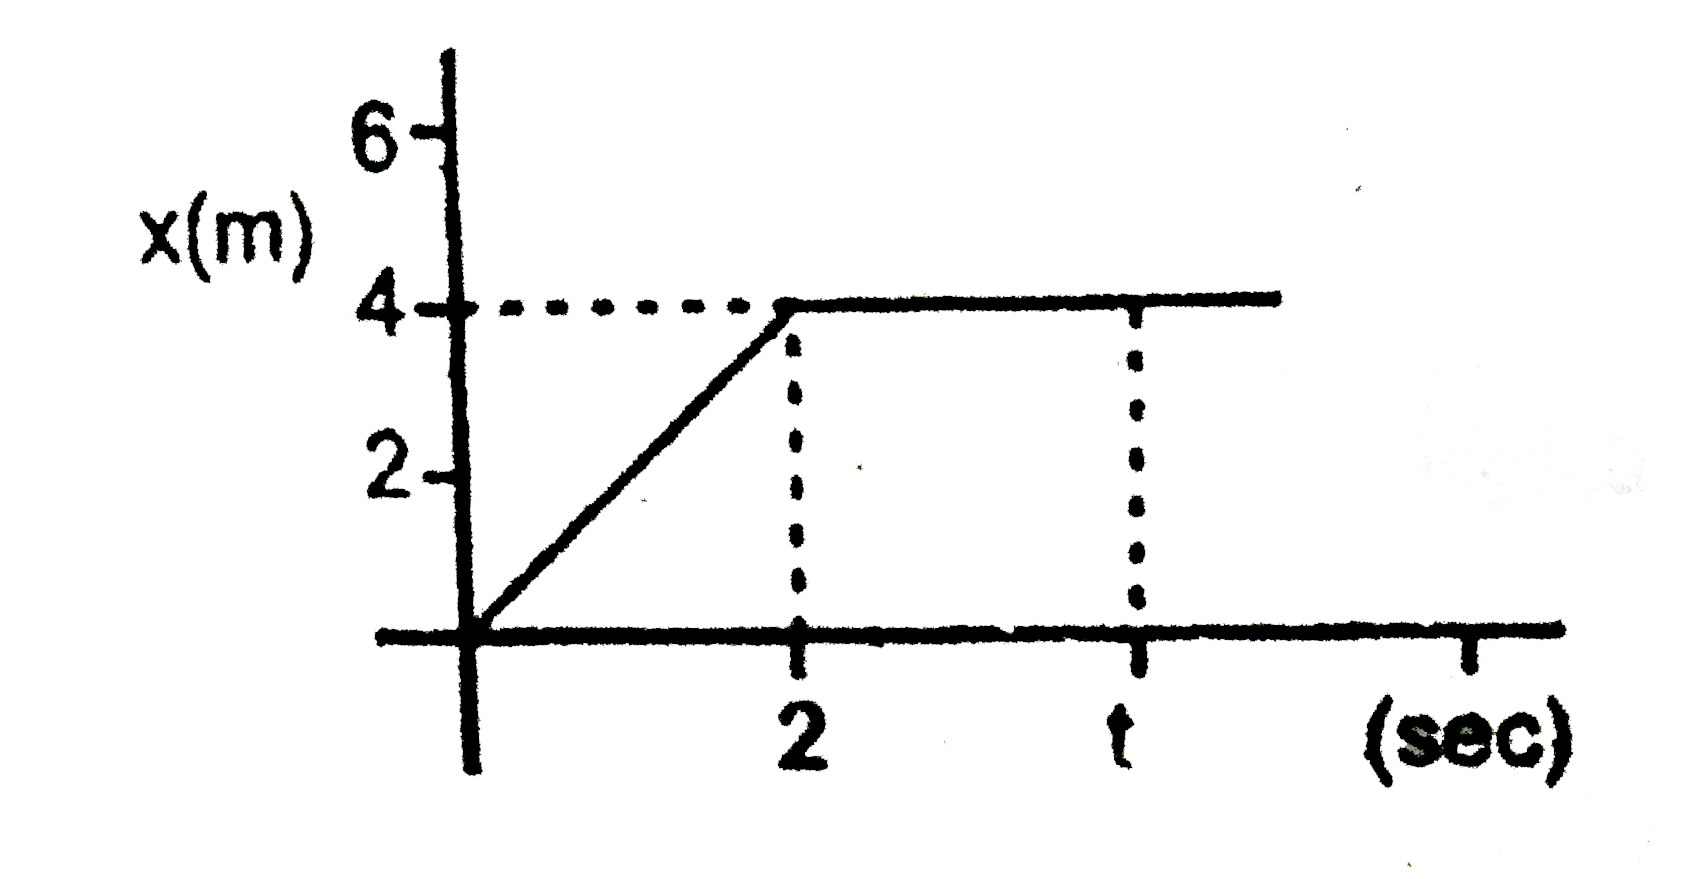
The figure shows the position - time (x - t) graph of one-dimensional motion of a body of mass 0.4 kg. The magnetic of each impulse is
0.4 Ns
0.8 Ns
1.6 Ns
0.2 Ns
The correct Answer is:B
Step by step video & image solution for The figure shows the position - time (x - t) graph of one-dimensional motion of a body of mass 0.4 kg. The magnetic of each impulse is by Physics experts to help you in doubts & scoring excellent marks in Class 12 exams.
Updated on:21/07/2023Topper's Solved these Questions
- CENTRE OF MASSBOOK - MOTIONCHAPTER - CENTRE OF MASSEXERCISE - Exercise - 4 Level-II
20 Videos
- CENTRE OF MASSBOOK - MOTIONCHAPTER - CENTRE OF MASSEXERCISE - Exercise - 3 Level-II
16 Videos
- Capacitance BOOK - MOTIONCHAPTER - Capacitance EXERCISE - EXERCISE -4 LEVEL II
19 Videos
- CIRCULAR MOTIONBOOK - MOTIONCHAPTER - CIRCULAR MOTIONEXERCISE - EXERCISE - 4
16 Videos
Similar Questions
Knowledge Check
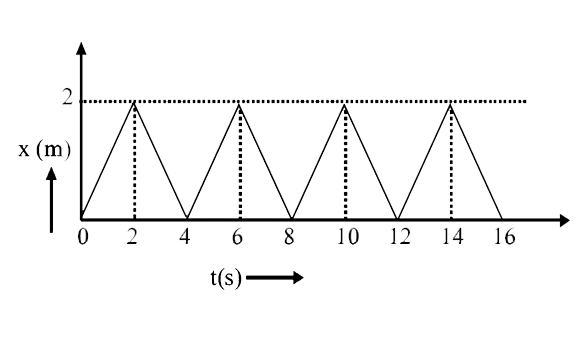
The figure shows the position-time (x-t) graph of one-dimensional motion of a body of mass 0.4kg. The magnitude of each impulse is
 A0.4NsB0.8NsC1.6NsD0.2Ns
The figure shows the position – time (x – t) graph of one – dimensional motion of a body of mass 0.4 kg. The magnitude of each impulse is:
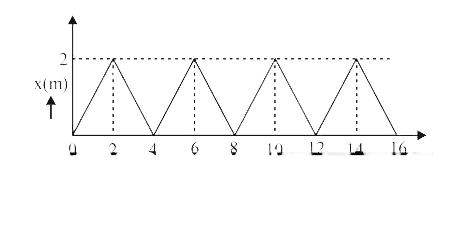 A0.4 NsB0.8 NsC1.6 NsD0.2 Ns
Figure shows the position-time (x-t) graph of one dimensional motion of a mass 500g. What is the time interval between two consecutive impulses received by the body?
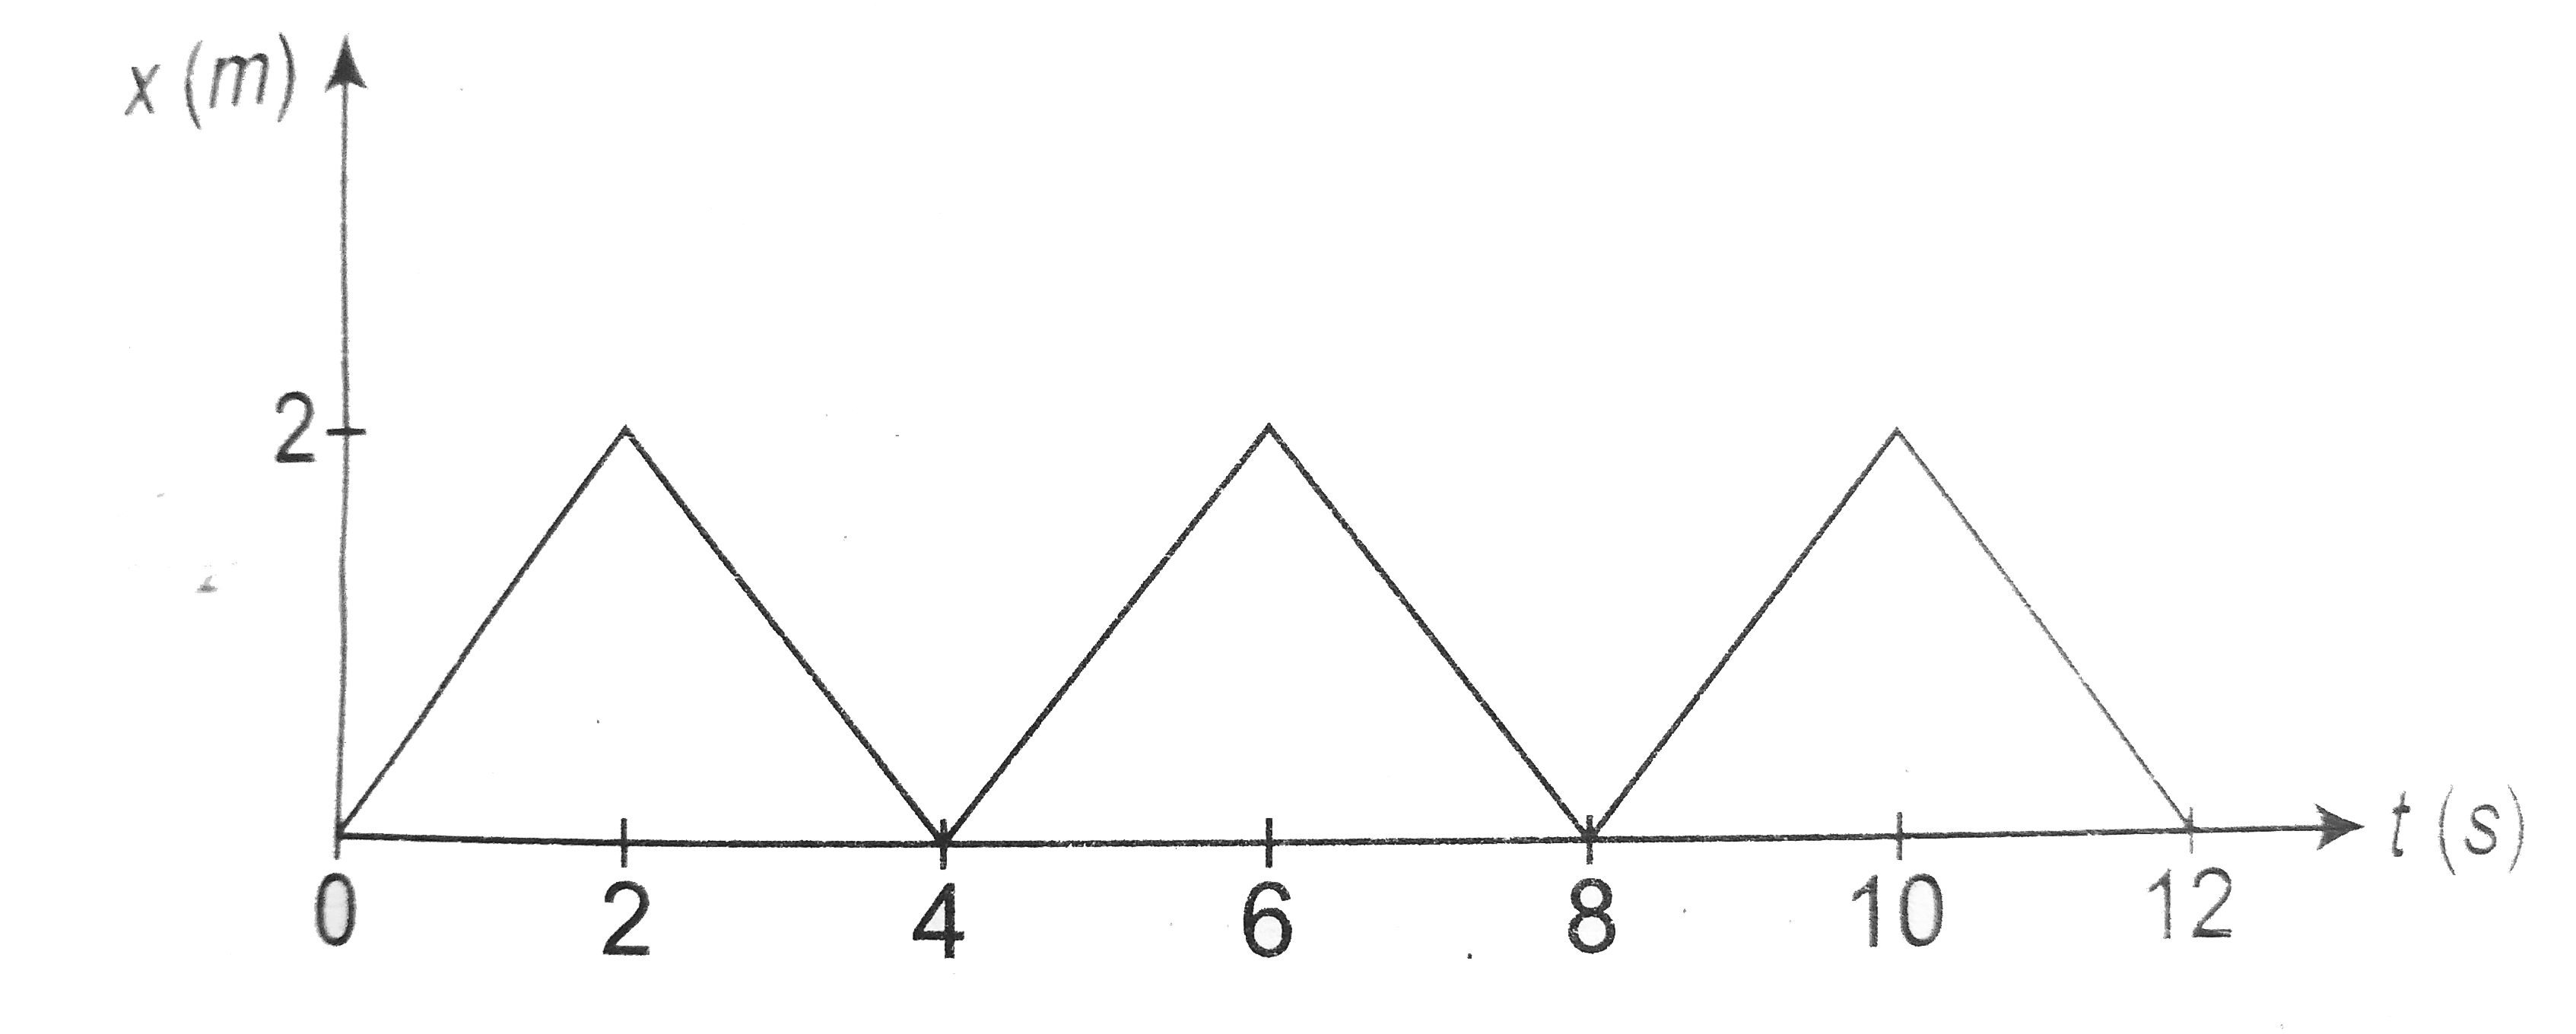 A2sB4sC6sD8s
Figure shows the position time graph for a particle in one dimensional motion. What is the displacement of the particle in first 4 seconds ?
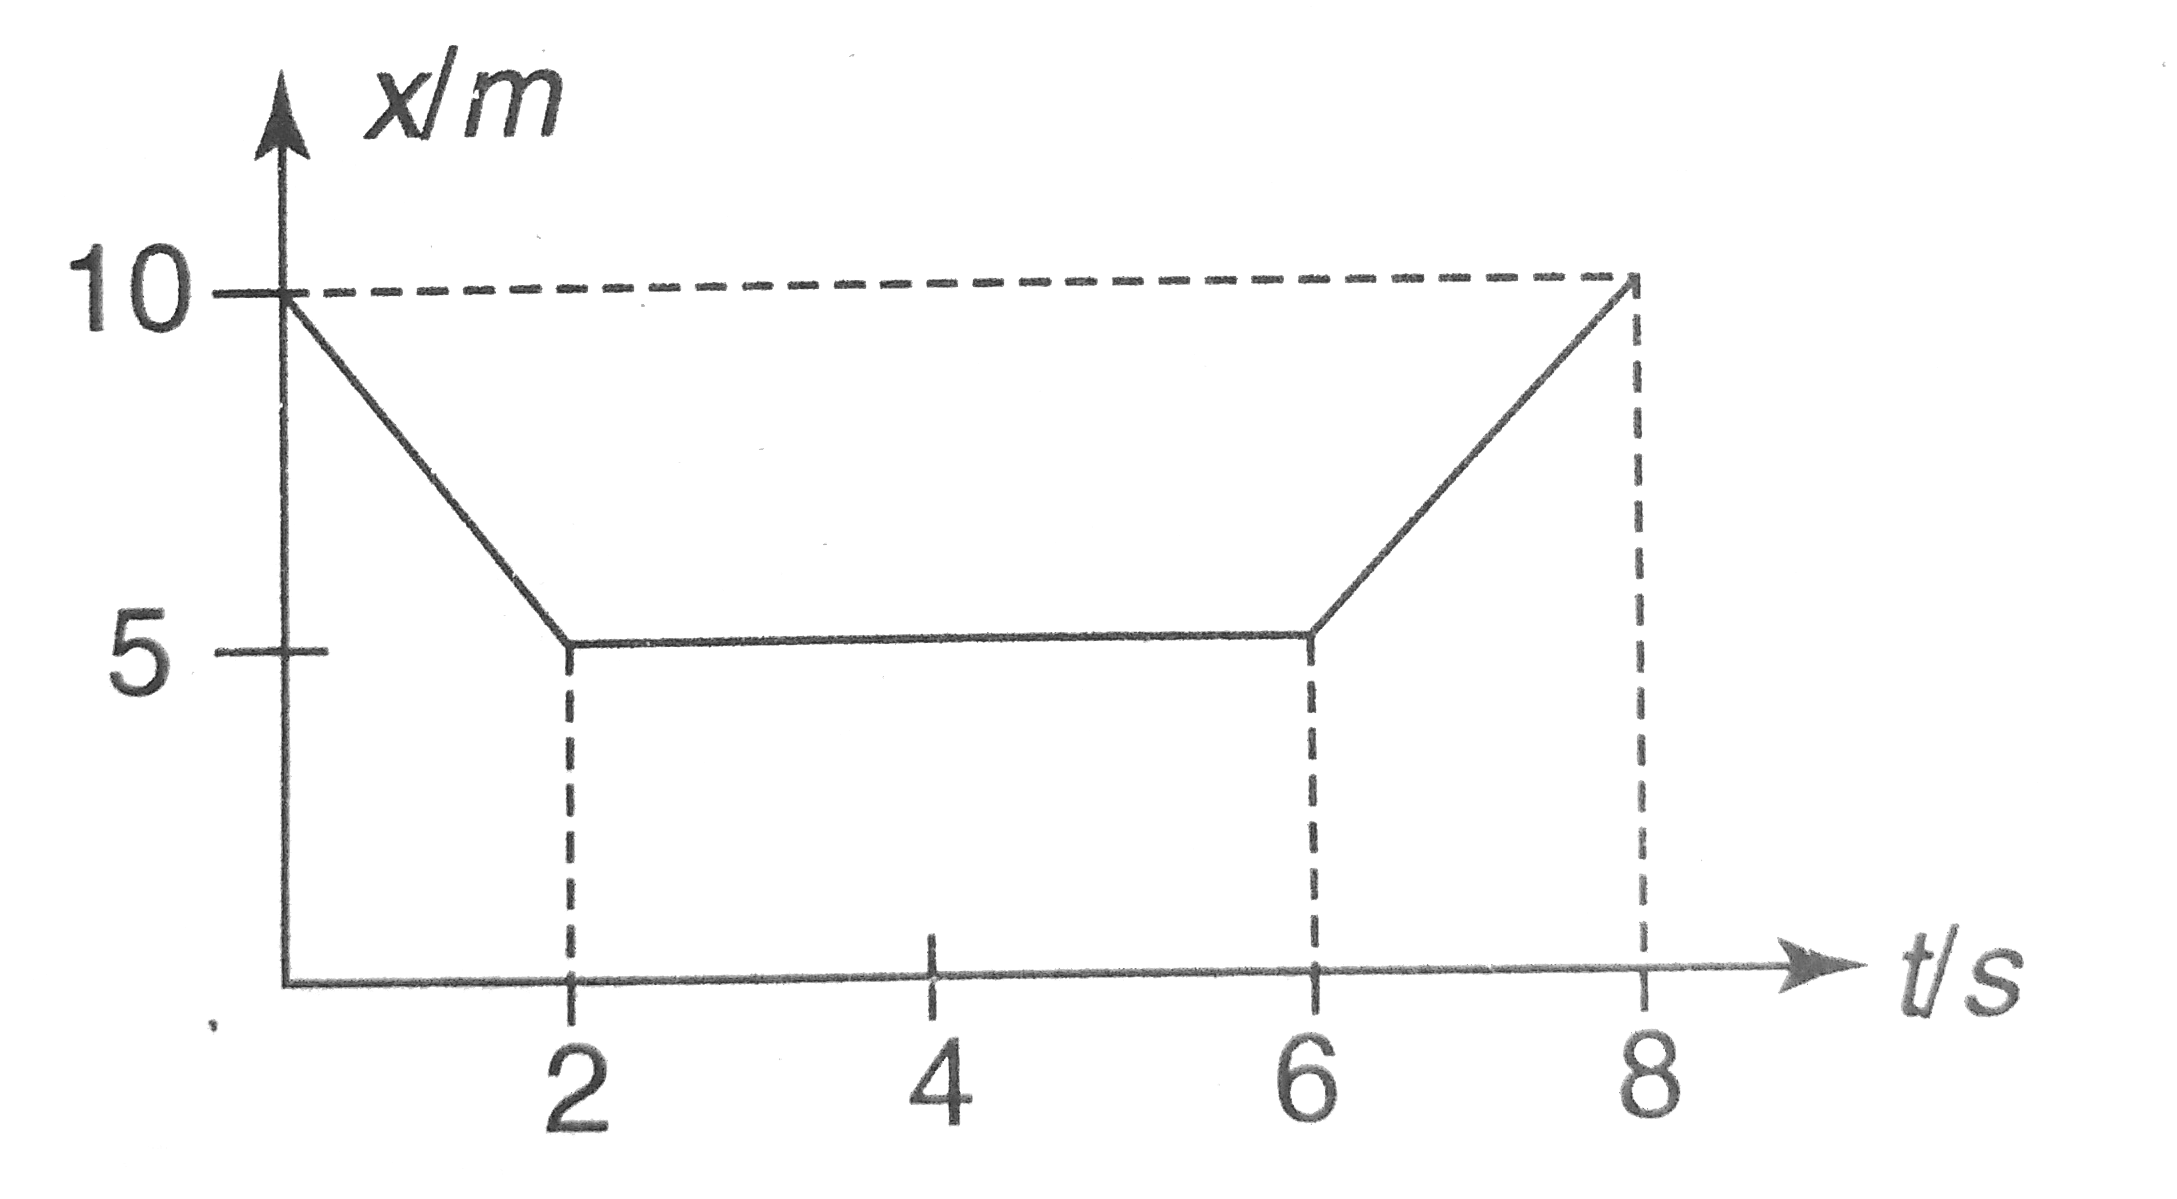
View SolutionFigure below shows the velocity-time graph of a one dimensional motion. Which of the following characteristic of the particle is represented by the shaded area?
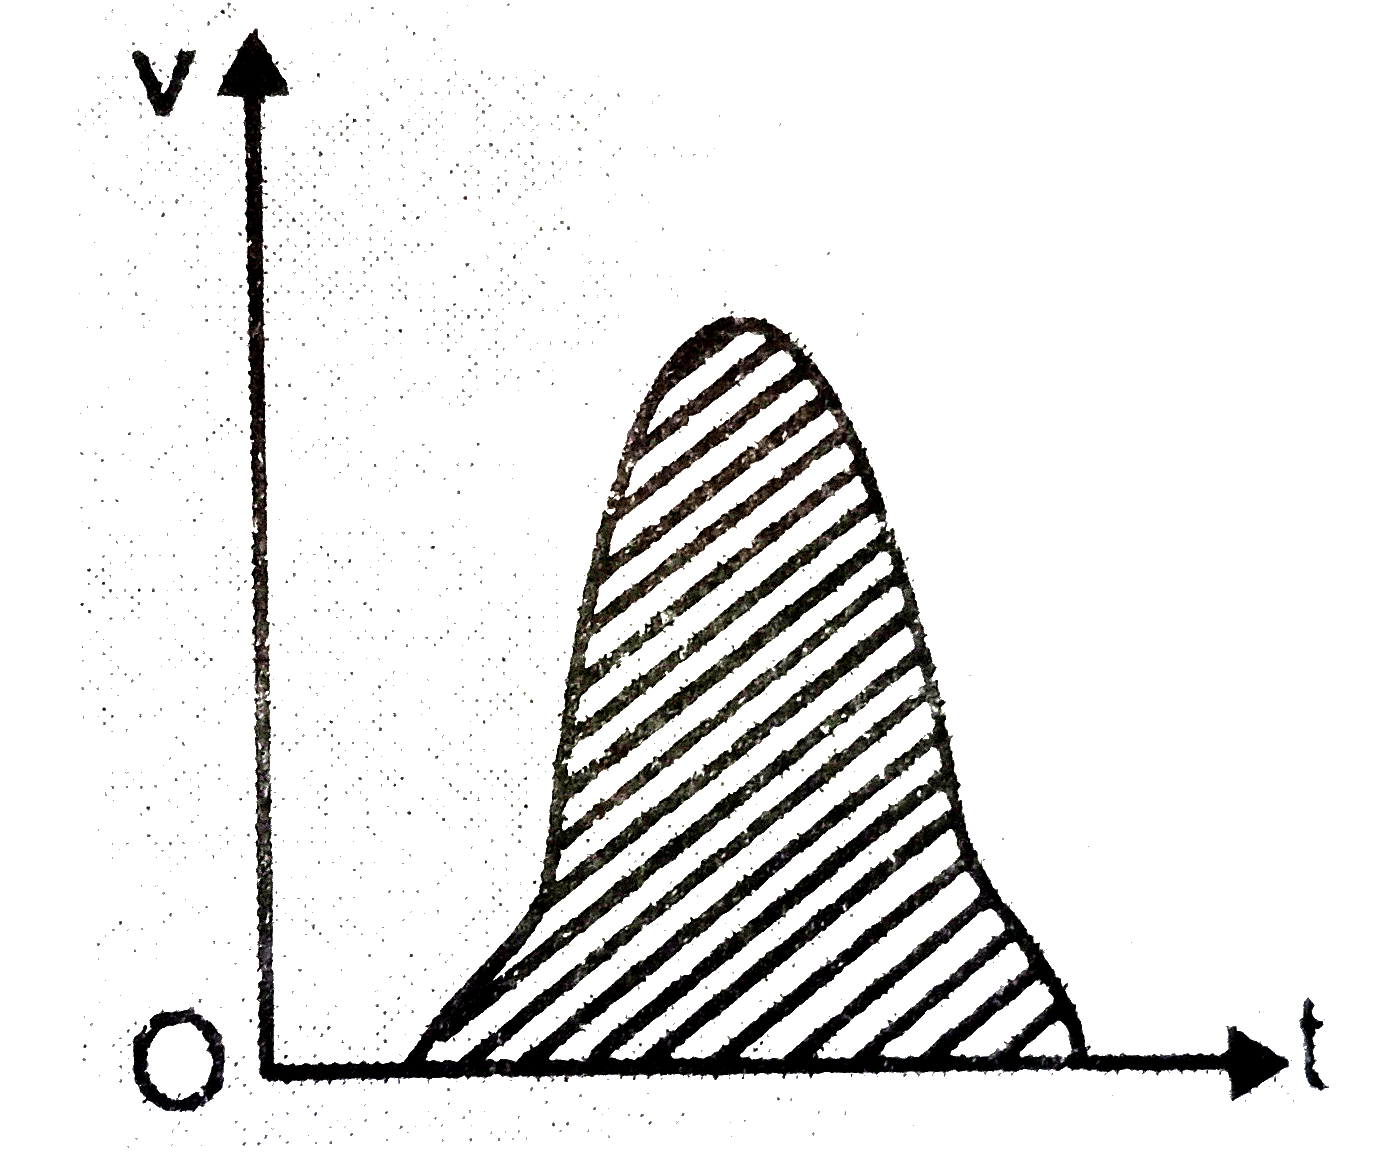
View SolutionIn the figure given below, the position time graph of a particle of mass 0.1kg is shown. The impulse at t=2 sec is
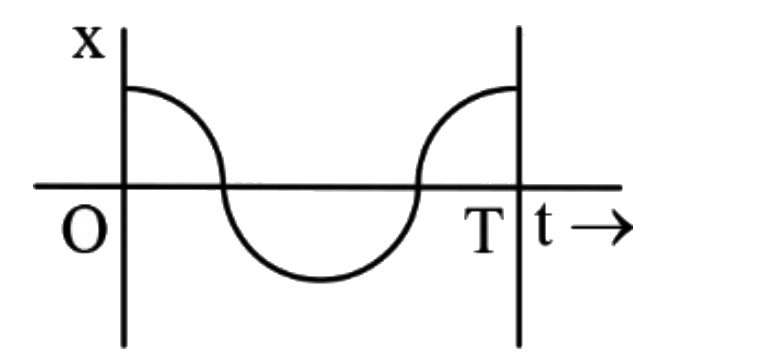
View SolutionA body is performing simple harmonic motion of amplitude A and time period T. The figure shown position-time graph of the body . At any time t, acceleration of the body is f, then which of the following graphs is/are appropriate?
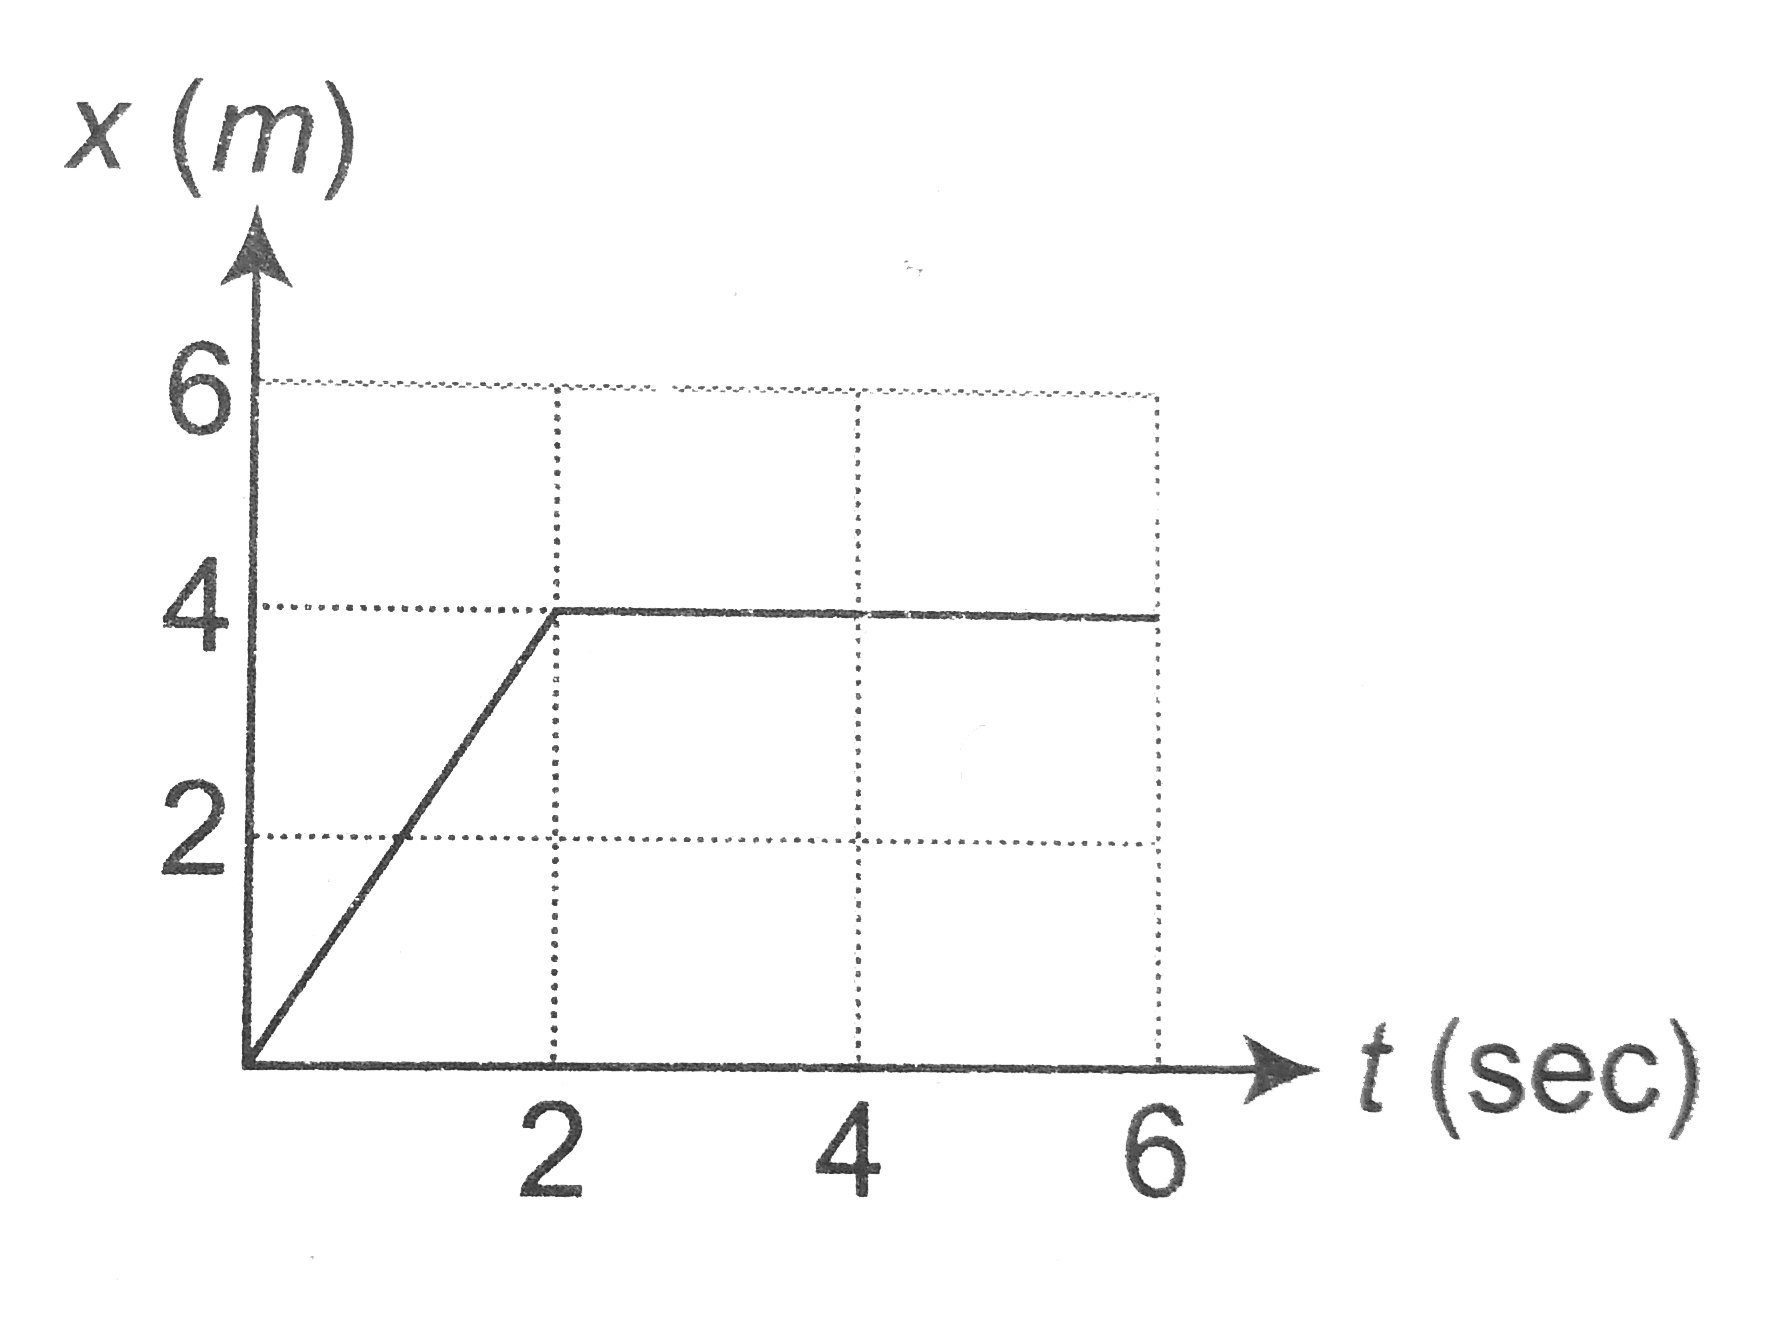
View SolutionIn the figure given below, the position-time graph of a particle of mass 0.1kg is shown. The impuslse at t=2 sec is
View Solution

