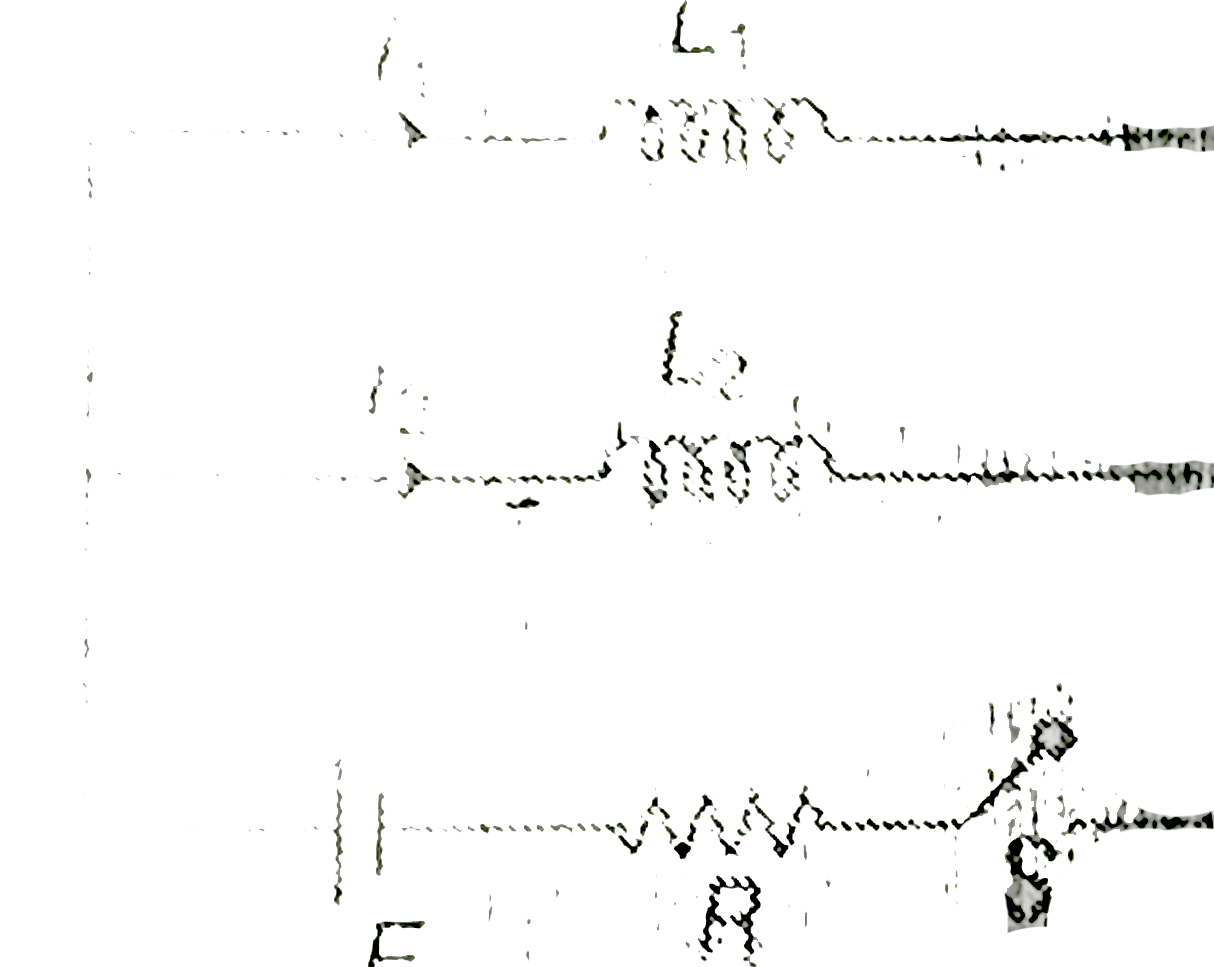
In an circuit while charging, the graph of versis time is as shown by the dotted line in the diagram figure. Where is the current. When the value of the resistance is doubled, which of the solid curve best represents the variation of versus time
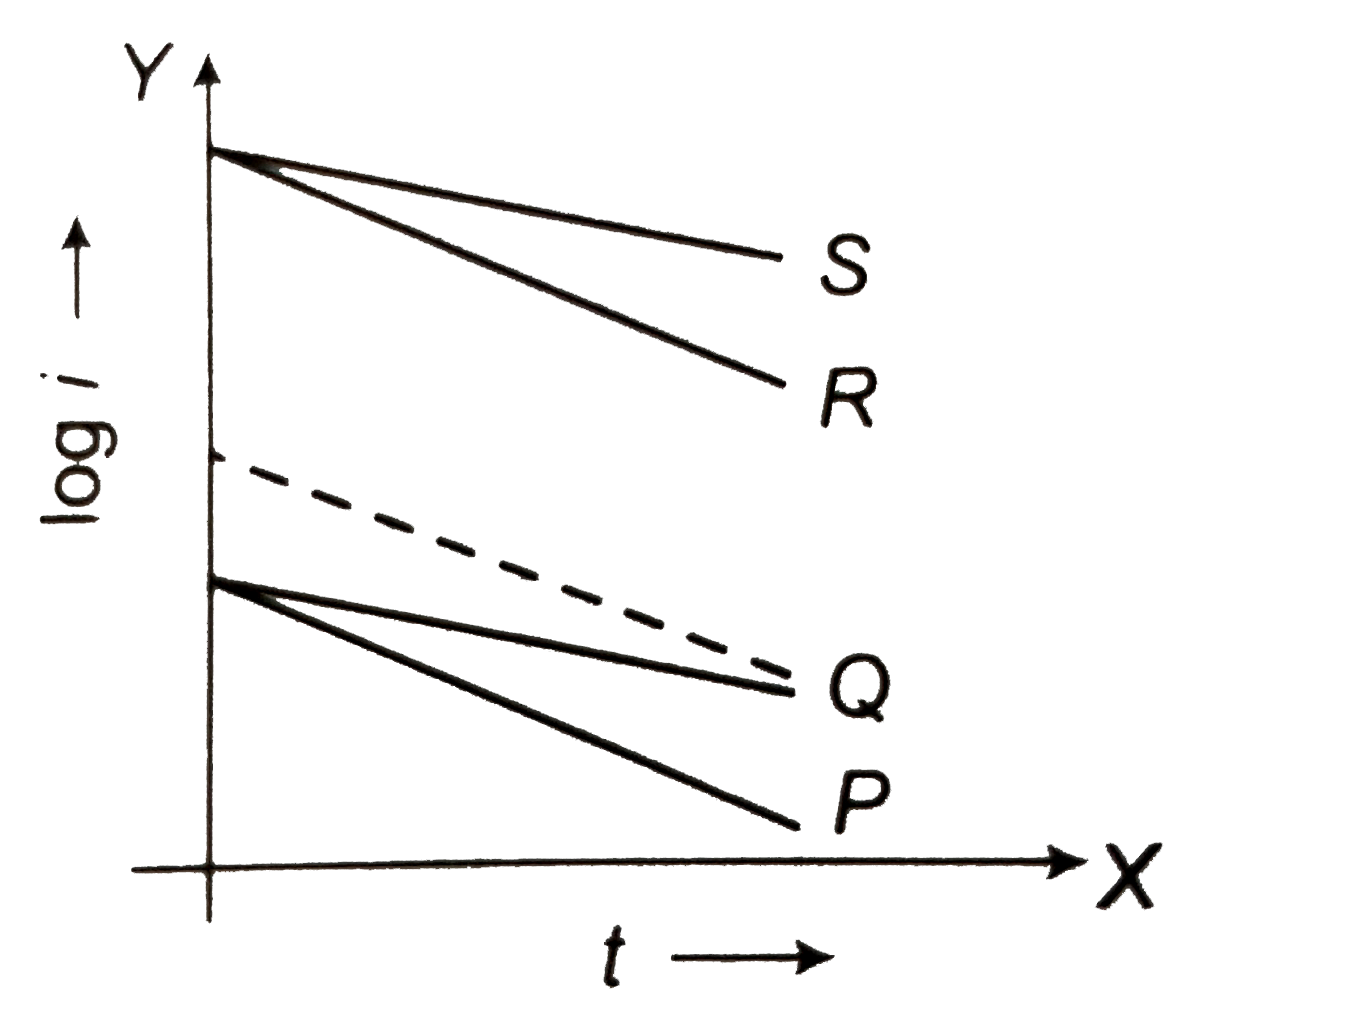
The correct Answer is:R
Step by step video, text & image solution for In an RC circuit while charging, the graph of 1n i versis time is as shown by the dotted line in the diagram figure. Where i is the current. When the value of the resistance is doubled, which of the solid curve best represents the variation of 1n i versus time by Physics experts to help you in doubts & scoring excellent marks in Class 12 exams.
Topper's Solved these Questions
- BOOK - MOTIONCHAPTER - Capacitance EXERCISE - EXERCISE -4 LEVEL 115videos
Capacitance
- BOOK - MOTIONCHAPTER - Capacitance EXERCISE - EXERCISE -4 LEVEL II19videos
Capacitance
- BOOK - MOTIONCHAPTER - Capacitance EXERCISE - EXERCISE -3 LEVEL 131videos
Capacitance
- BOOK - MOTIONCHAPTER - CALORIMETRY EXERCISE - EXERCISE - 3 Section - B4videos
CALORIMETRY
- BOOK - MOTIONCHAPTER - CENTRE OF MASSEXERCISE - Exercise - 4 Level-II20videos
CENTRE OF MASS
Similar Questions
Knowledge Check
- Question 1 - Select One
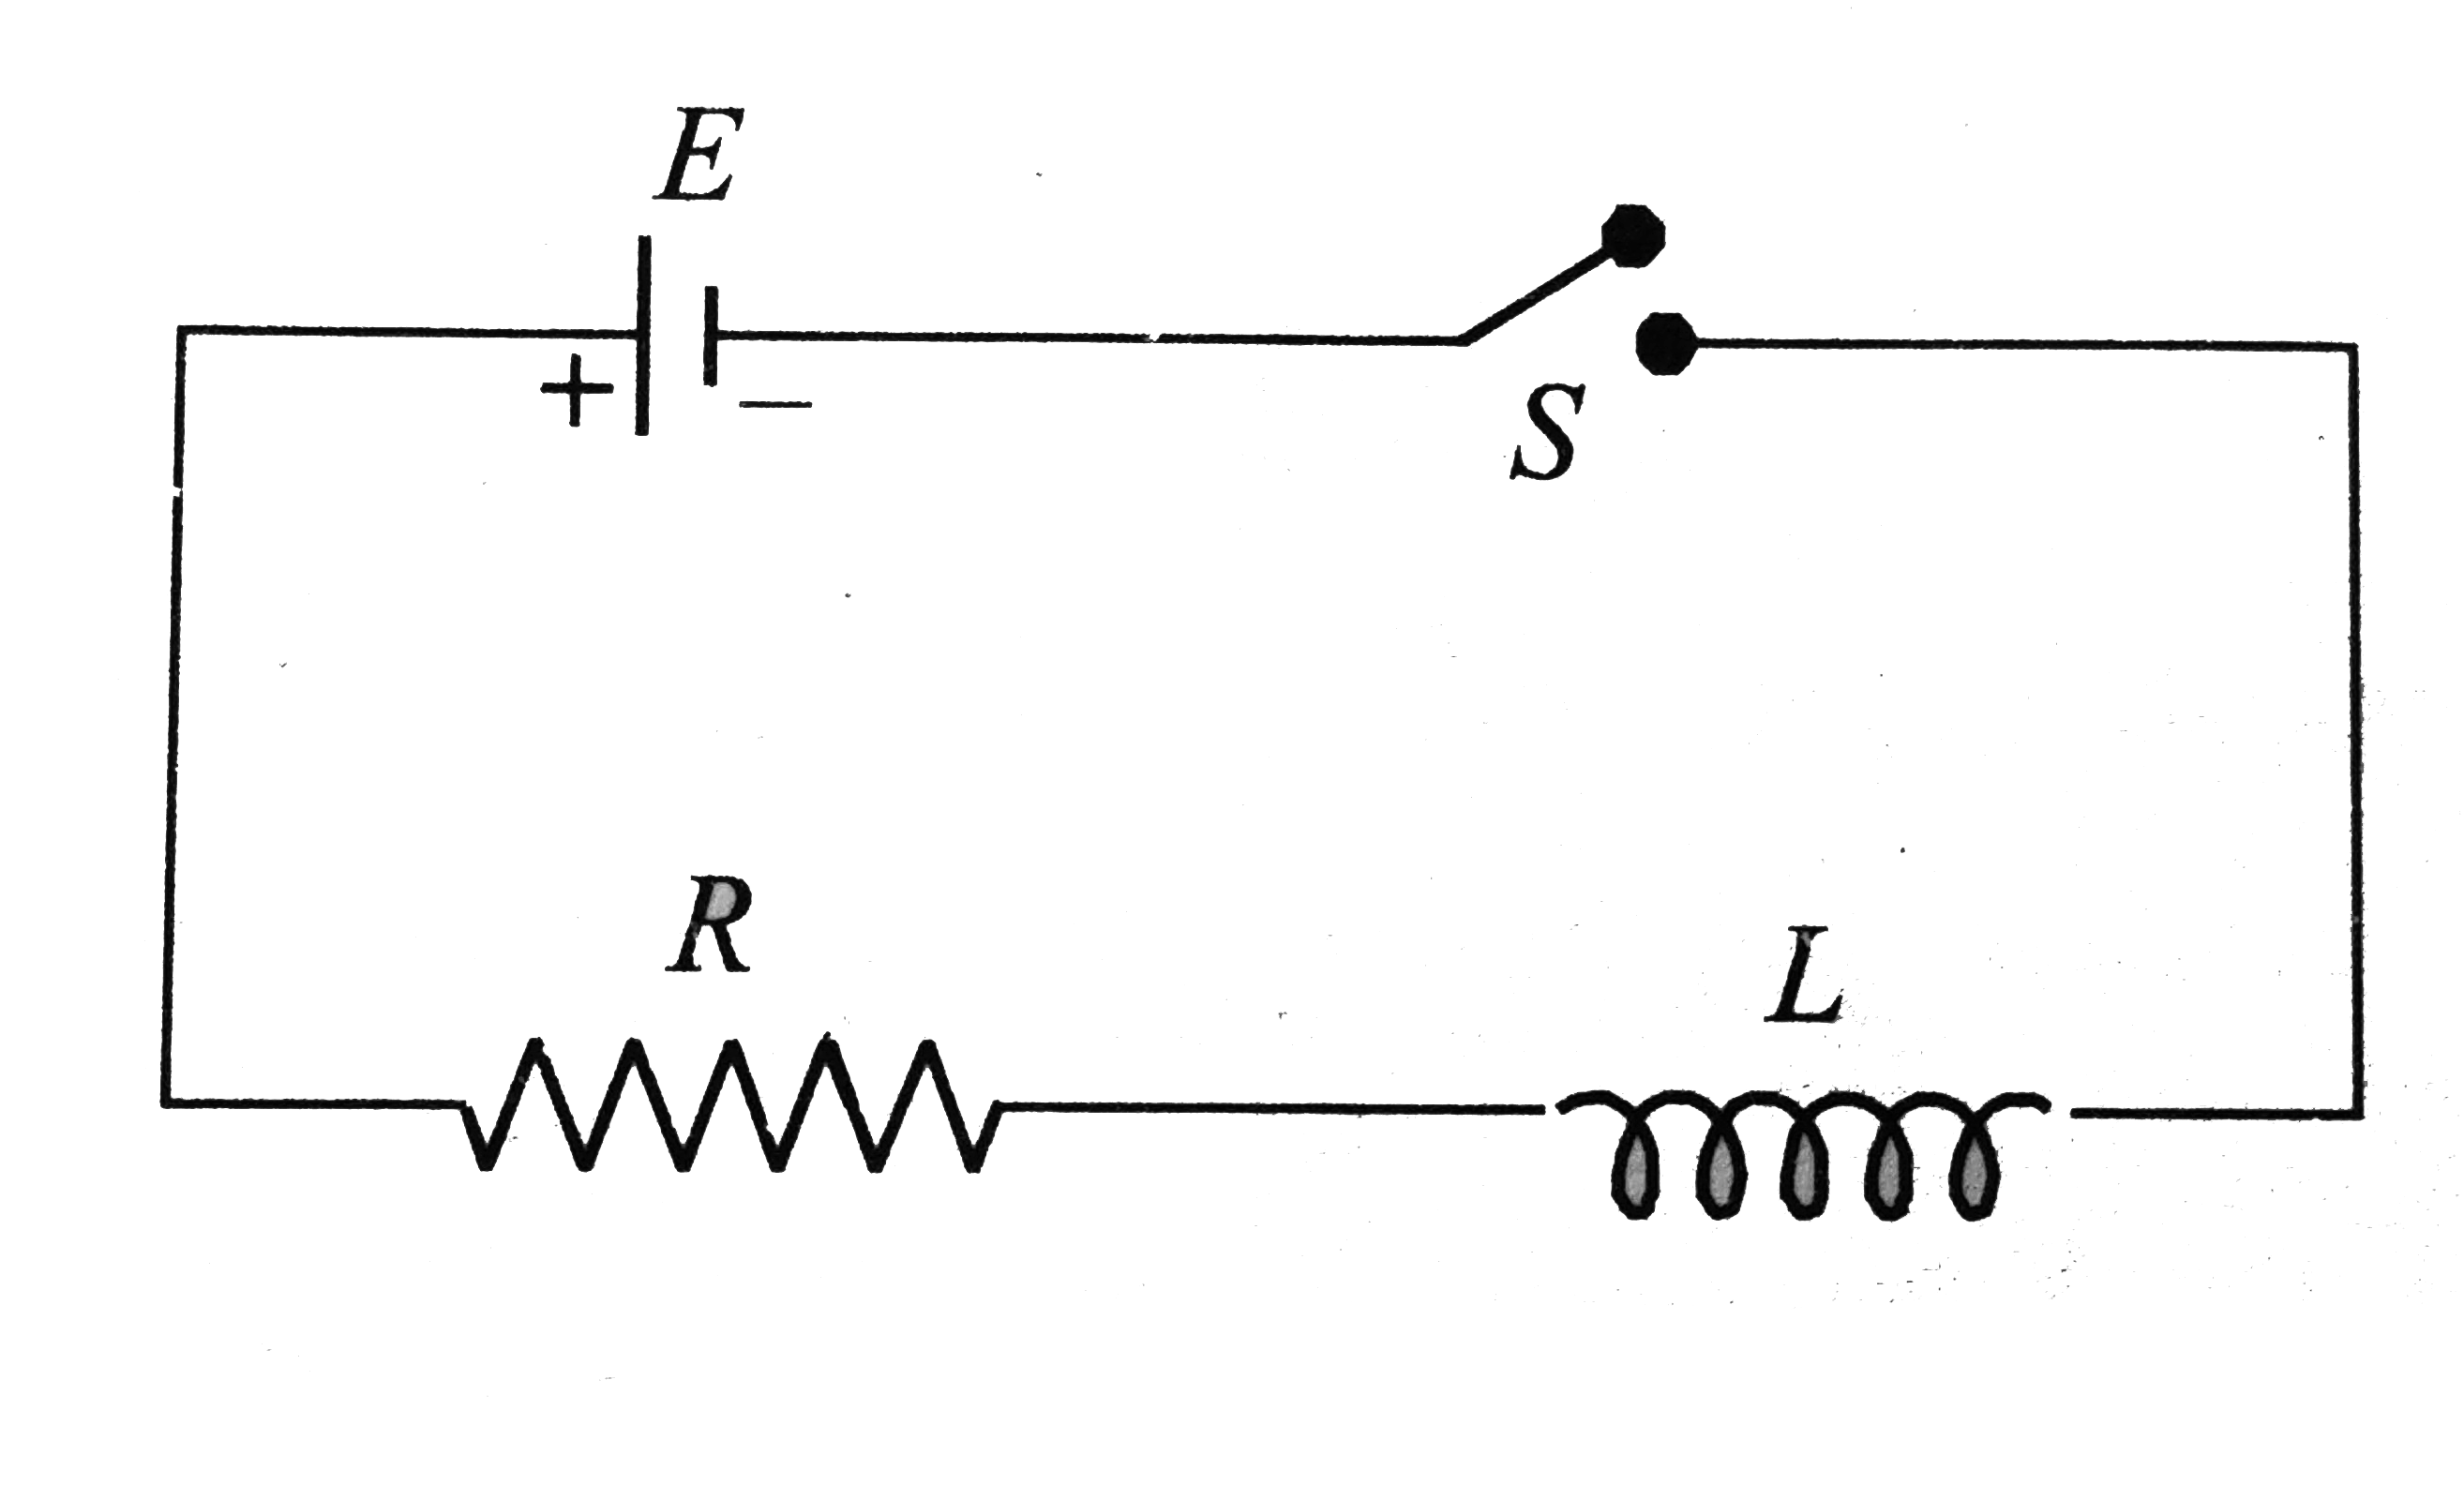
Switch S of the circuit shows in Fig. is closed at t=0. If e denotes the induced emf in L and i the current flowing through the circuit at time t, then which of the following graphs correctly represents the variation of e with i?
 A
A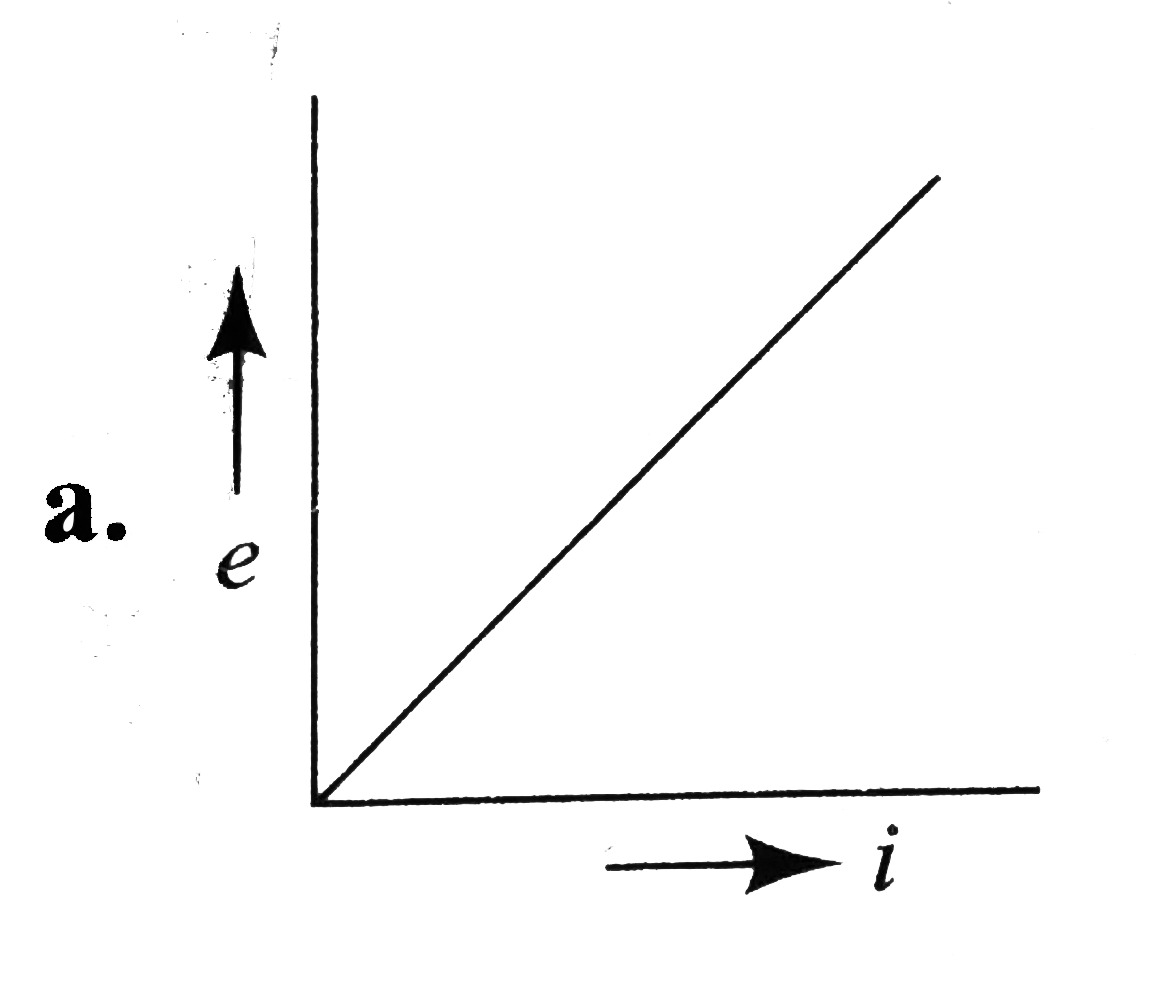 B
B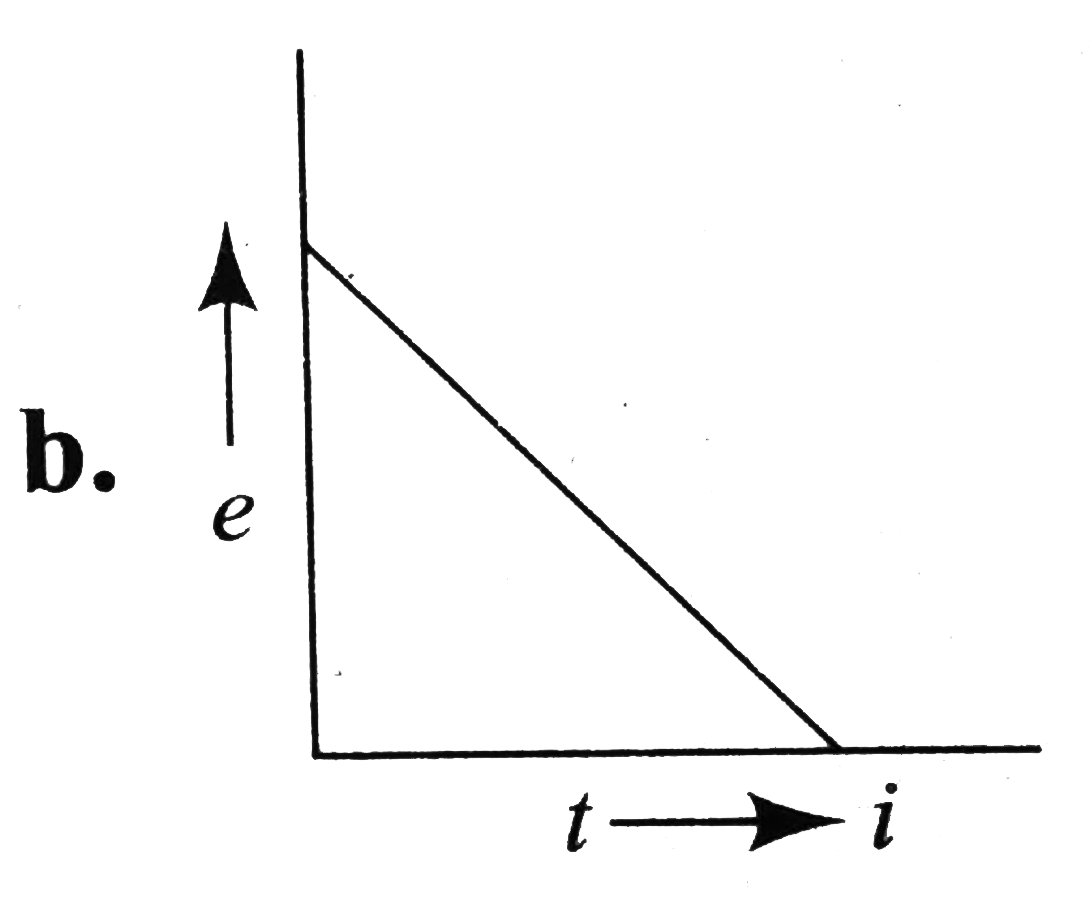 C
C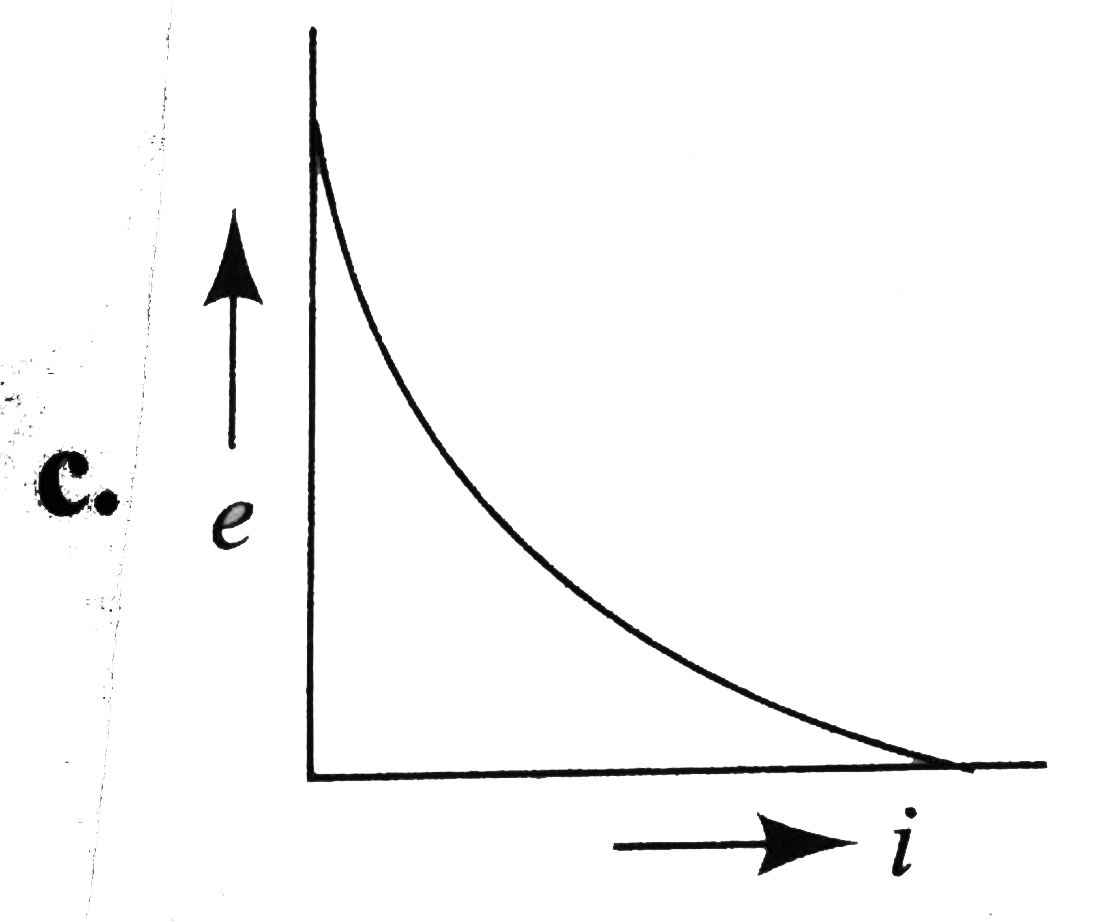 D
D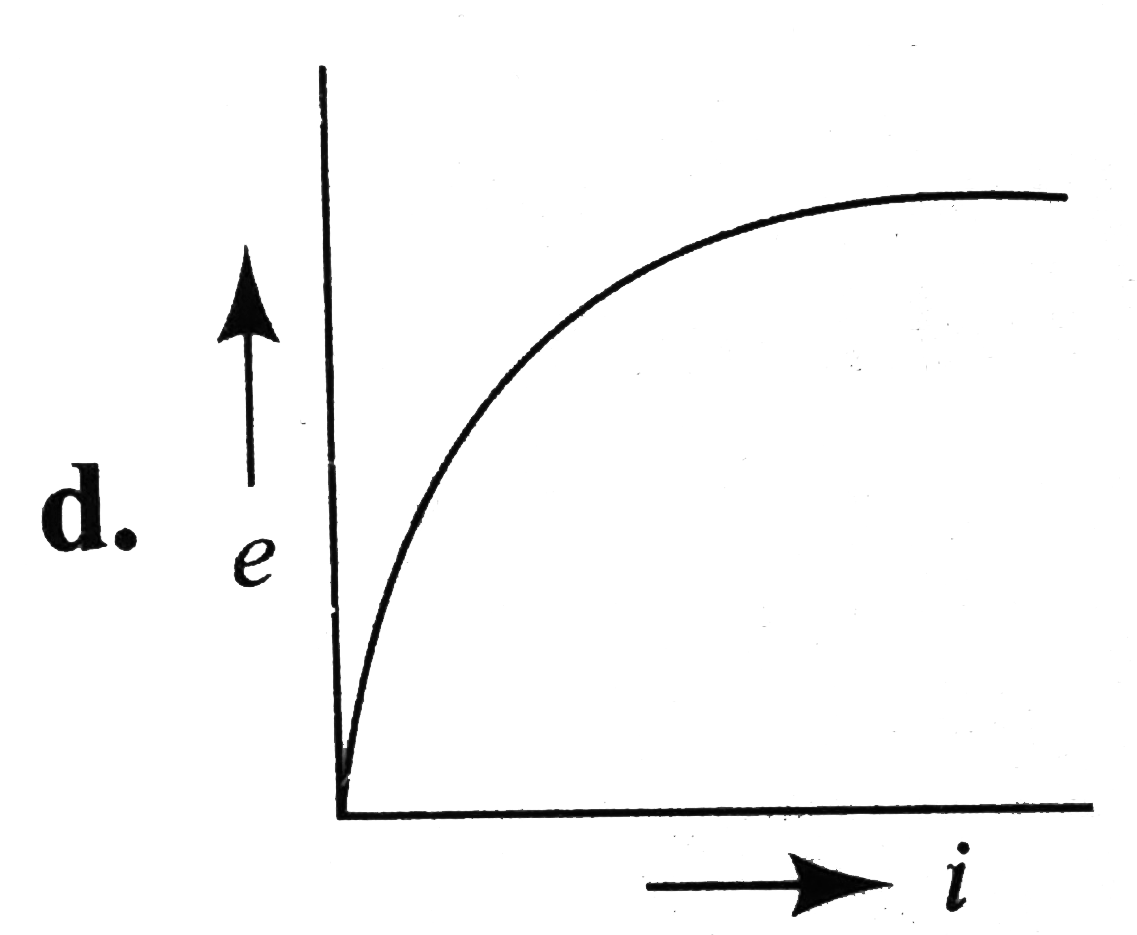
- Question 2 - Select One
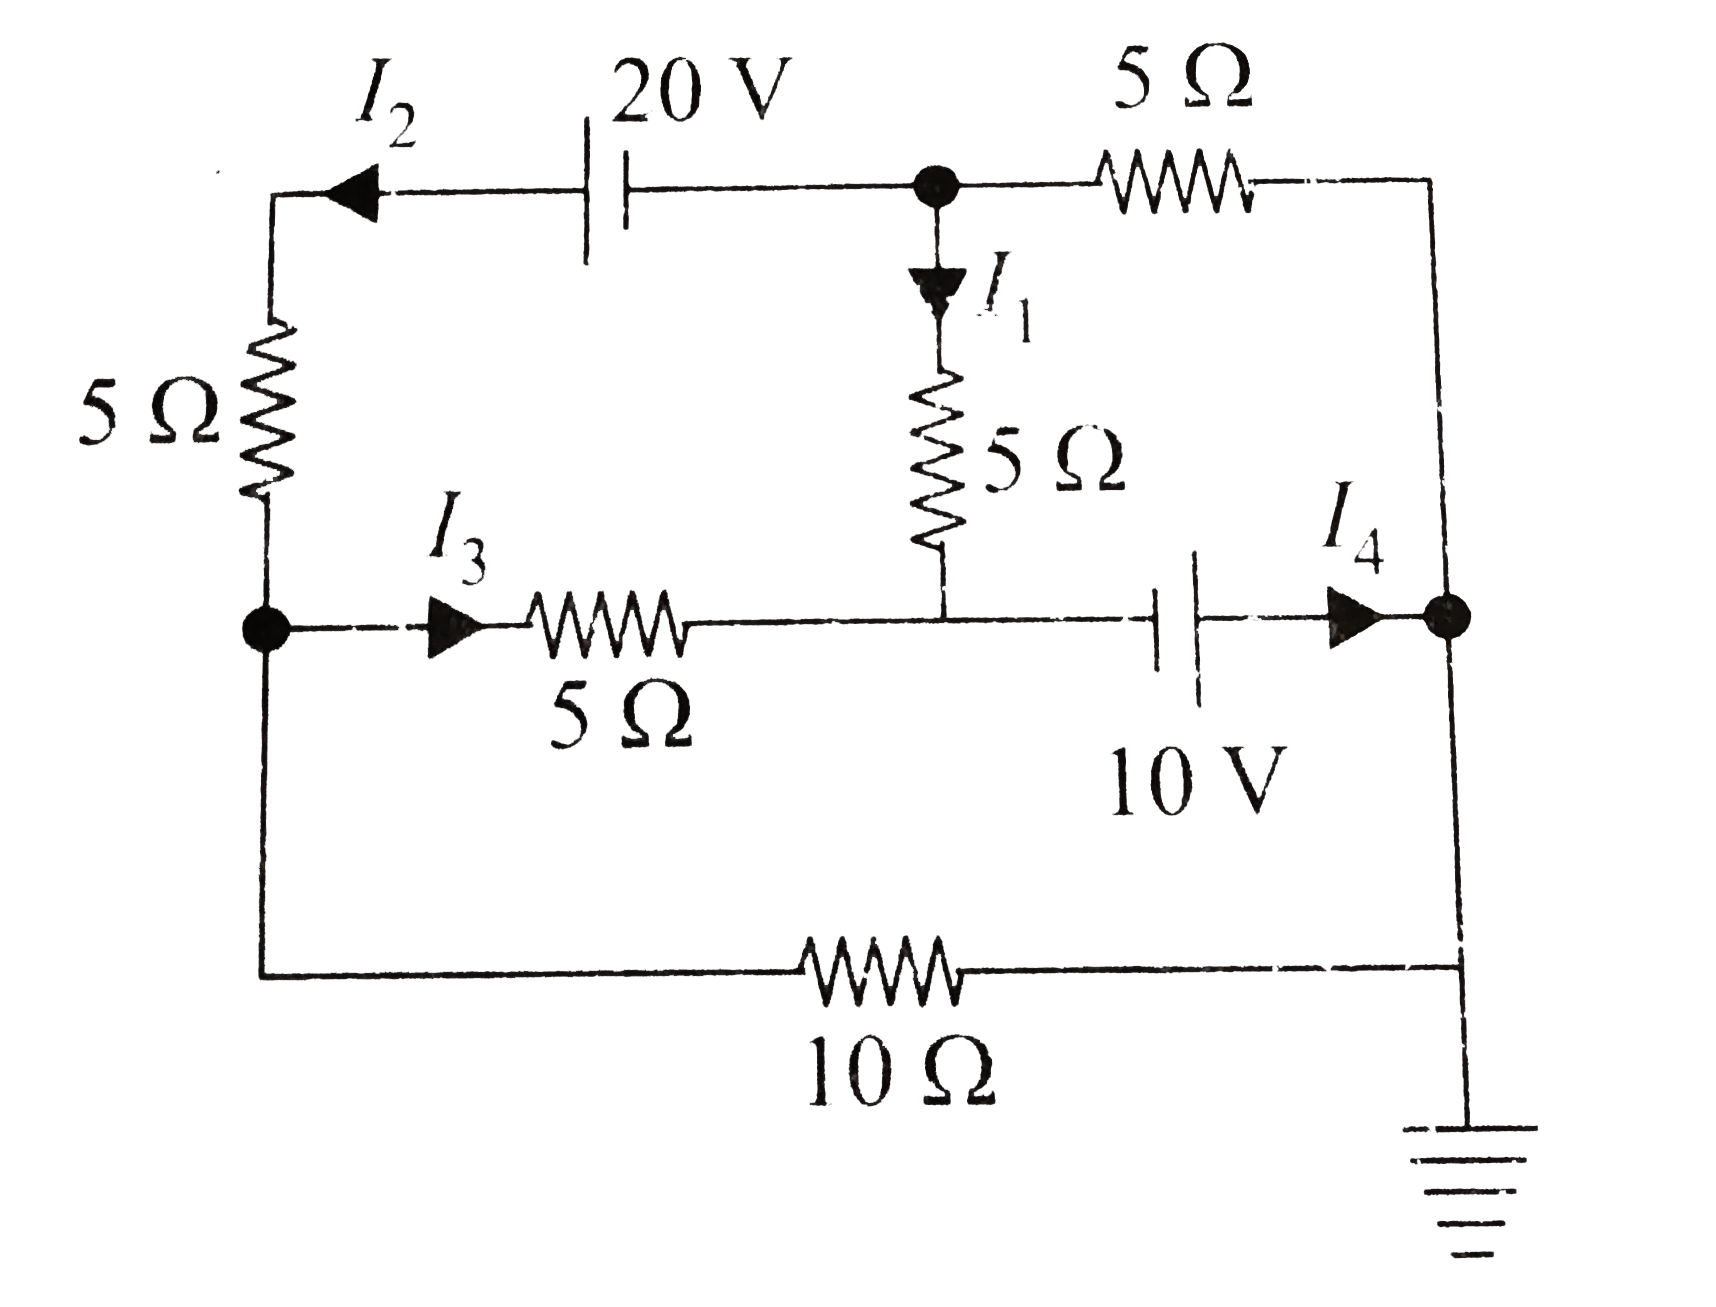
In the circuit shown in the figure
 .
.
The value of current I1 isA2ABzeroC2.5 ADnone of these - Question 3 - Select One
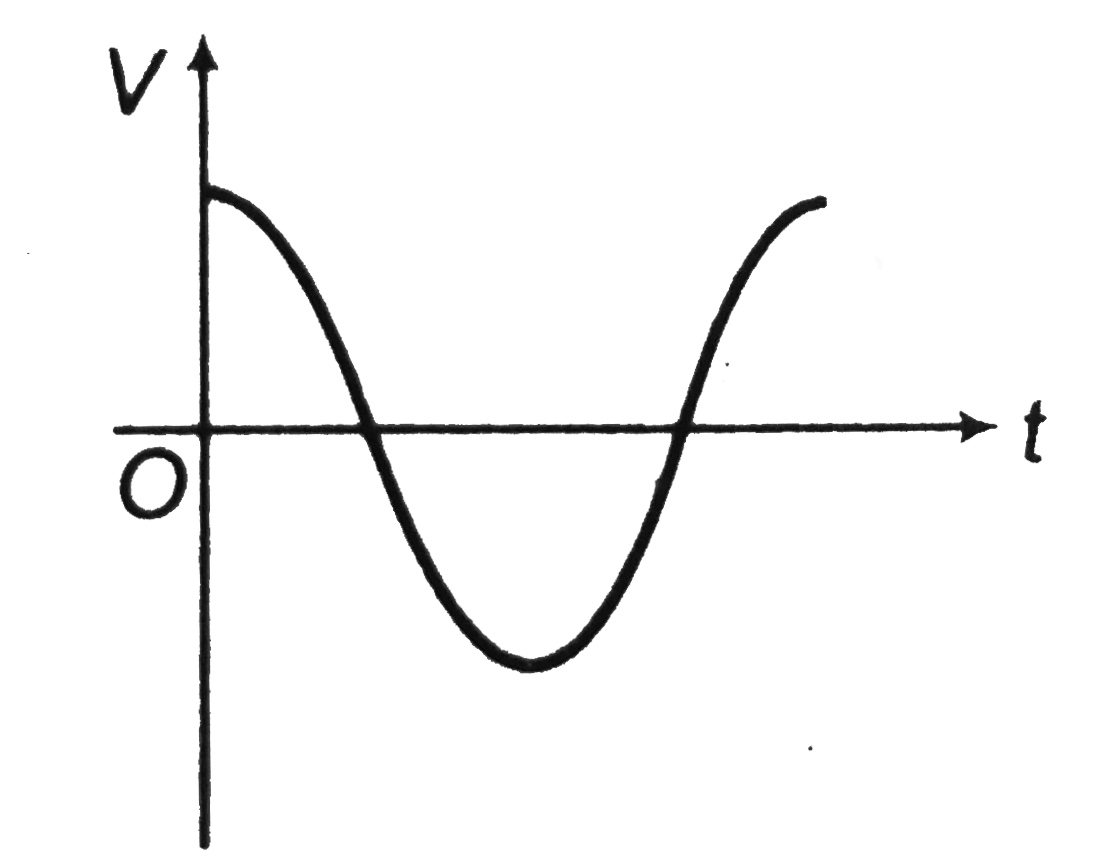
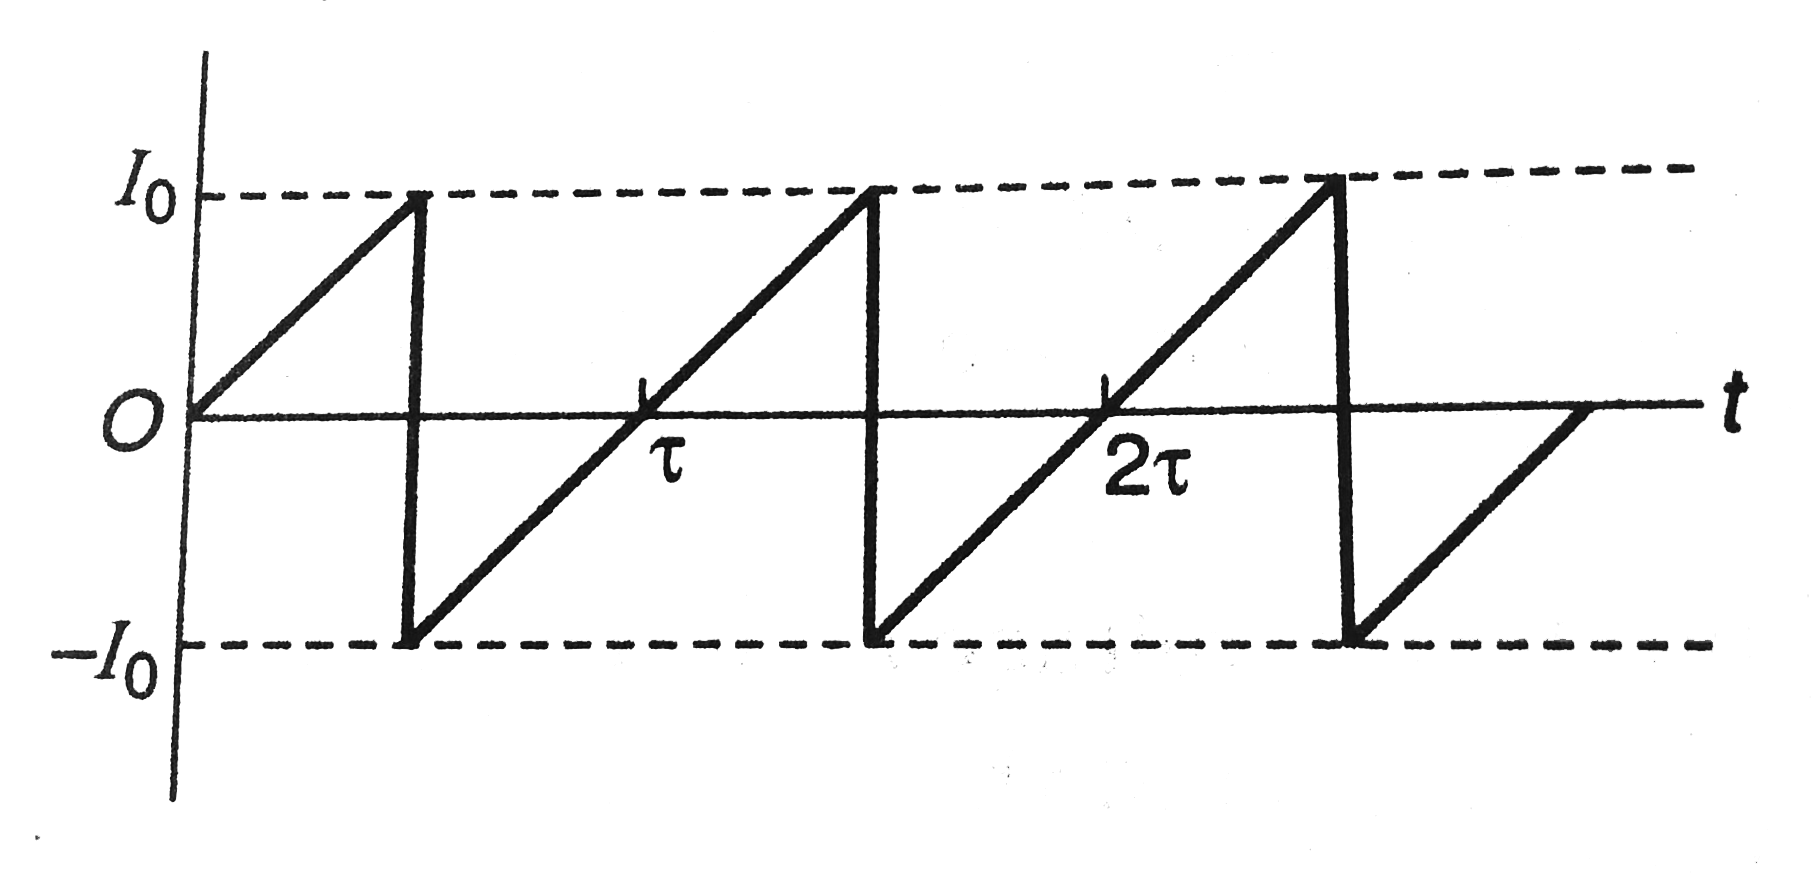
The figure represents the voltage applied across a pure inductor. The diagram which correctly represents the variation of current i with time t is given by
 .A
.A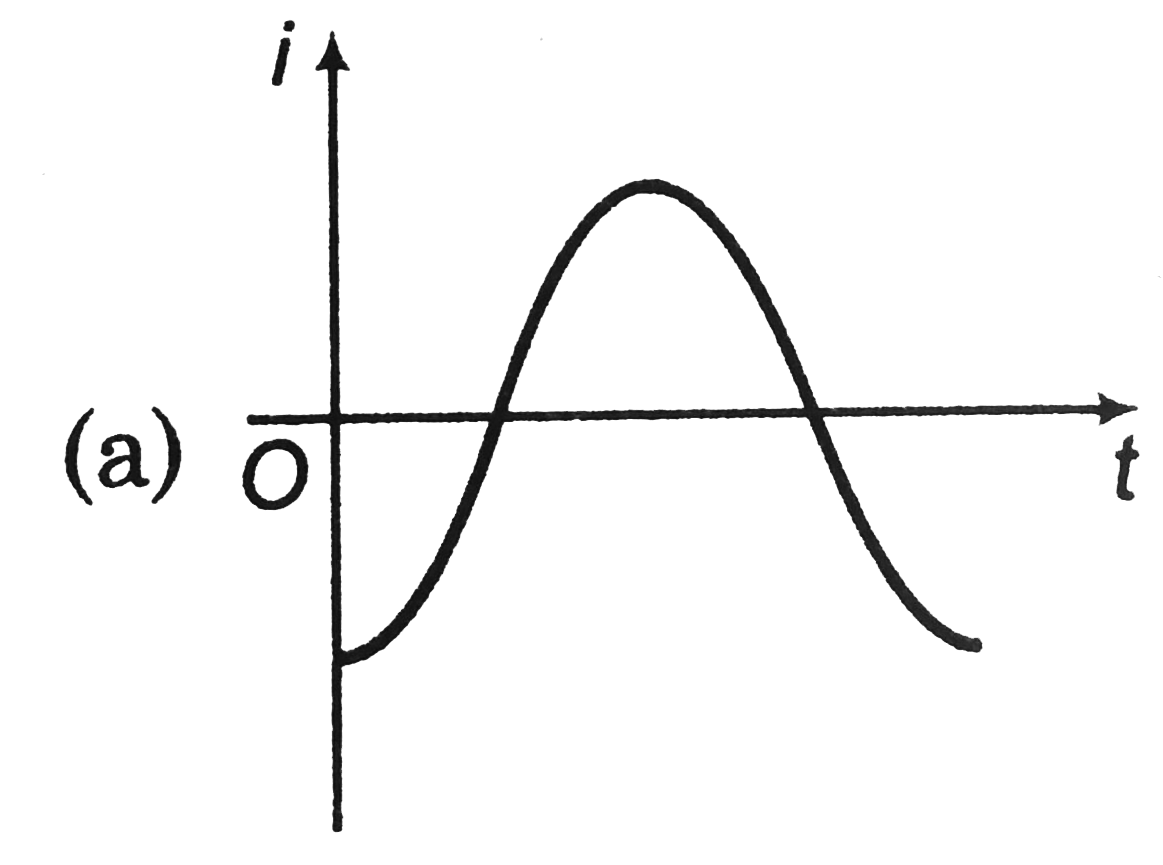 B
B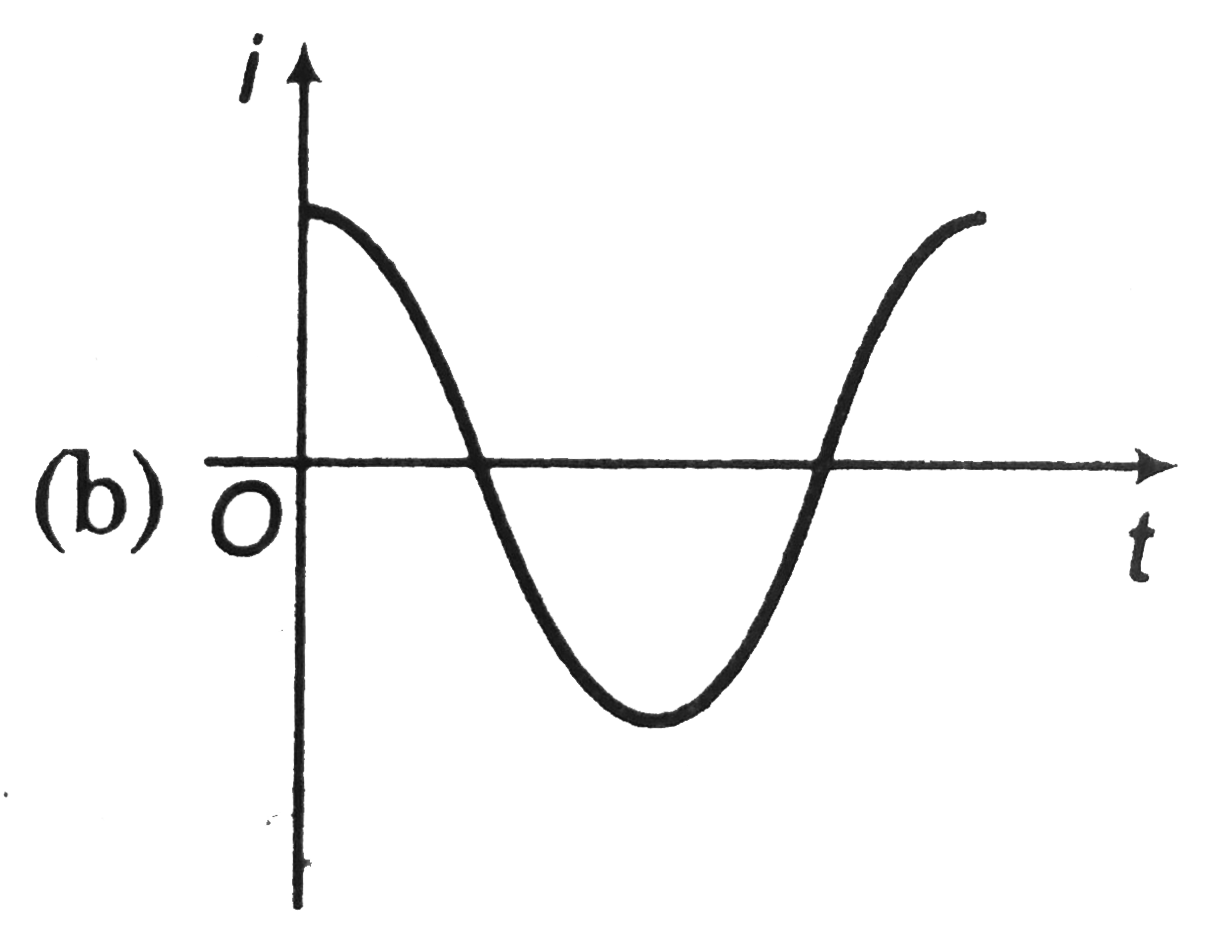 C
C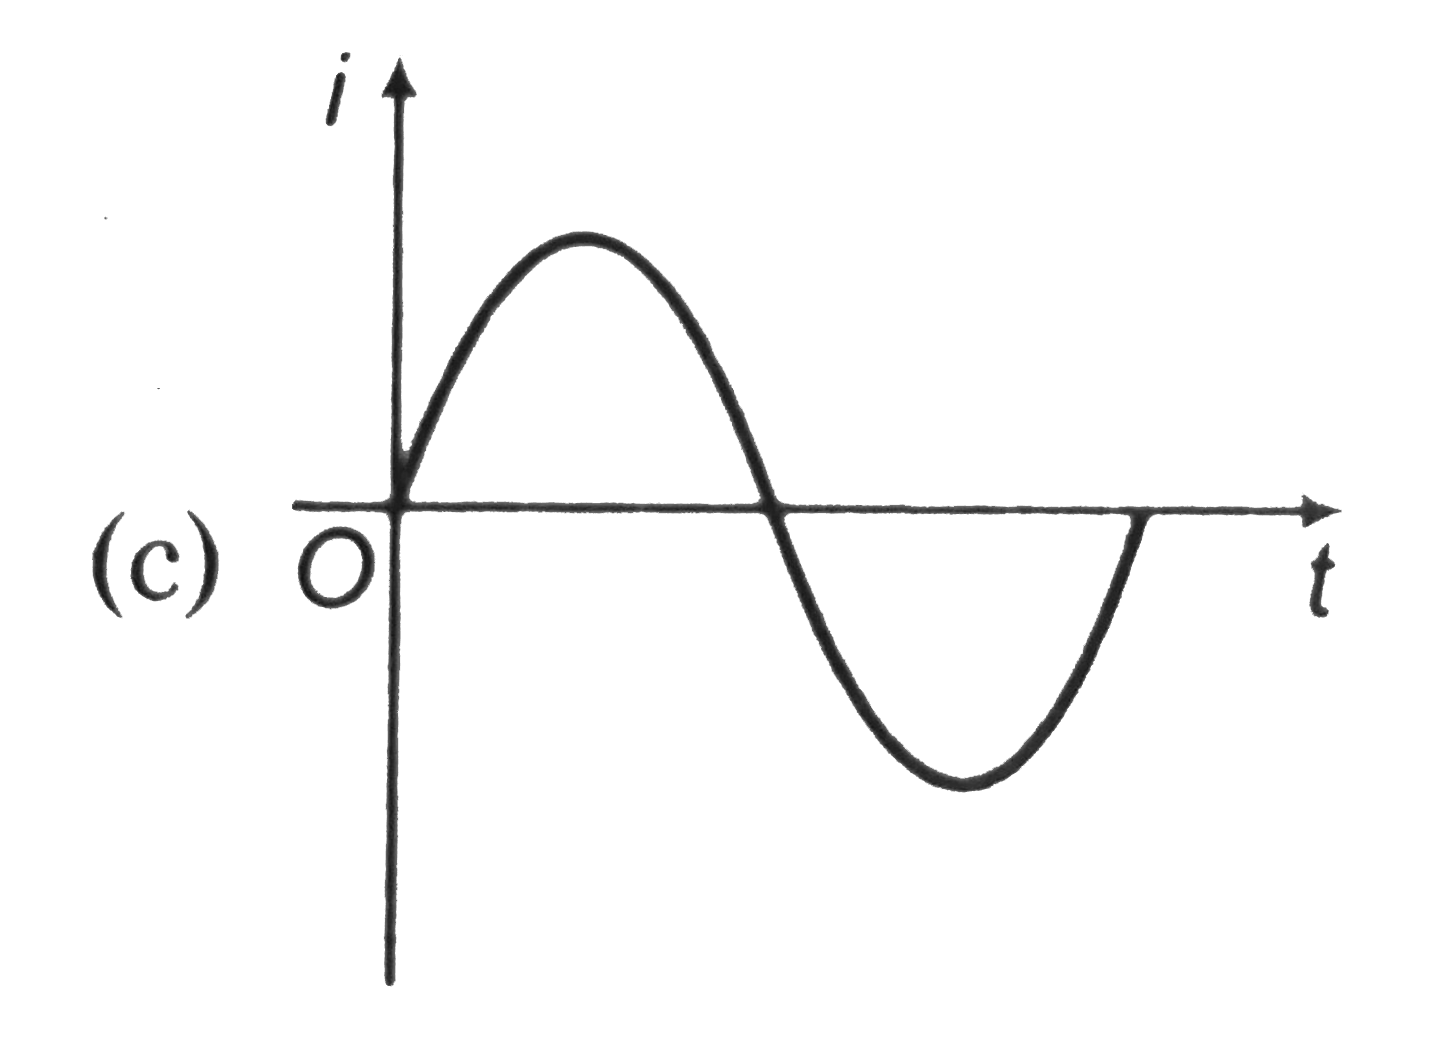 D
D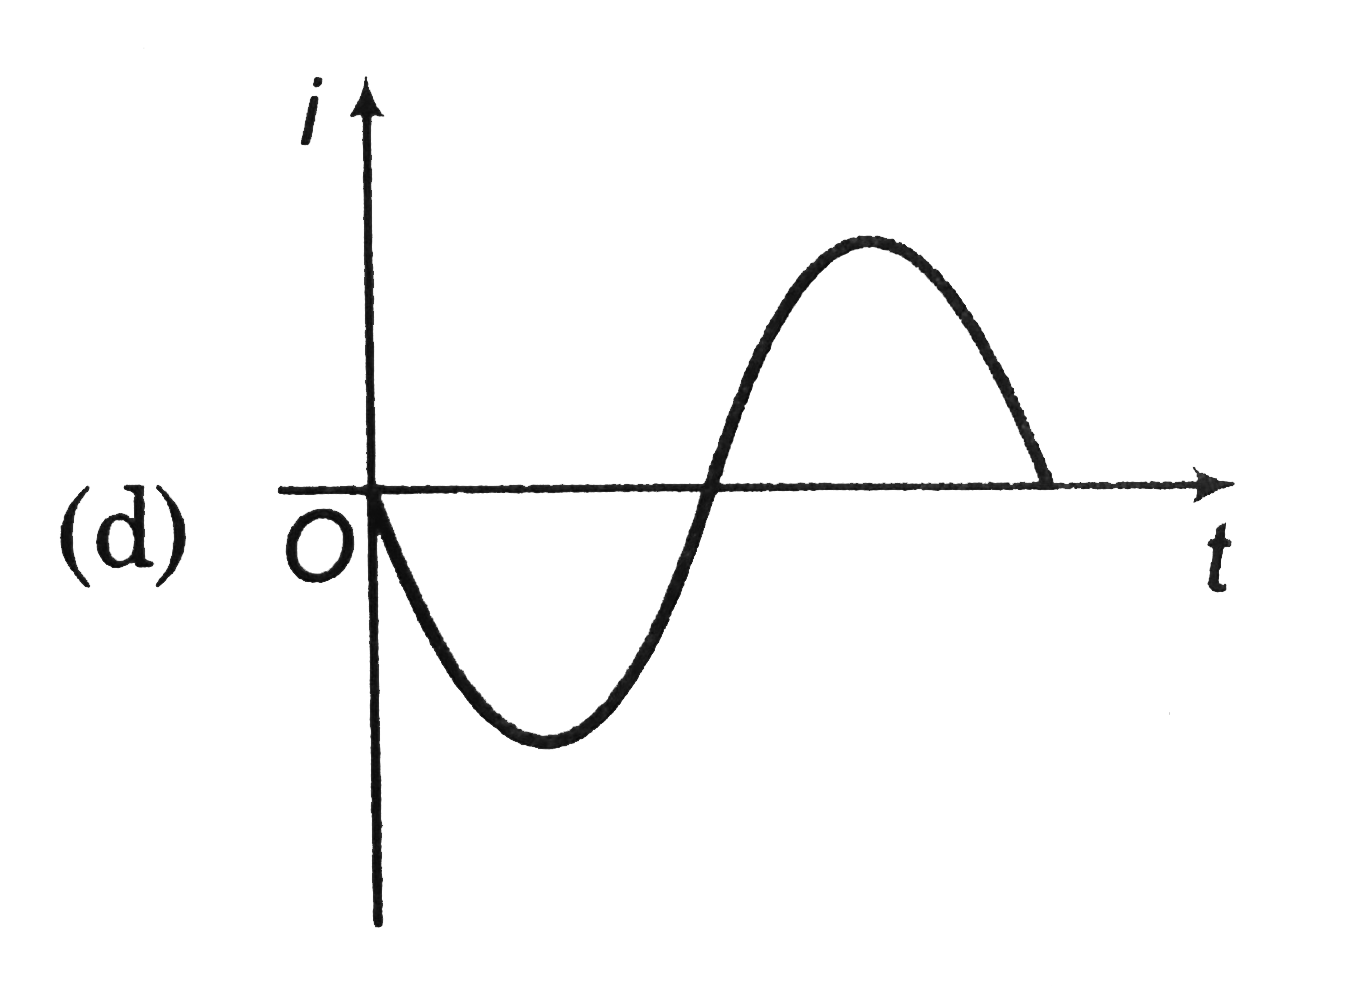
When an electric heater is switched on, the current flowing through it ( i ) is plotted against time ( t ). Taking into account the variation of resistance with temperature, which of the following best represents the resulting curve
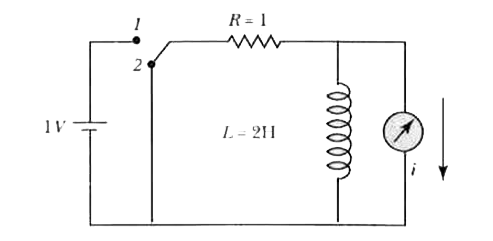
View SolutionIn the circuit shown in the following figure, the switch is moved to position 1 at t = 0. Which of the following most closely represents the current I as a function of time?
 View Solution
In an L-R circuit connected to a battery of constant emf E, switched is closed at time t=0. If denotes the induced emf across inductor and I the current in the circuit at any time t. Then which of the following graphs shown the variation of e with i?
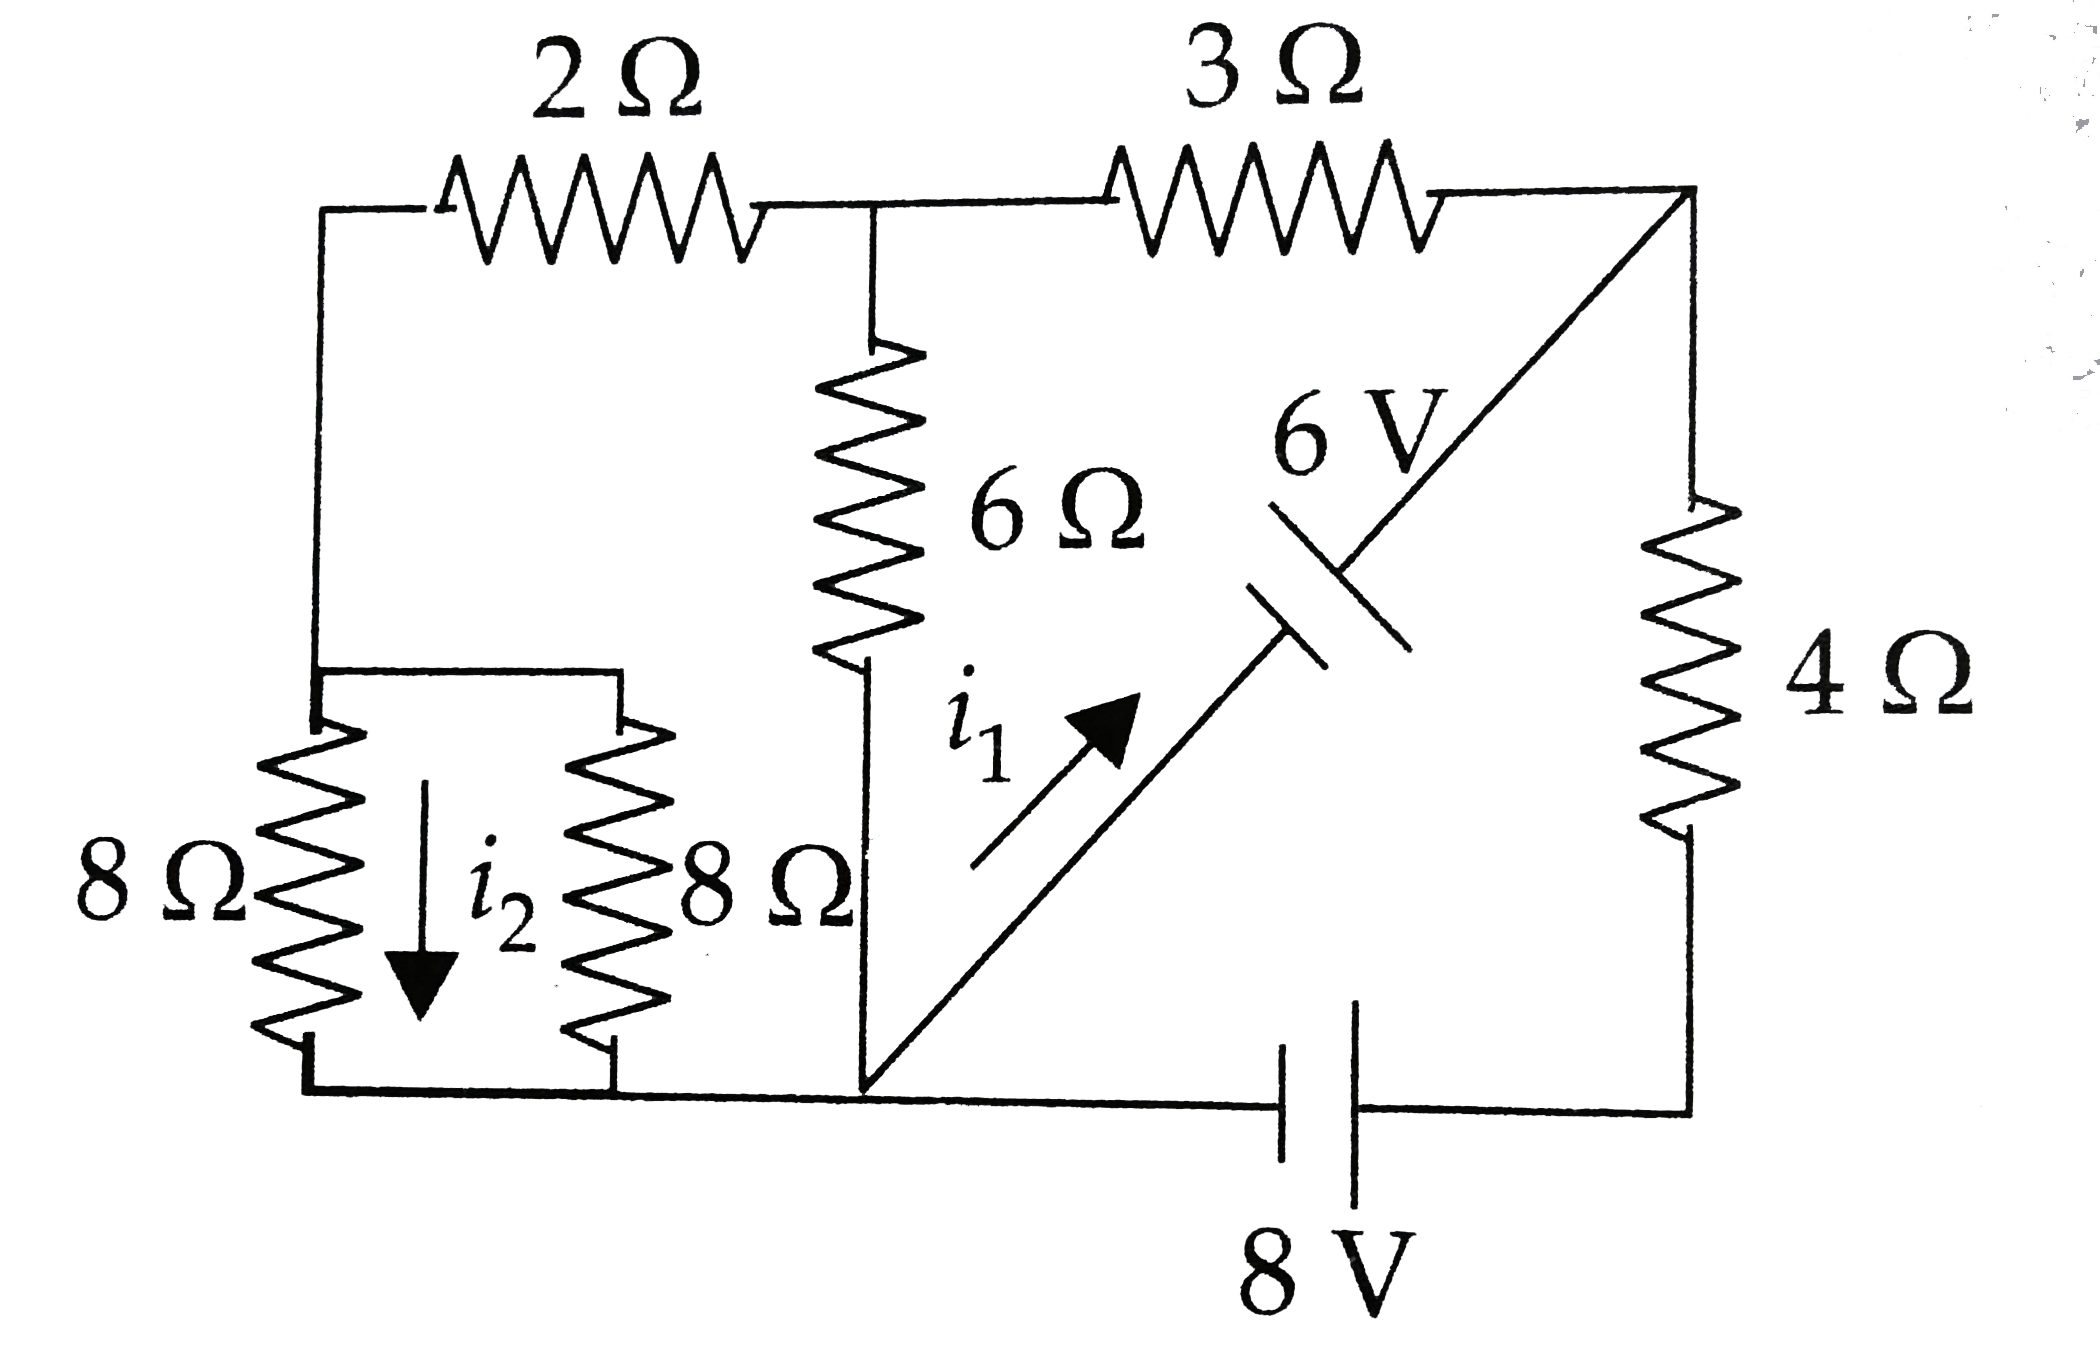
View SolutionIn the circuit as shown in figure, the ratio of current i1/i2 is
 View Solution
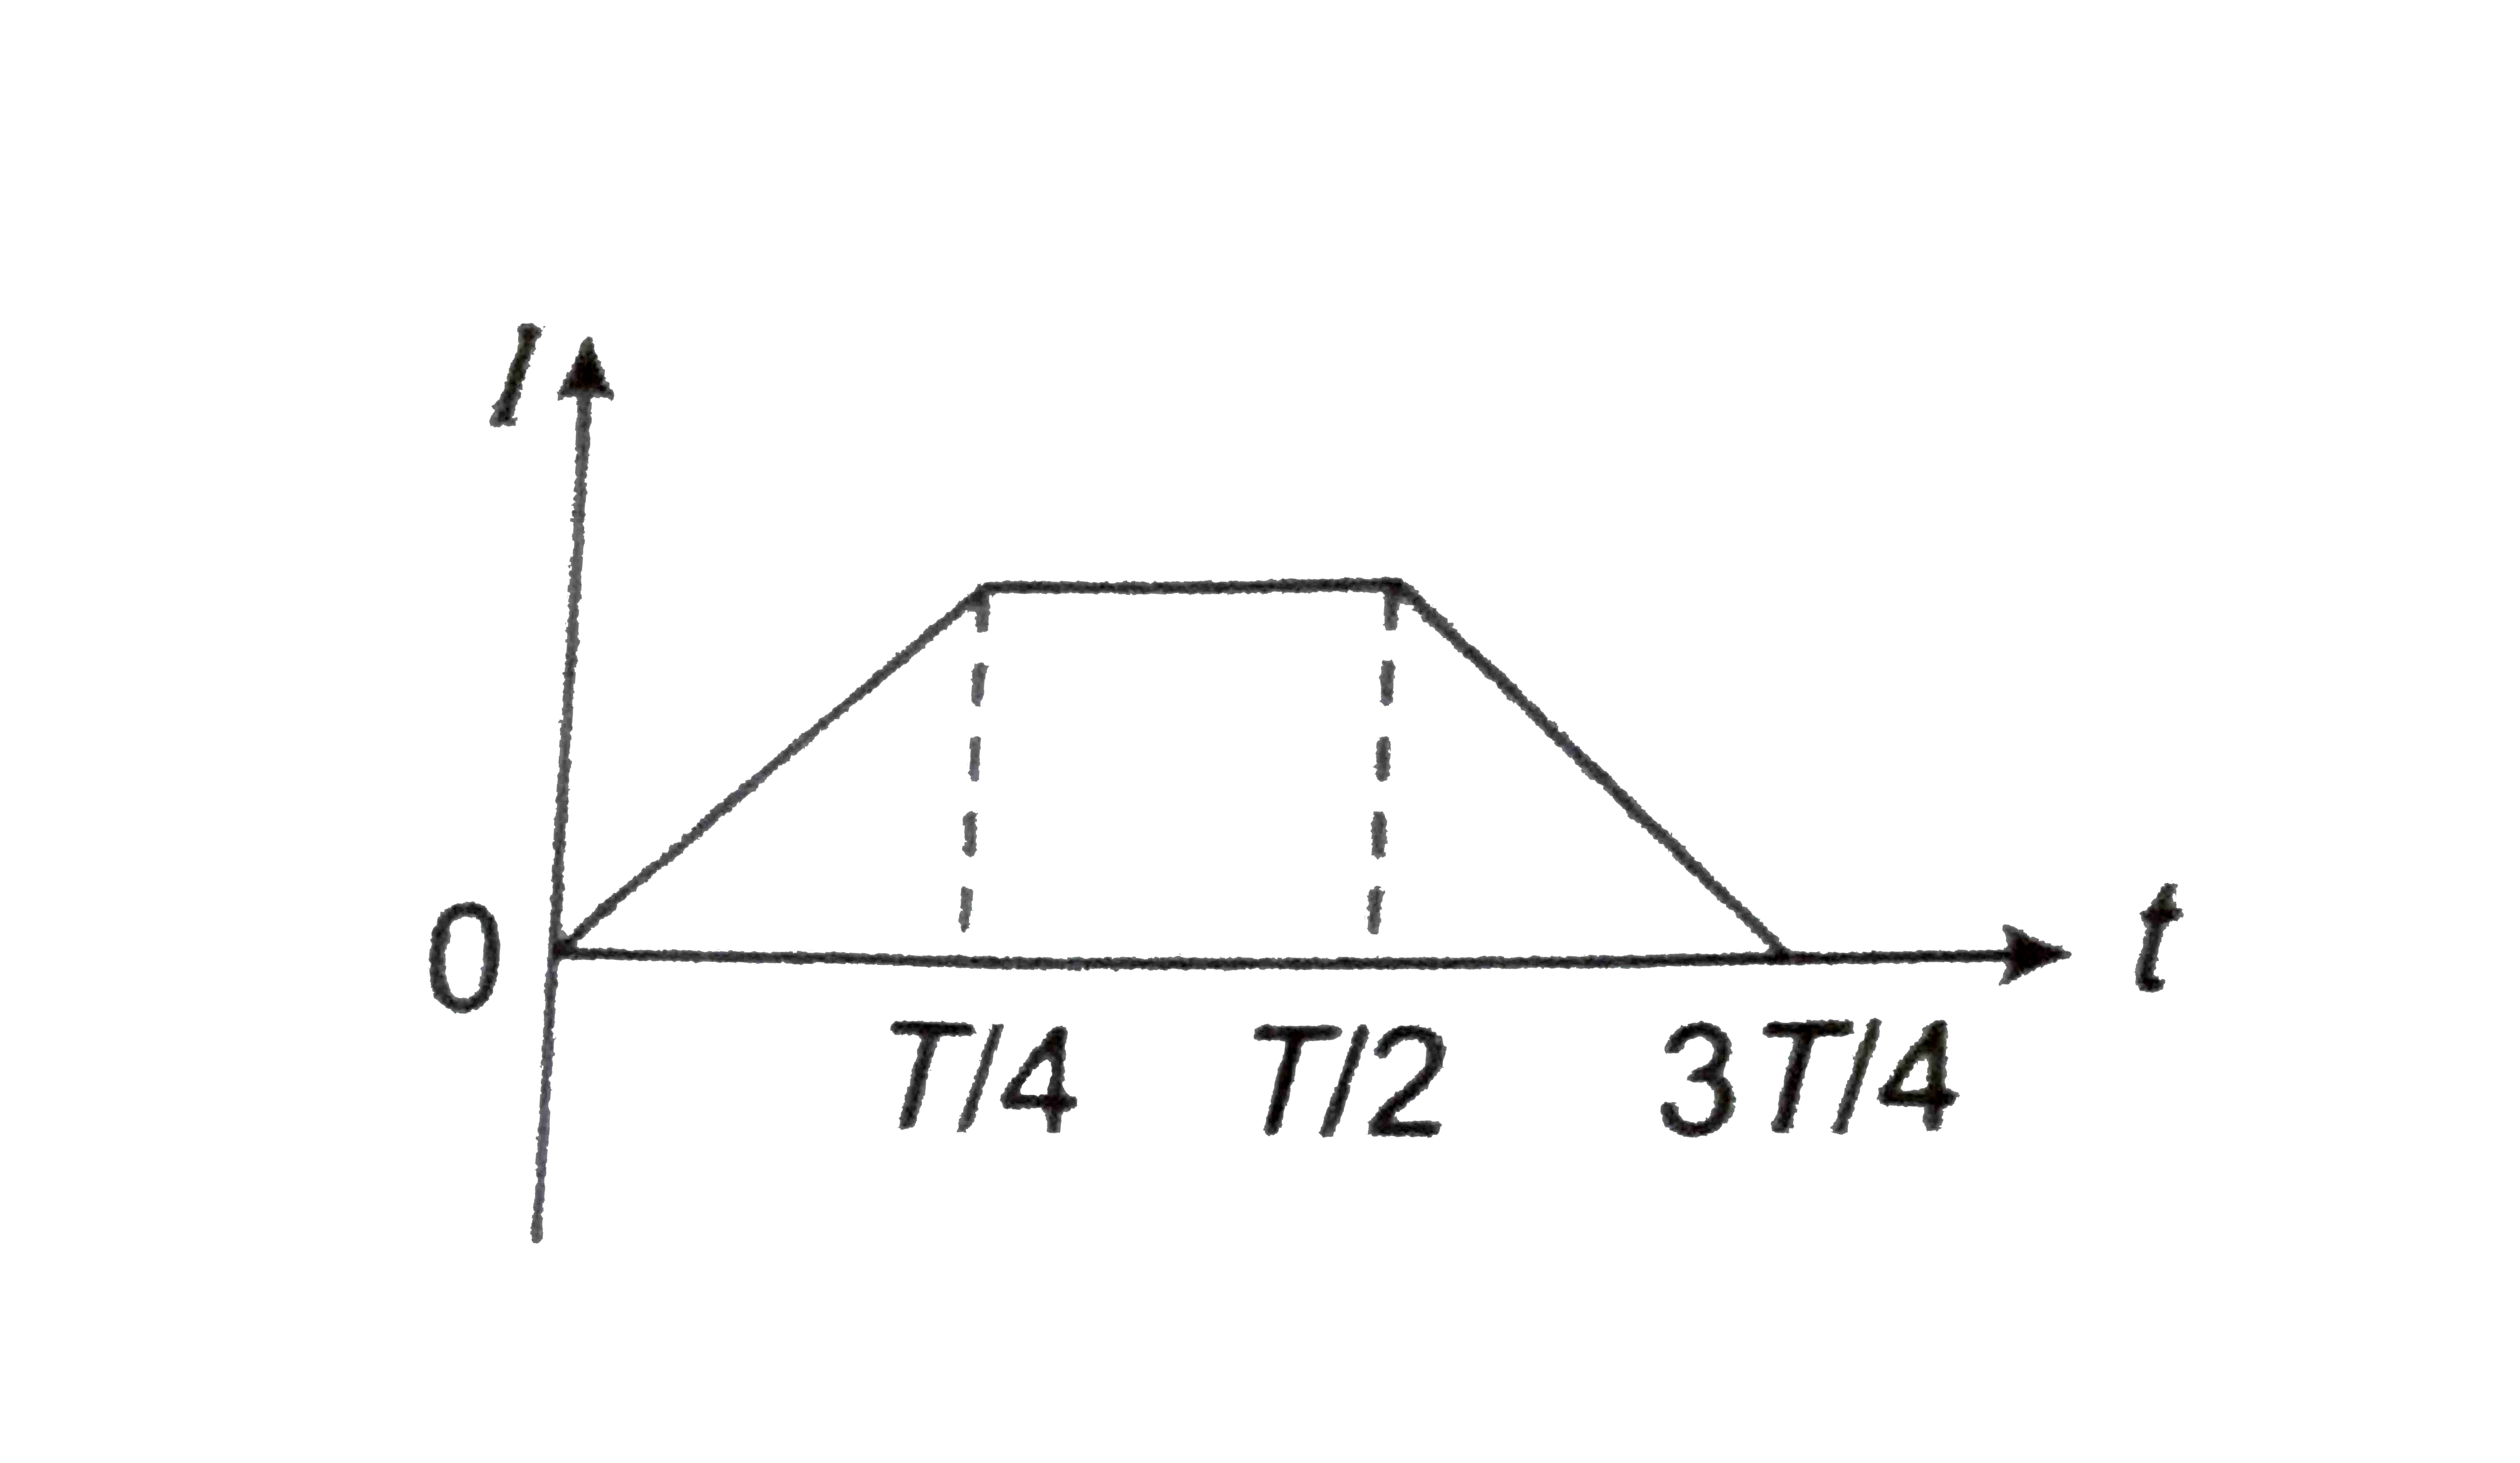
The current i in a coil varies with time as shown in the figure. The variation of induced emf with time would be
 View Solution

 .
.