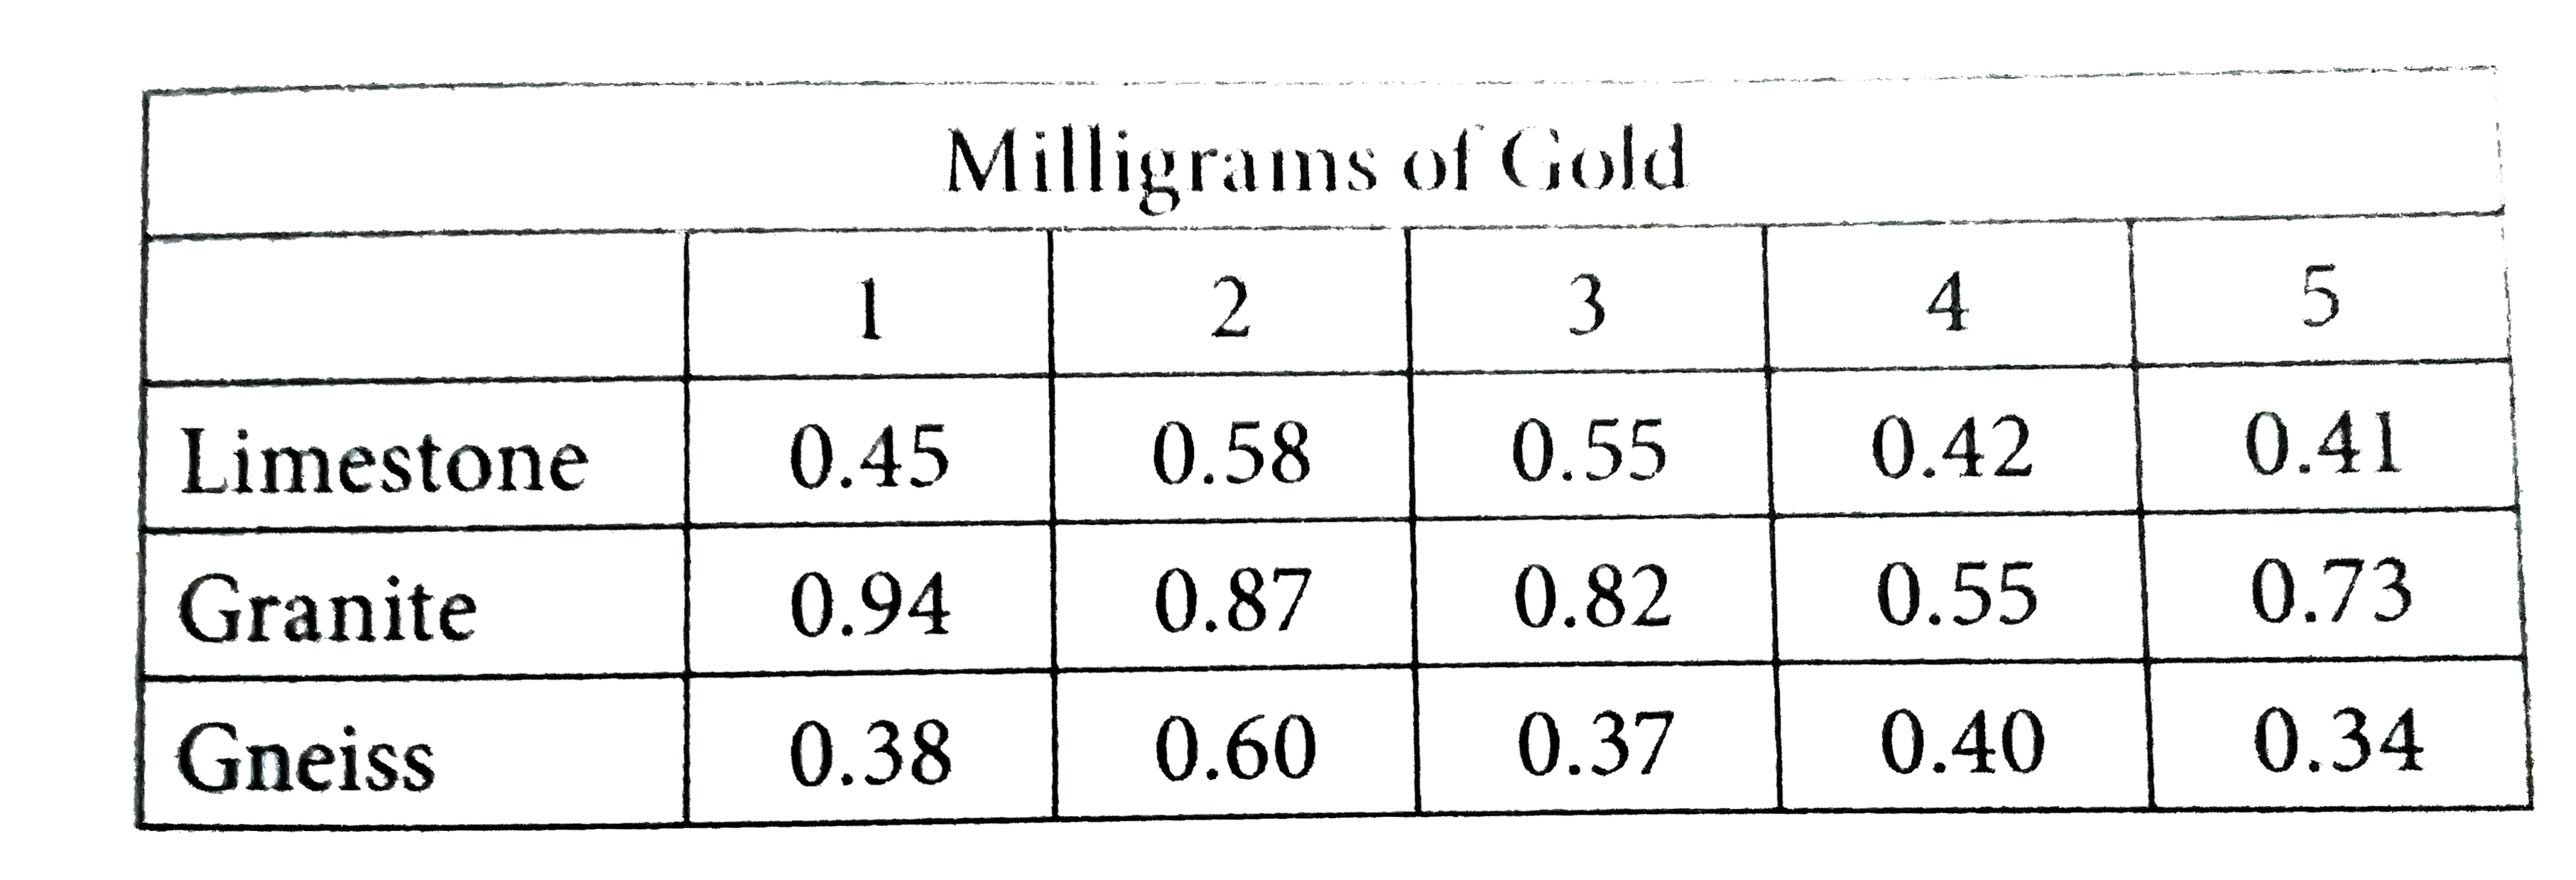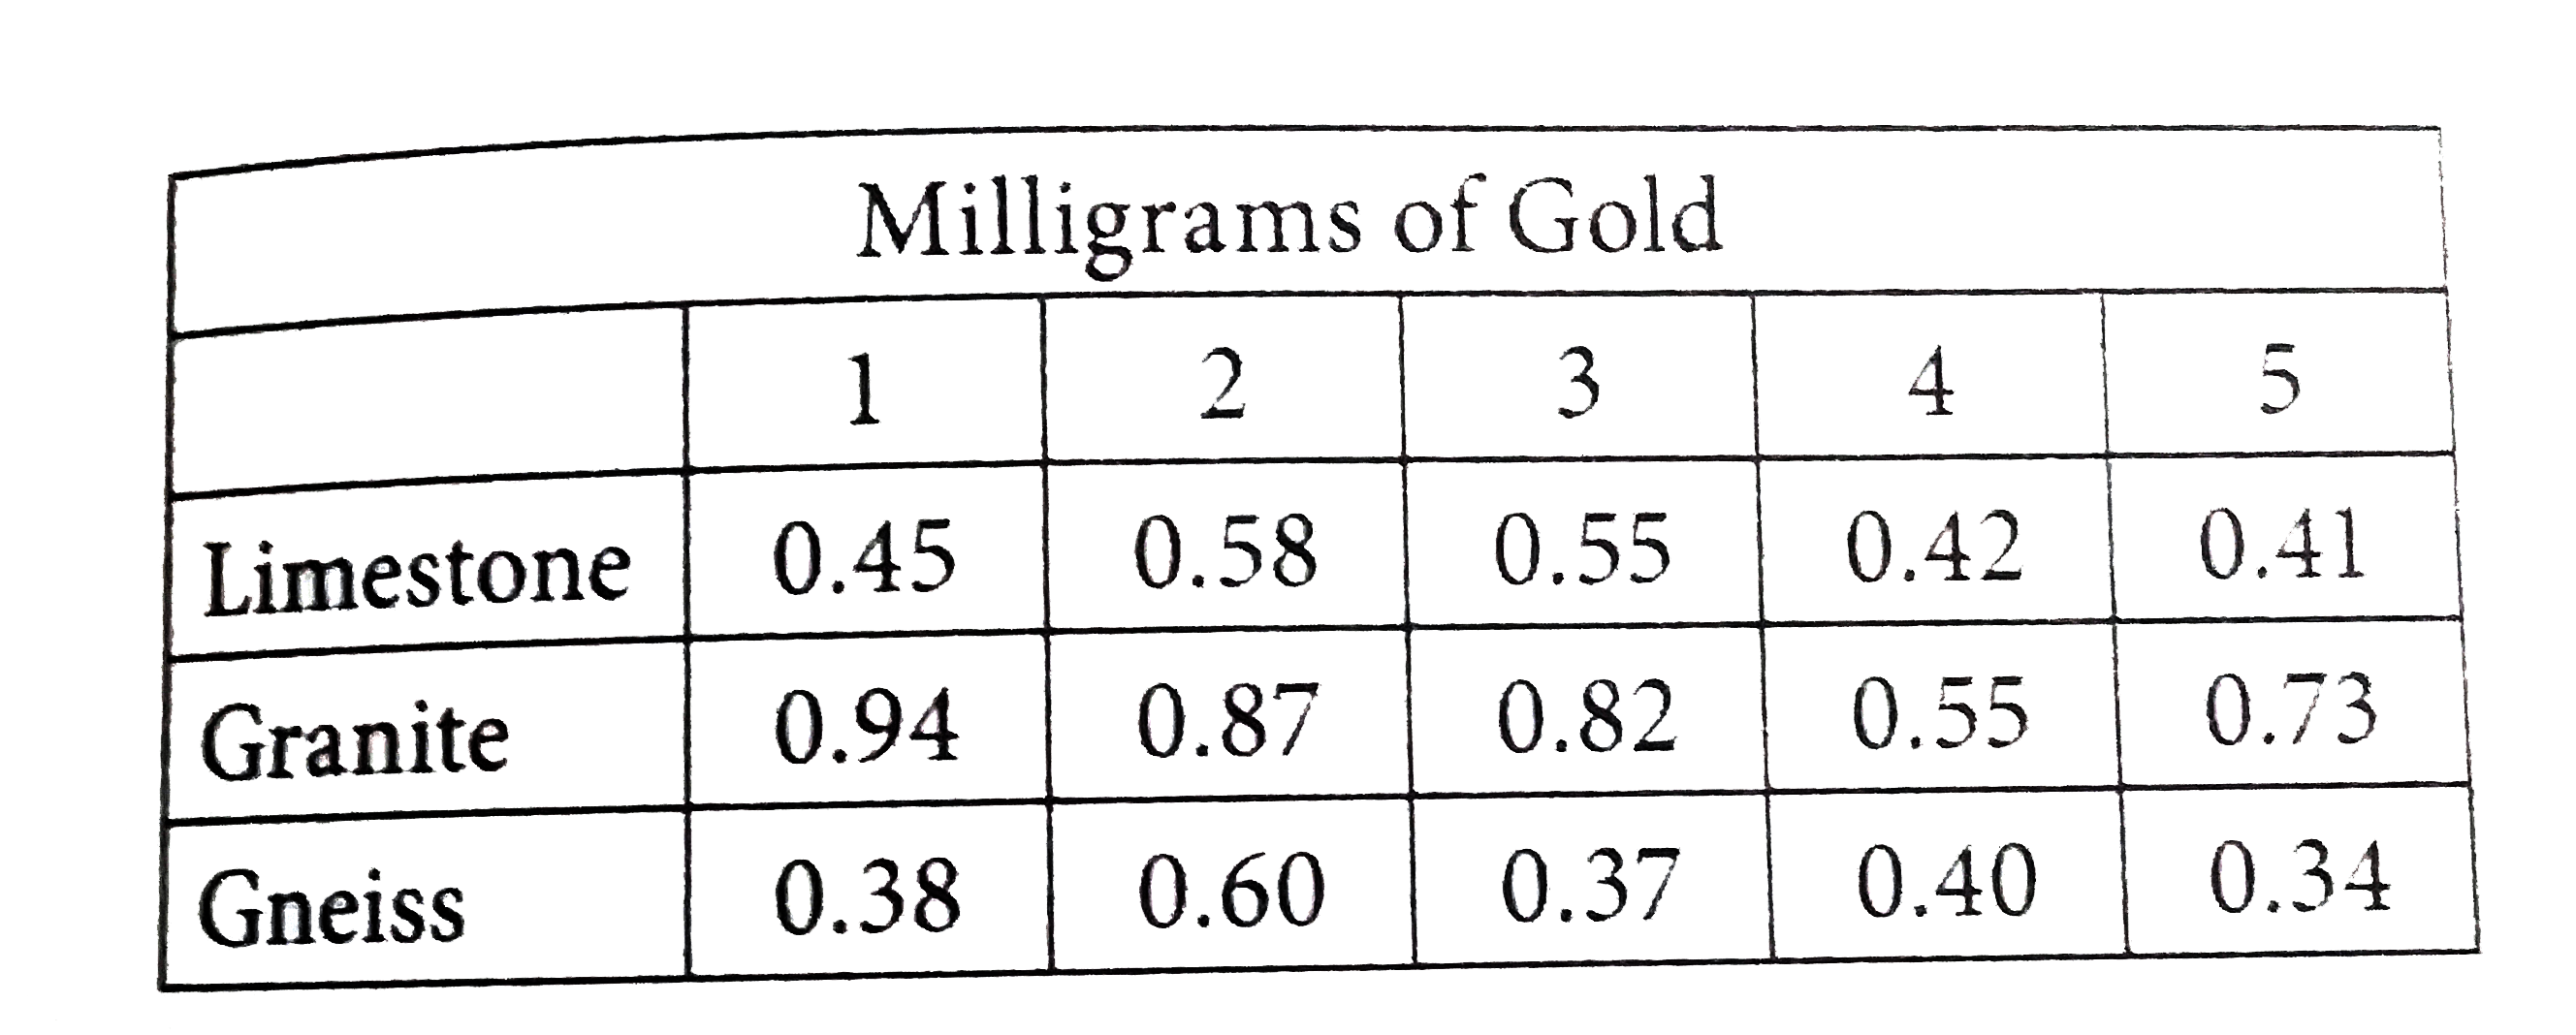
Five samples of each of three different rock types were collected on a hiking trip in Colorado. Each sample was analyzed for its gold content. The milligrams of gold found in each sample are presented in the table above. How much larger is the median of the amount of gold in the granite samples than that of the limestone samples?
0.00
0.37
0.45
0.55
The correct Answer is:B
Step by step video, text & image solution for Five samples of each of three different rock types were collected on a hiking trip in Colorado. Each sample was analyzed for its gold content. The milligrams of gold found in each sample are presented in the table above. How much larger is the median of the amount of gold in the granite samples than that of the limestone samples? by Maths experts to help you in doubts & scoring excellent marks in Class 12 exams.
Updated on:21/07/2023Topper's Solved these Questions
- ADVANCED ARITHMETICBOOK - PRINCETONCHAPTER - ADVANCED ARITHMETICEXERCISE - Advanced Arithmetic Drill: Calculator-Permitted Section
16 Videos
- ADDITIONAL TOPICSBOOK - PRINCETONCHAPTER - ADDITIONAL TOPICSEXERCISE - QUICK QUIZ #9
3 Videos
- ALEGBRABOOK - PRINCETONCHAPTER - ALEGBRAEXERCISE - QUICK QUIZ #6
3 Videos
Similar Questions
20-2x
20-x
20
20+x
20+2x
What is the average (arithmetic mean) of the list of number above?
View Solution
The table above provides values for the function g for selected values of t. Which of the following defines the function g?
View SolutionIf (3x)2=81, which of the following is a possible value of x?
View SolutionA gold sample contains 90% of gold and the rest copper. How many atoms of gold are present in one gram of this sample of gold?
View SolutionHow many lines of symmetry does the above figure have ?
View SolutionDetermine the point of symmetry of a regular hexagon.
View SolutionMatch the following Column A to Column B

View SolutionMatch the following Column A to Column B

View SolutionMatch the following Column A to Column B

View SolutionFind the area of the paths each having a uniform width in the following rectangular field.
ltimg src="https://d10lpgp6xz60nq.cloudfront.net/physics_images/PS_MATH_VII_C06_S01_002_Q01.png" width="80%"gt
View SolutionThe inequation represented by the graph given below is :
View SolutionThe inequation that best describes the graph given below is _________
View SolutionThe inequation that best describes the following graph is _________
View SolutionWrite the vector →F in terms of its component :-
ltimg src="https://d10lpgp6xz60nq.cloudfront.net/physics_images/ALN_PHY_R02_E02_002_Q01.png" width="80%"gt
View Solution
Five samples of each of three different rock types were collected on a hiking trip in Colorado. Each sample was analyzed for its gold content. The milligrams of gold found in each sample are presented in the table above. What is the percent difference of the average gold content in the granite samples when compared to the average gold content of the gneiss samples?
View Solution
