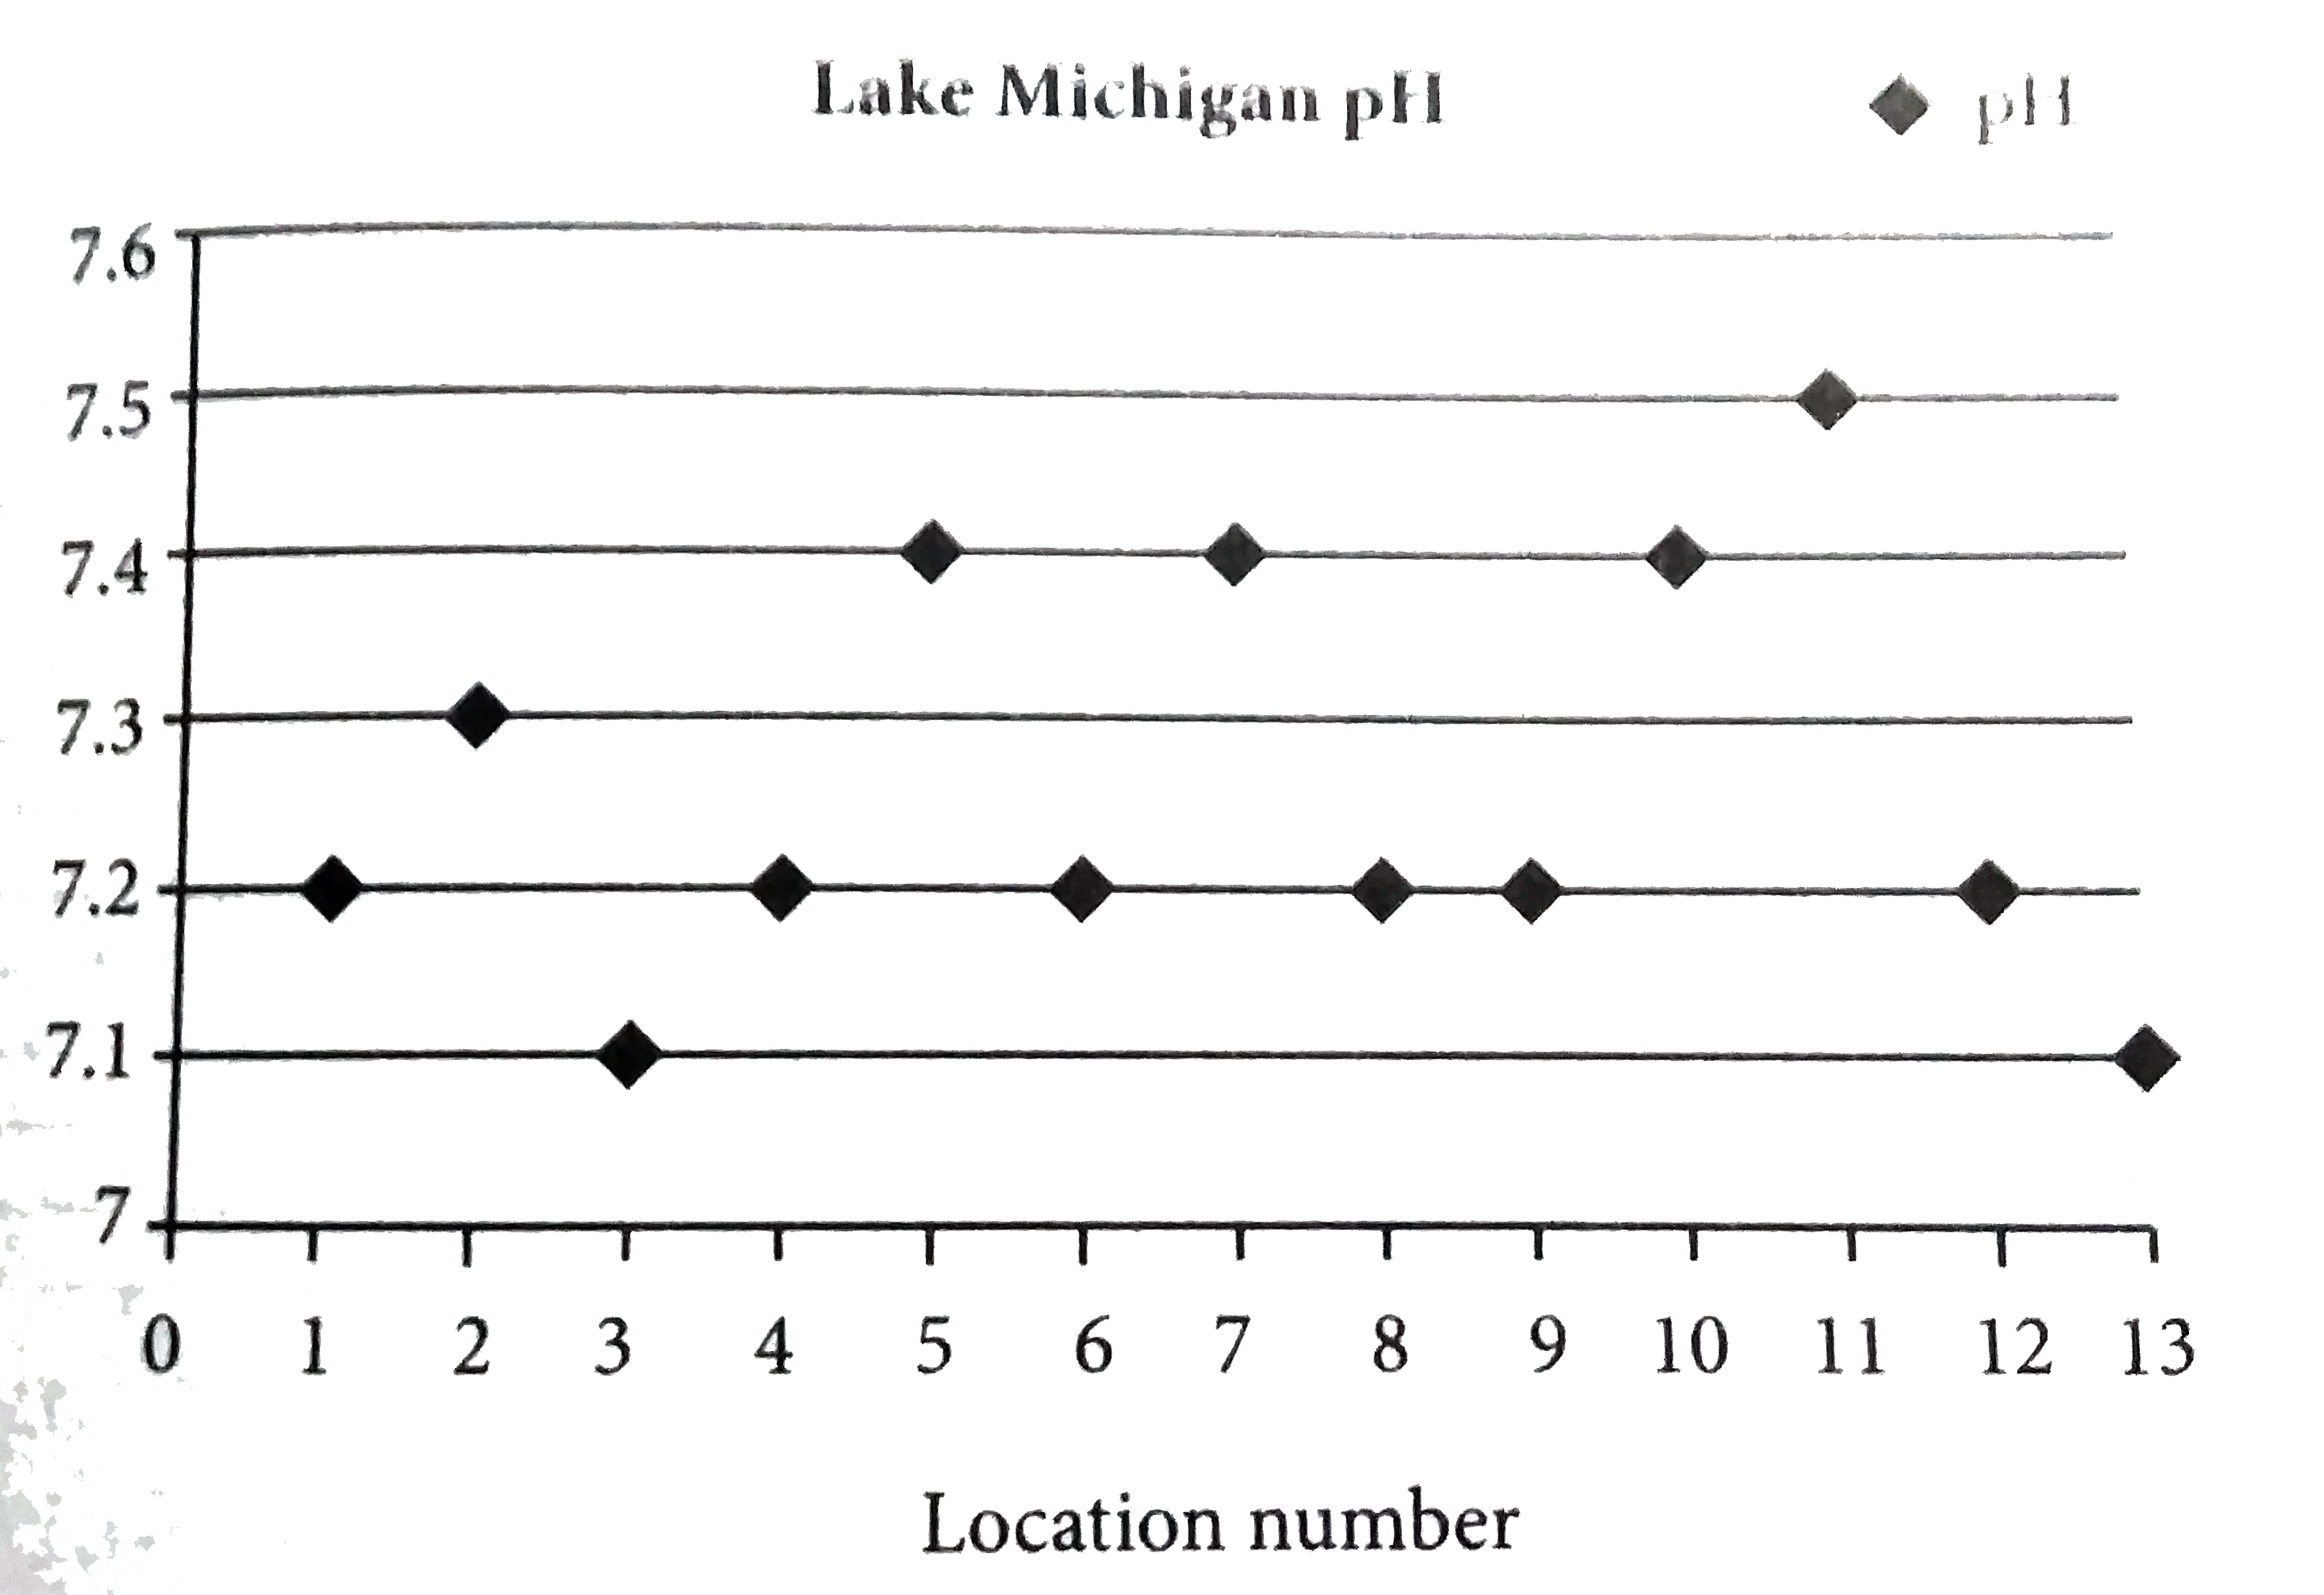
The pH of the water in Lake Michigan was tested at 13 locations along the illions shoreline. The data is presented in the scatterplot above. Which of the following best represents the mode of the pH in the collected data?
7.2
7.3
7.4
7.5
The correct Answer is:A
Topper's Solved these Questions
- ADVANCED ARITHMETICBOOK - PRINCETONCHAPTER - ADVANCED ARITHMETICEXERCISE - Advanced Arithmetic Drill: Calculator-Permitted Section
16 Videos
- ADDITIONAL TOPICSBOOK - PRINCETONCHAPTER - ADDITIONAL TOPICSEXERCISE - QUICK QUIZ #9
3 Videos
- ALEGBRABOOK - PRINCETONCHAPTER - ALEGBRAEXERCISE - QUICK QUIZ #6
3 Videos
Similar Questions
Knowledge Check
On which of the following choices is the data best represented by a bar diagram?
ARainfallBHumidityCAir pressureDTemperature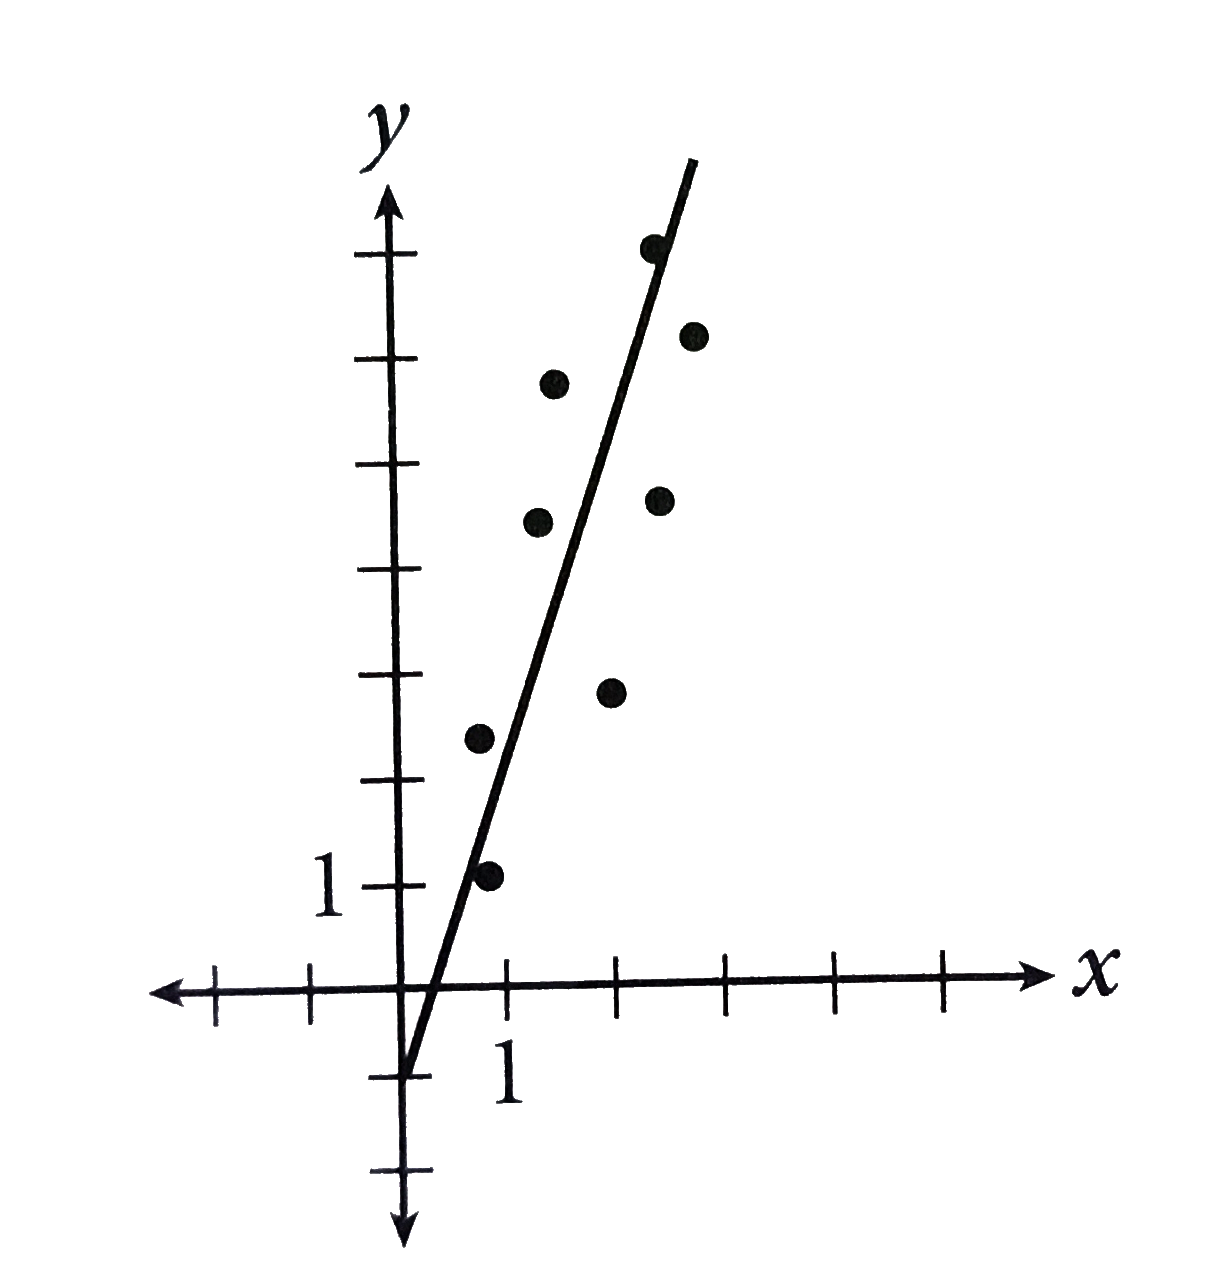
Which of the following equation corresponds to the line of best fit for the data set shown above ?Ay=0.4x−1By=0.4x+1Cy=2.5x+1Dy=2.5x−1Which of the following represents the correct Ph of a10^(-7) M HCI in doubly distilled air-free water?
A6.6990B7.0000C7.3010D6.3980
The average Guanine content in yeast is found to be 18%.
Which of the following represents the nitrogenous base content percentages correctly from the above data?
View SolutionIn the 1990s, the park rangers at Yellowstone National park implemented a program aimed at increasing the dwindling coyote population in Montana. Results of studies of the coyote population in the park are shown in the scatterplot below.
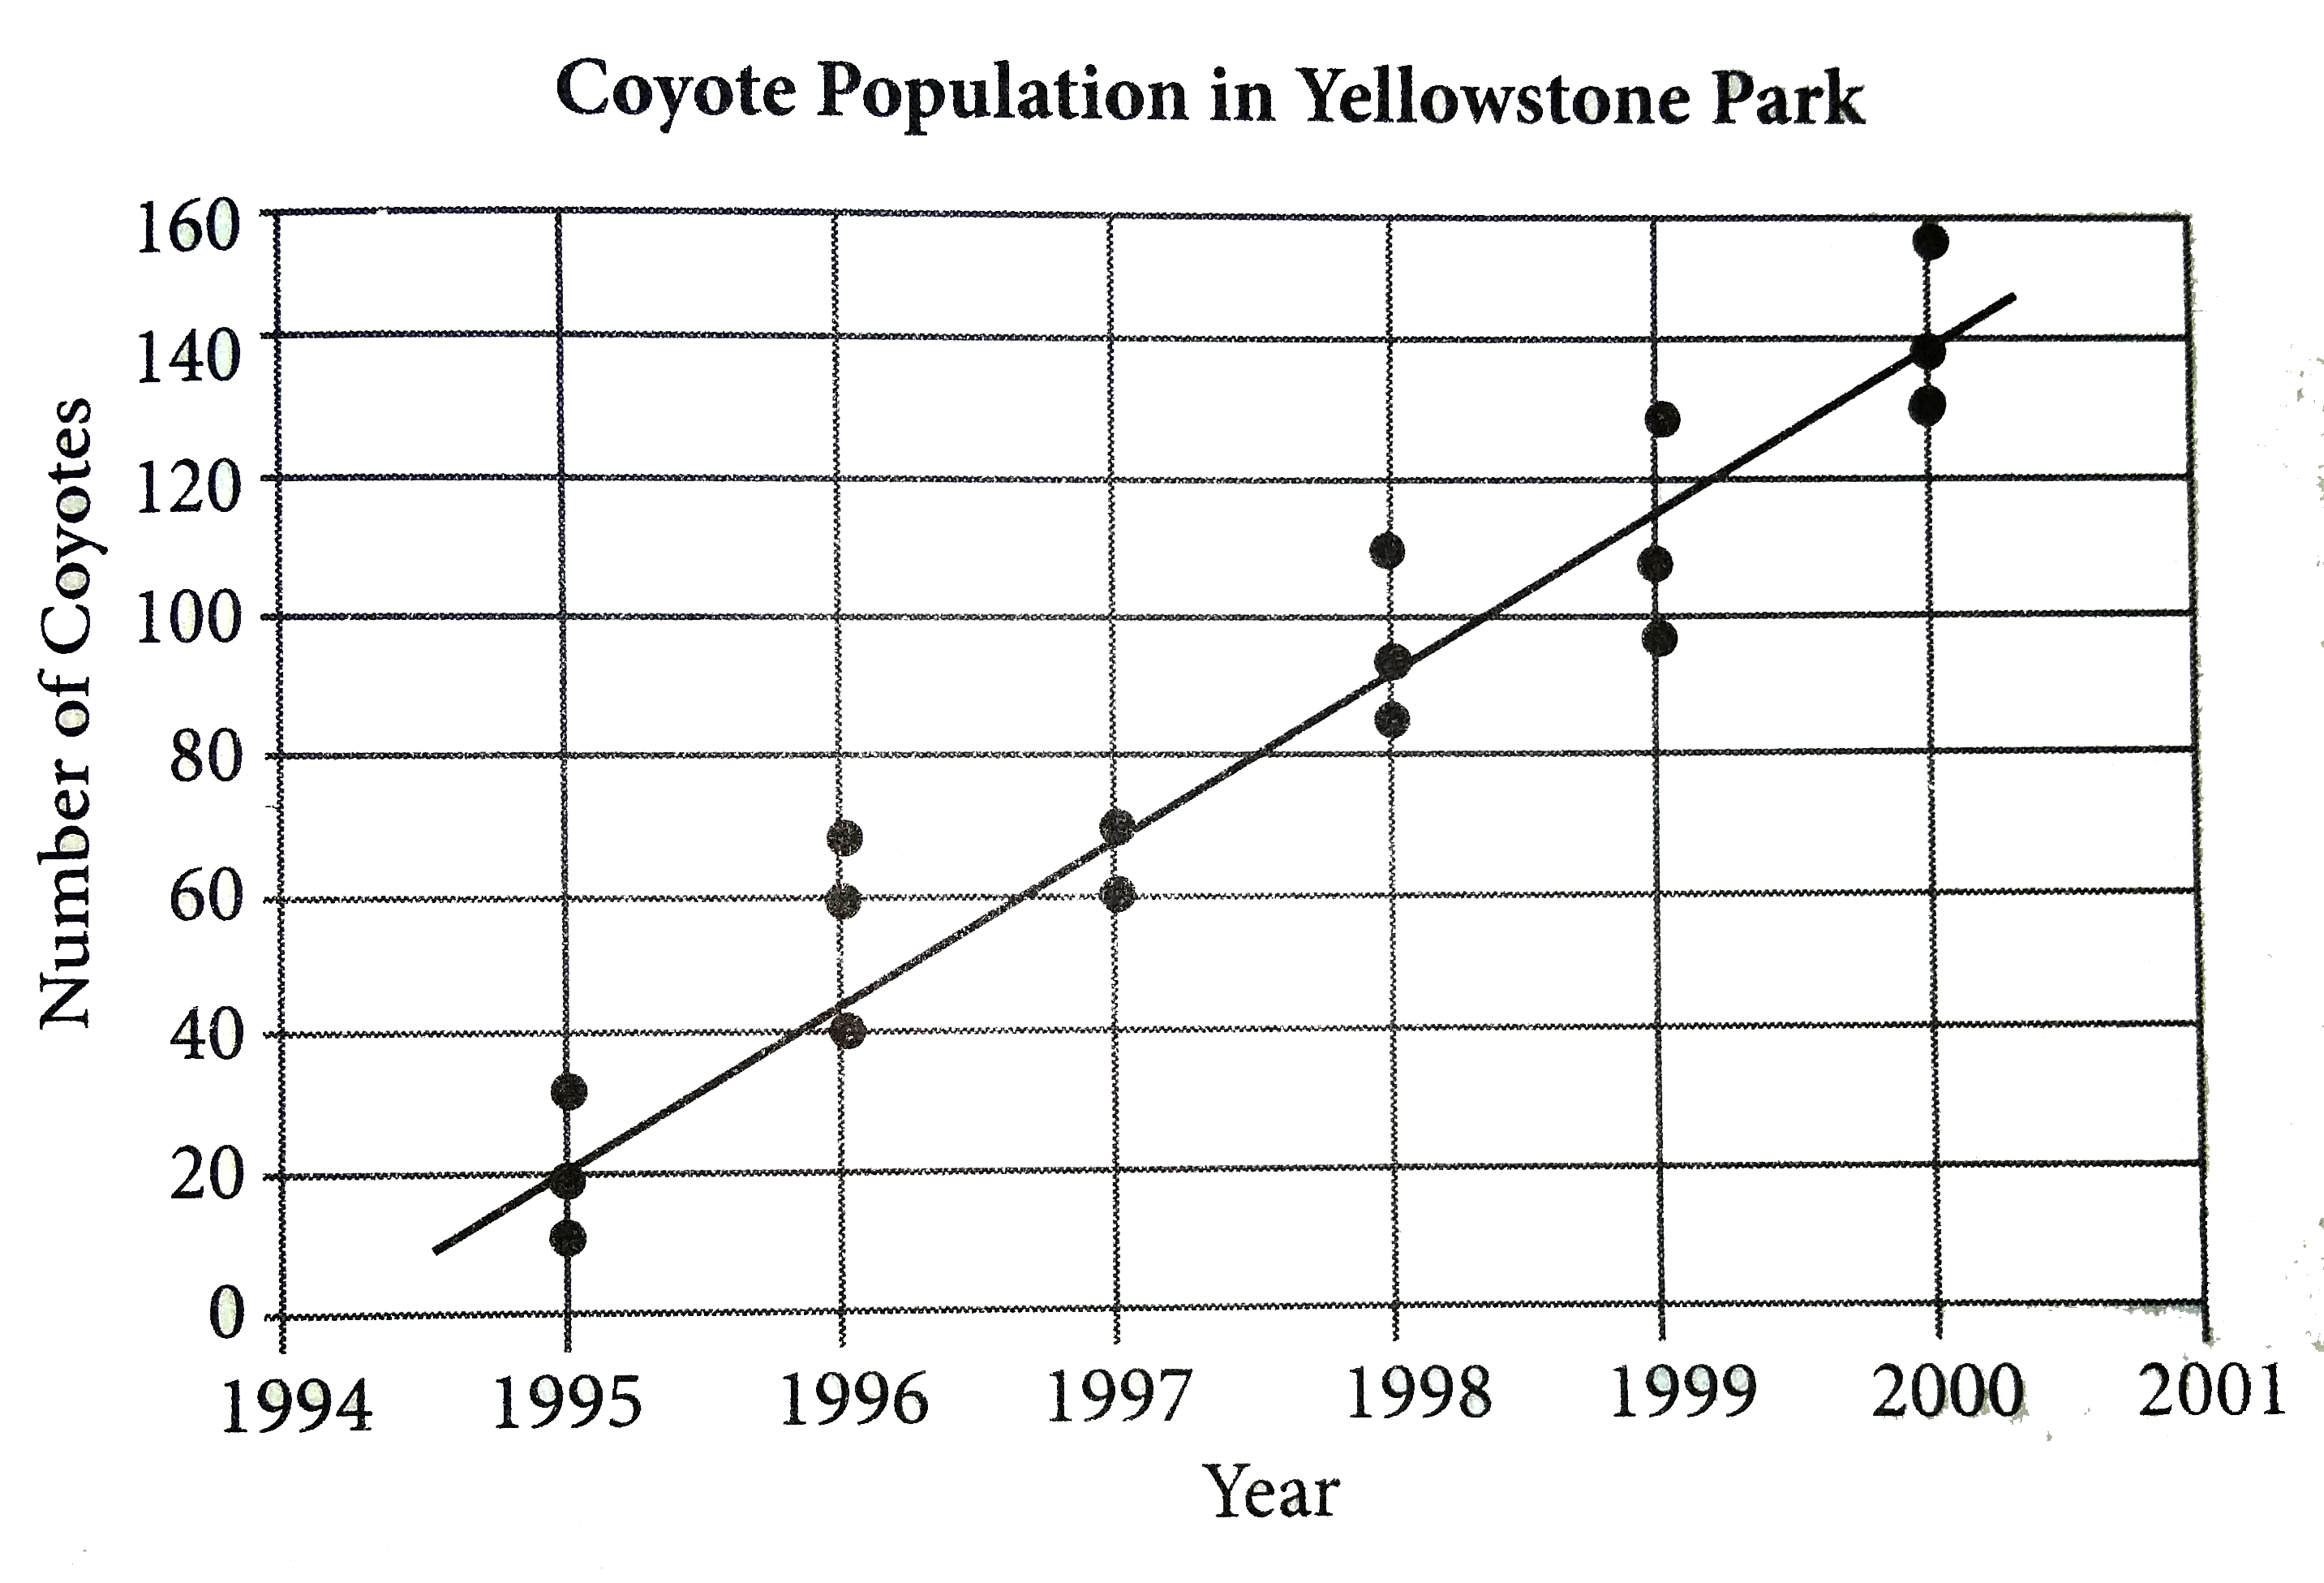
According to the data in the scatterplot, which of the following best represents the percent increase between the median of the results of the studies from 1995 and the median of the results of the studies from 1996?
View Solution(##KPL_SAT_PRD_PLS_C09_E01_004_Q01.png" width="80%">
The scaterplot abouve shows data collected each year after the British Parlimament enacted a mandatory seat belt law and line of beast fit to the data. Which of the following equations best represents the trend of the data shown in the figure ?
View Solution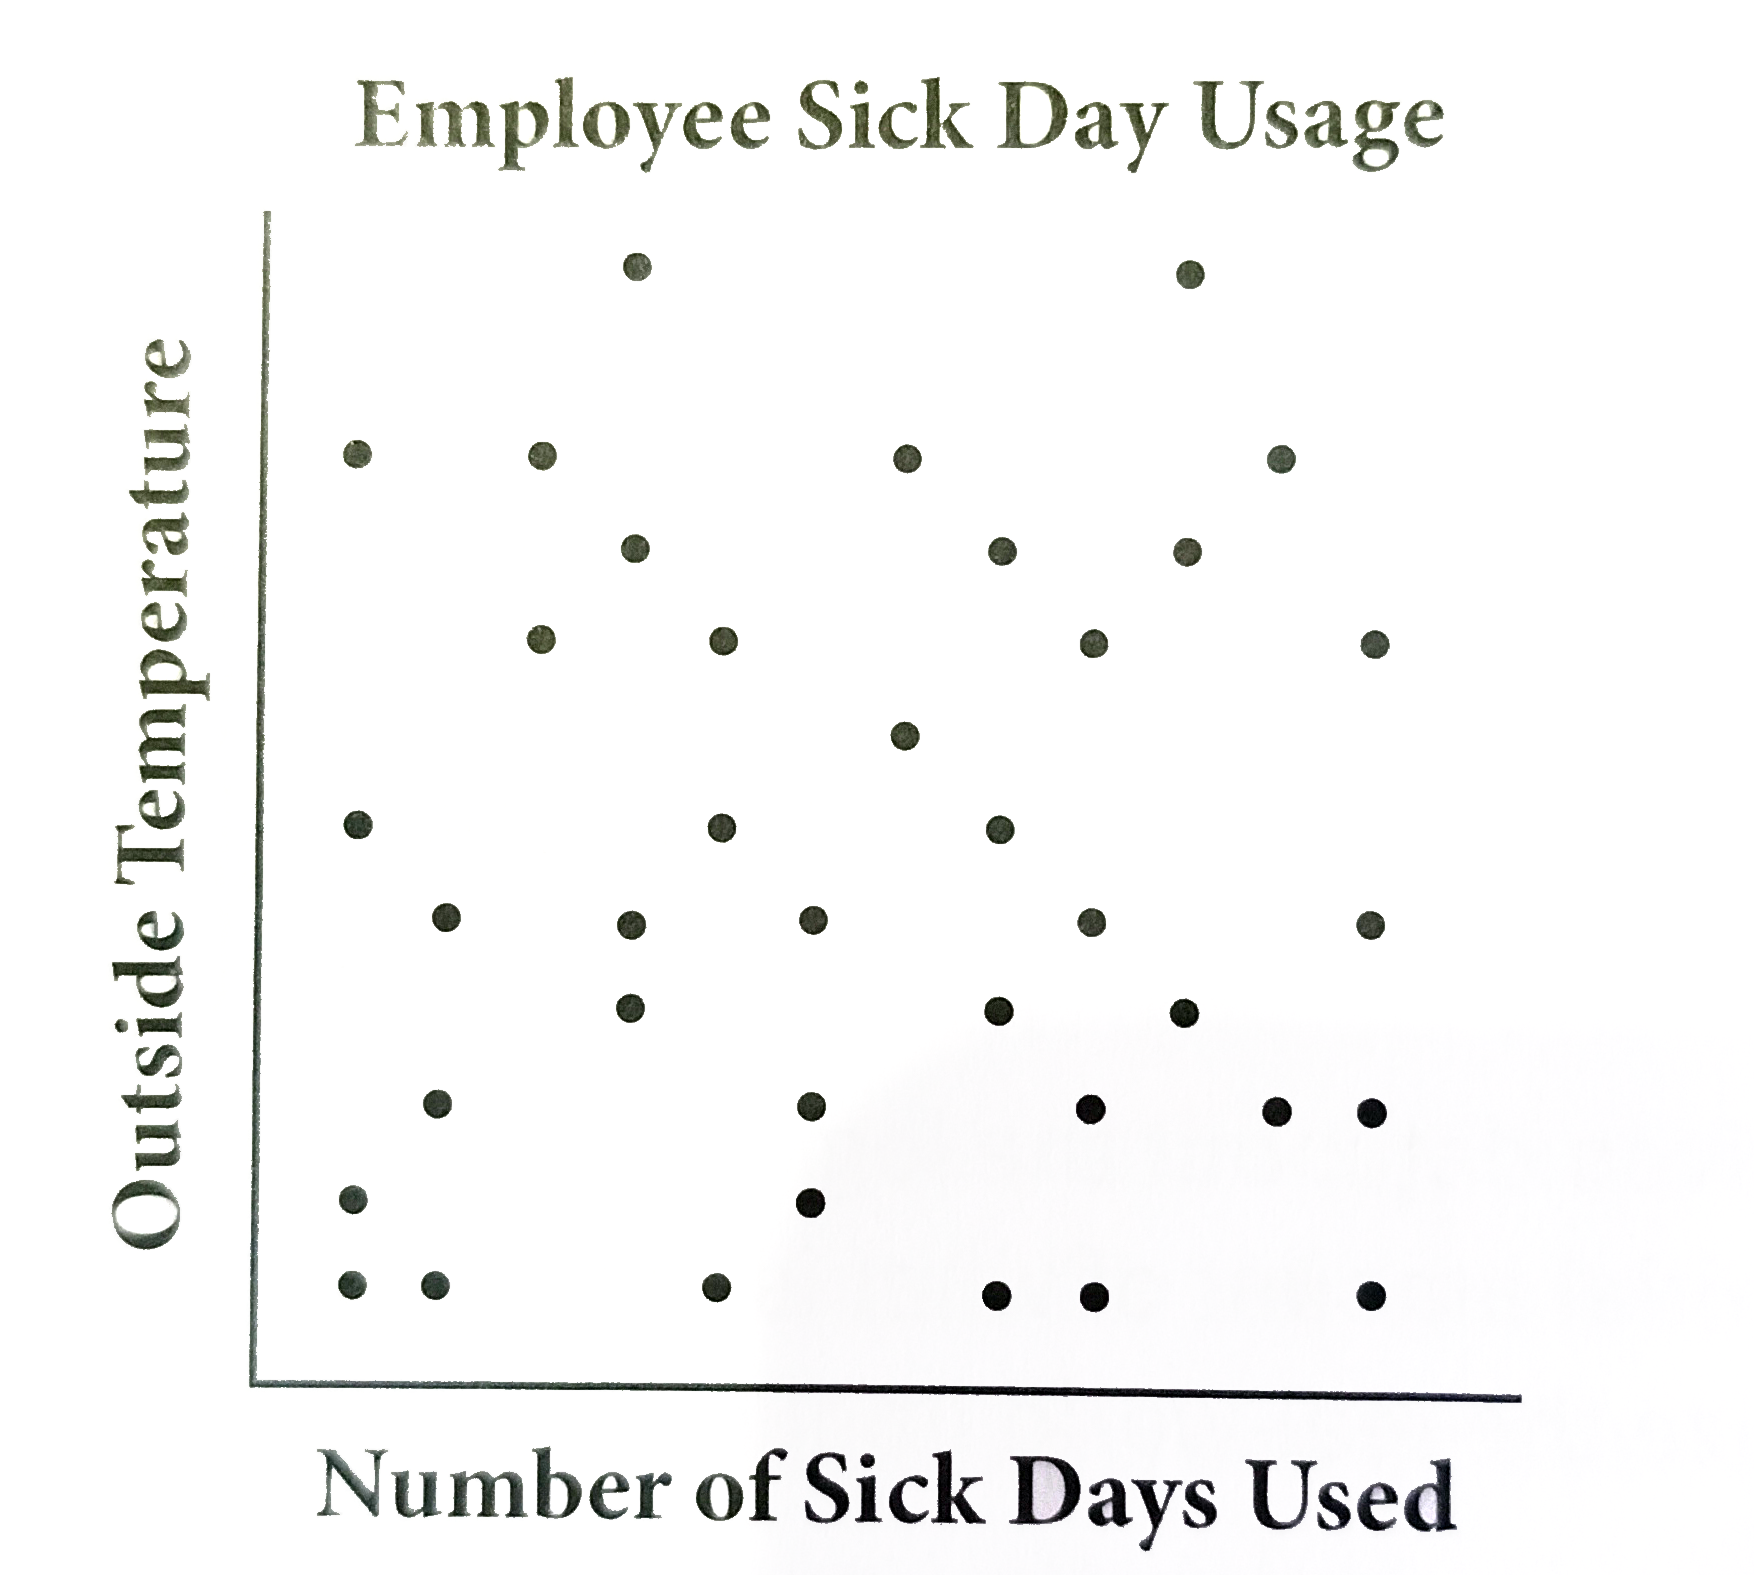
The Human Resources department of a company tracks employee sick day usage to see if there are patterns. One of the HR representatives decides to check employee sick day usage against outside to check employee sick day usage against outside temperature. He compiles the information for the eimpl,oyees' sick day usage and temperature in the scatterplot above. Which of the following conclusion can he draw based on this data ?
View Solution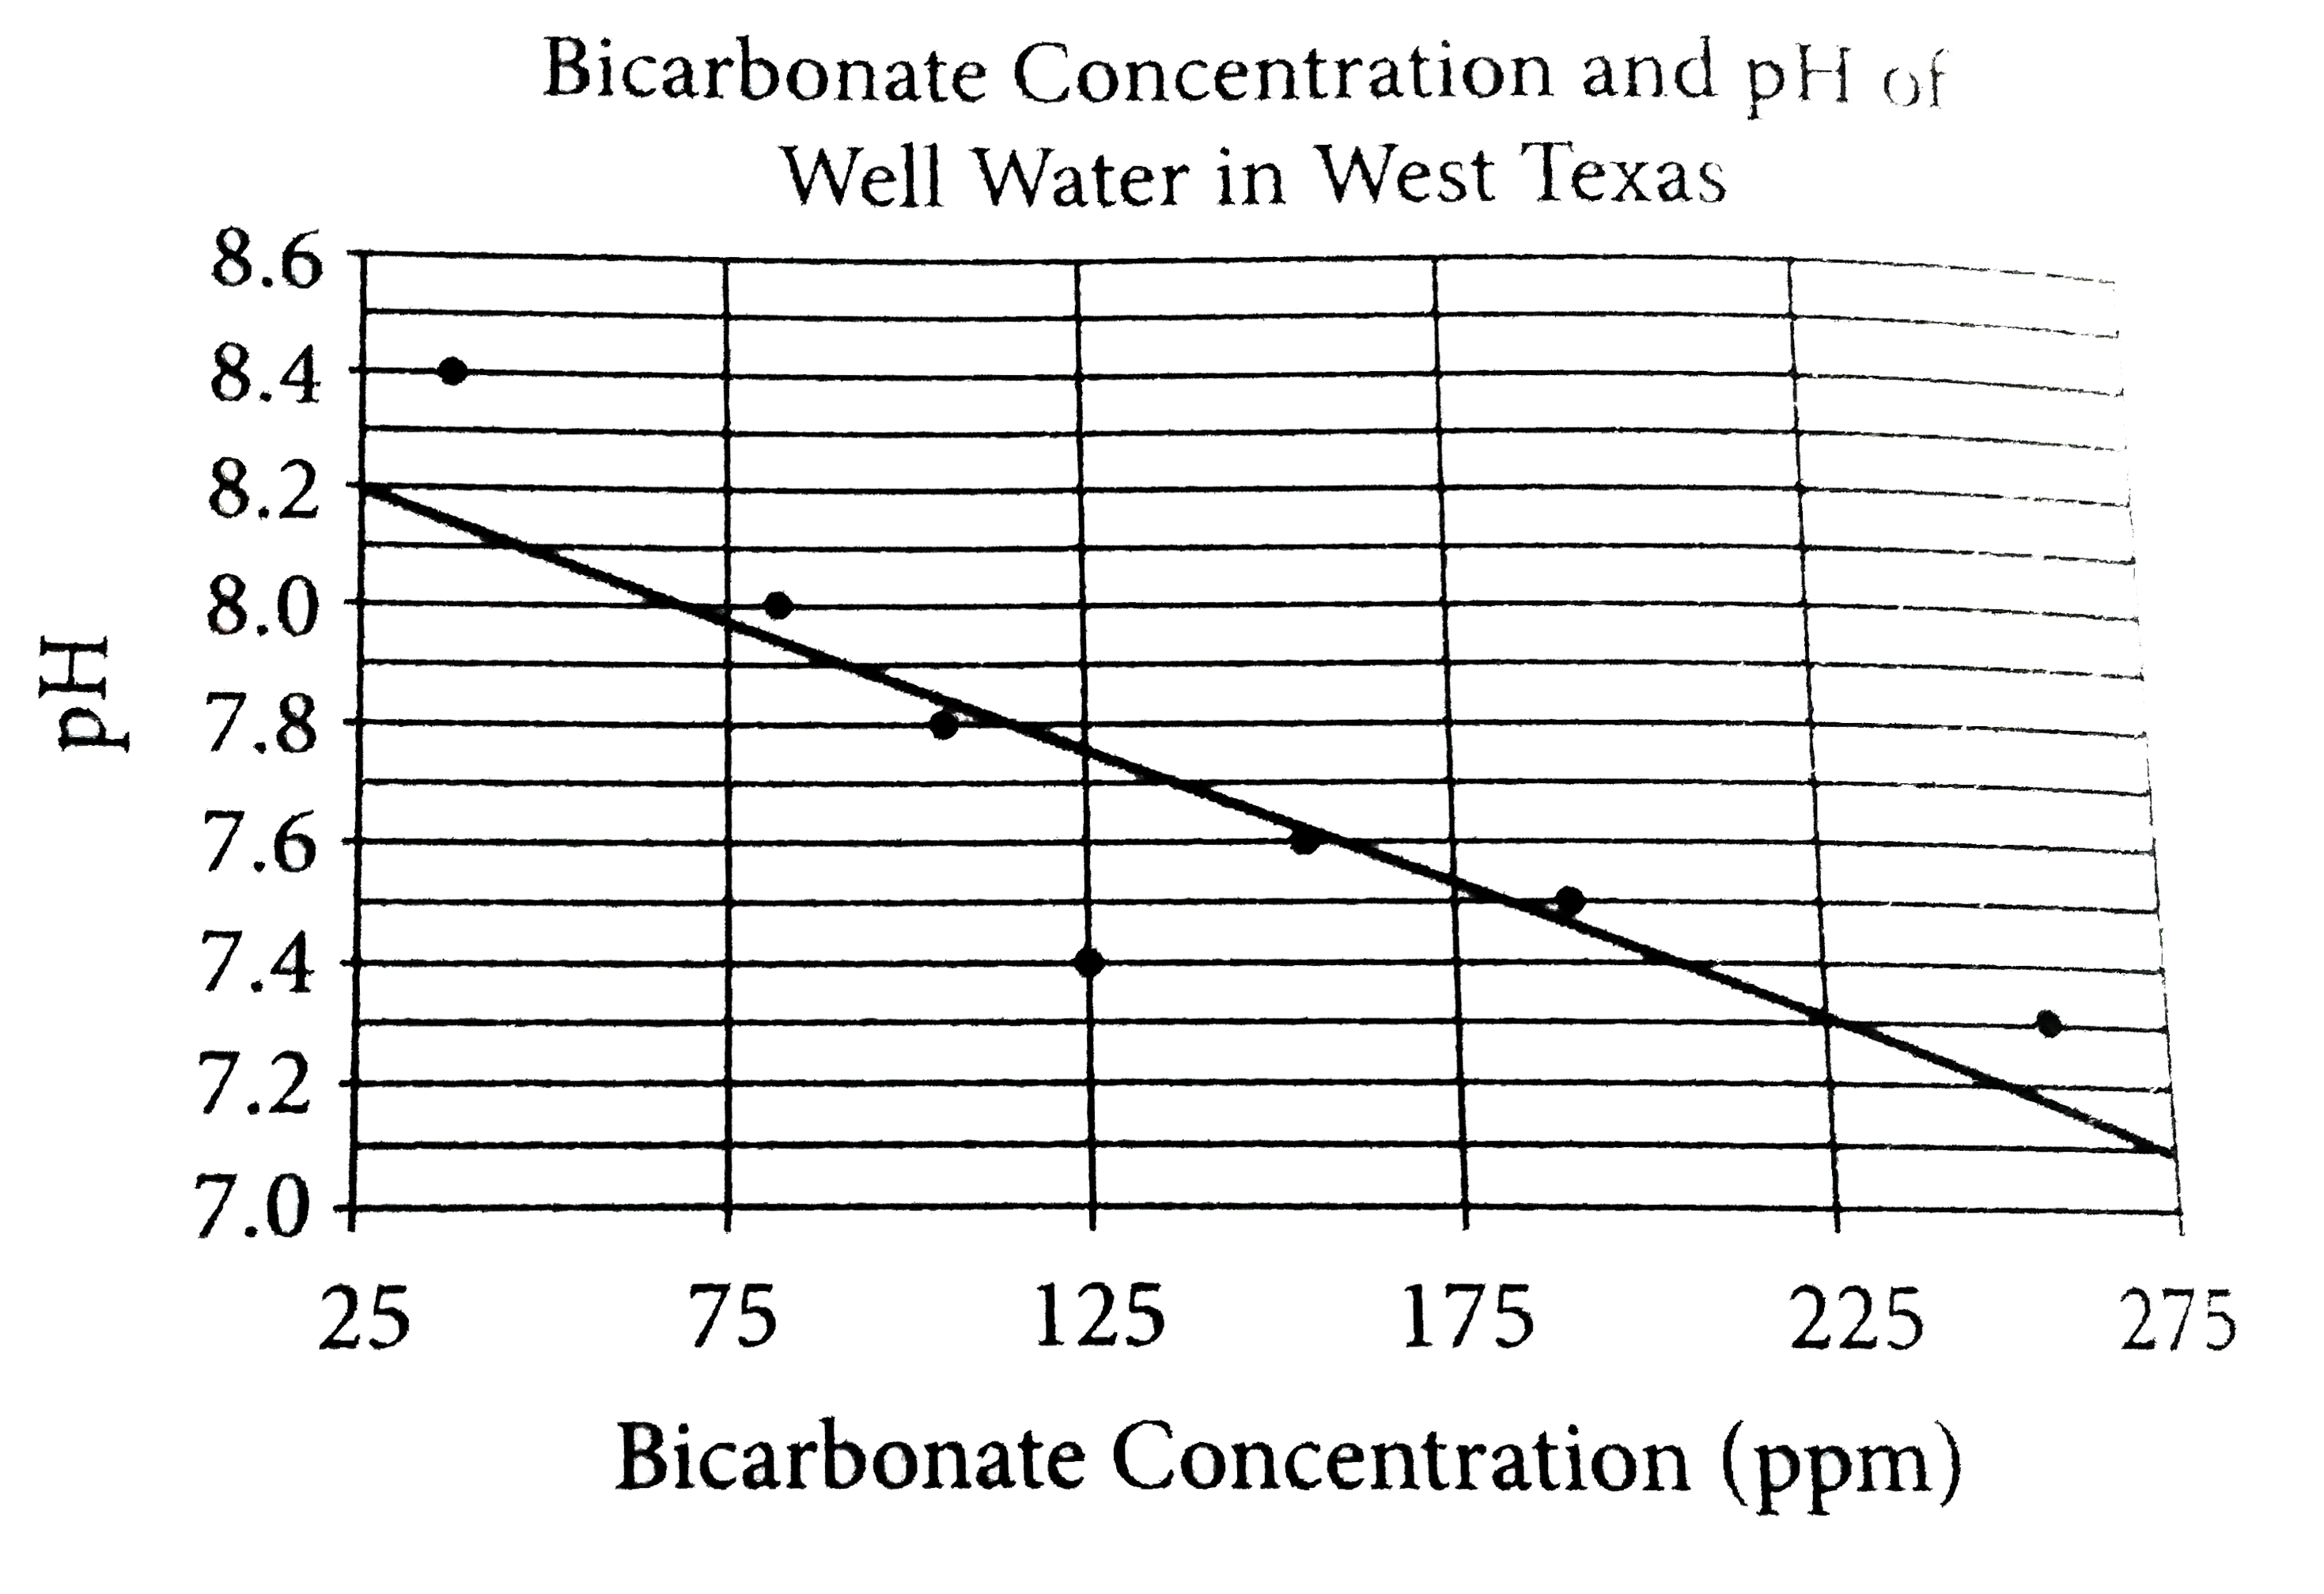
The scatterplot above shows the pH of seven well water samples in West Texas with respect to the bicarbonate concentration in ppm(parts per million). The line of best fit is also shown.
According to the scatterplot, which of the following statements about the relationship between a well's pH and its bicarbonate concentration is true?
View Solution

