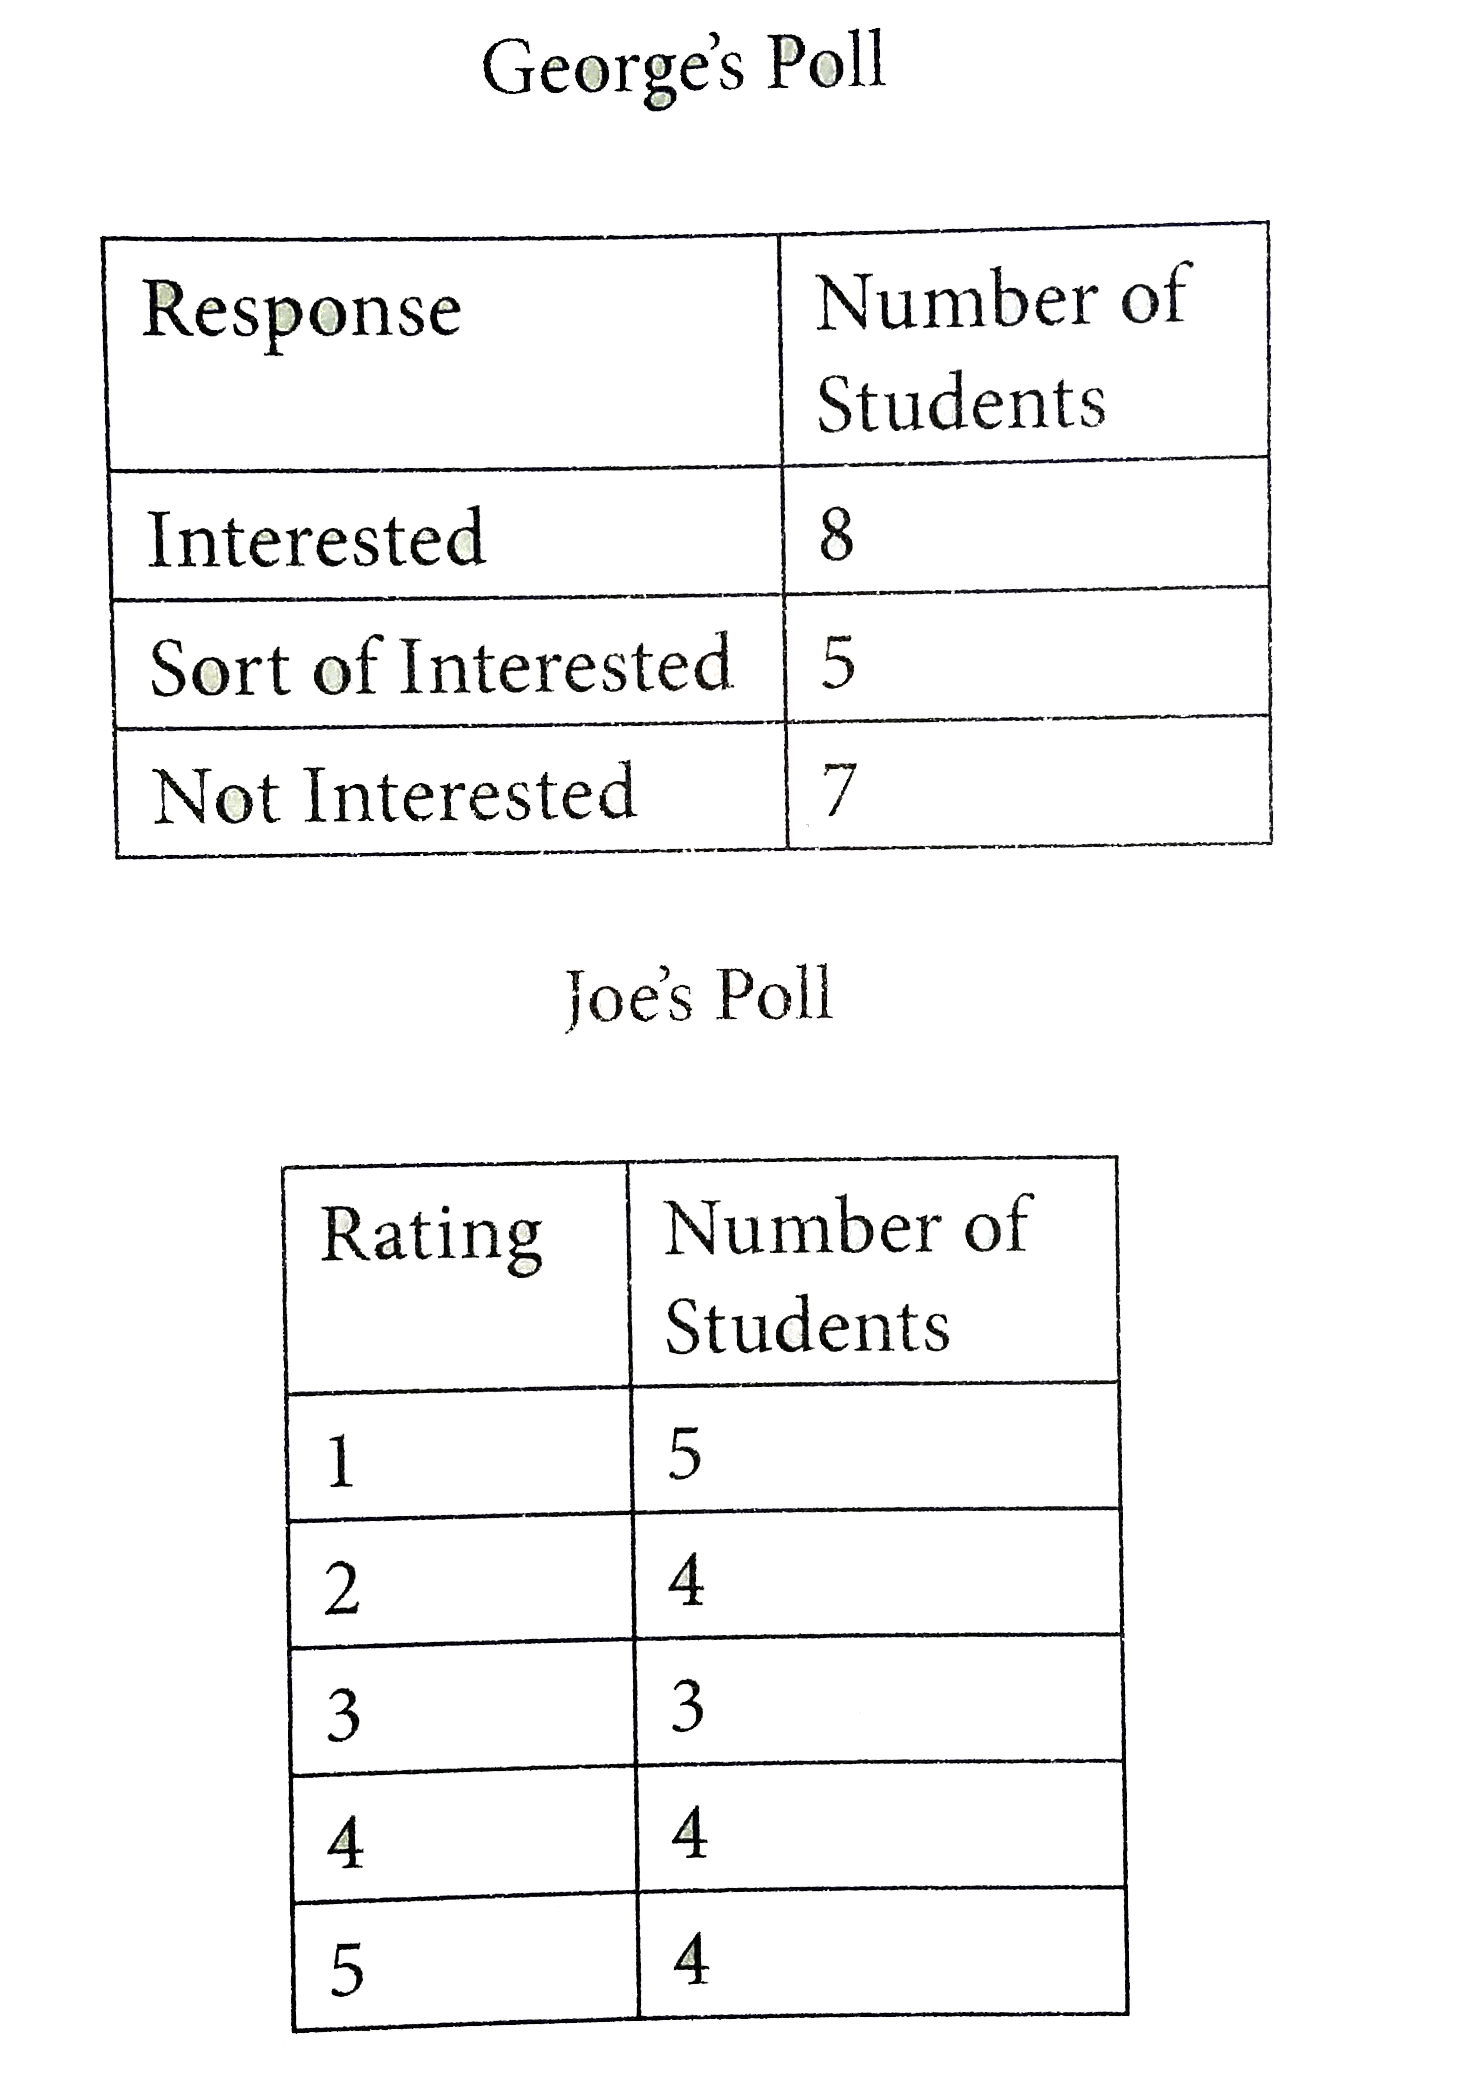
George and Joe inteview the same 20 follow students regarding their interest in their schools new model UN club. George asked the students to respond with interested., Sort of interested , and Noot interested. Joe asked the students to rate their interest on a scale of 1 to 5. The results of the polls are below.

After reviewing the data, the Model UN advisors determine that Joe informed the students of Whether a 1 or a 5 was the best rating, but neglected to report to them whether it was a 1 or a 5 that was the best rating in the report. What additional piece of information would most help the advisor determine whether a 1 or 5 was the best rating?
Requesting the George redo his poll with the same rating system as Joe's poll
Requesting that Joe redo his poll with the same rating system as George's poll
Polling all of the students who said "Interested" in George's Poll and asking them to choose between " Extremely Interested" and "Very Interested"
Polling all of the students who gave a "1" rating in Joe's poll and ask them if they are interested in MODEL UN
The correct Answer is:D
Topper's Solved these Questions
Similar Questions
IF 3y=y+2, what is the value of 2y?
View SolutionThe population ,P, of town Y since 1995 can be estimated by the equation P=1.0635x+3,250, where x is the number of years since 1995 and 0≤x≤20. In the context of this equation, what does the number 1.0635 most likely represent?
View SolutionFor i=√−1, what is the sum of (5+2i)+(−7+30i)?
View SolutionWhich of the following are correct chain isomers of butane ? (i)
View SolutionDetermine the point of symmetry of a regular hexagon.
View SolutionDtermine the images of the following figure about the given line :
View SolutionMatch the following Column A to Column B

View SolutionMatch the following Column A to Column B

View SolutionMatch the following Column A to Column B

View SolutionFind the area of figure given below.

View SolutionFind the perimeter of the figure given below.

View SolutionFind the area of the figure given below.

View SolutionThe area of the shaded part in the figure given below is ______.

View SolutionThe inequation represented by the graph given below is :
View SolutionThe inequation that best describes the graph given below is _________
View Solution
