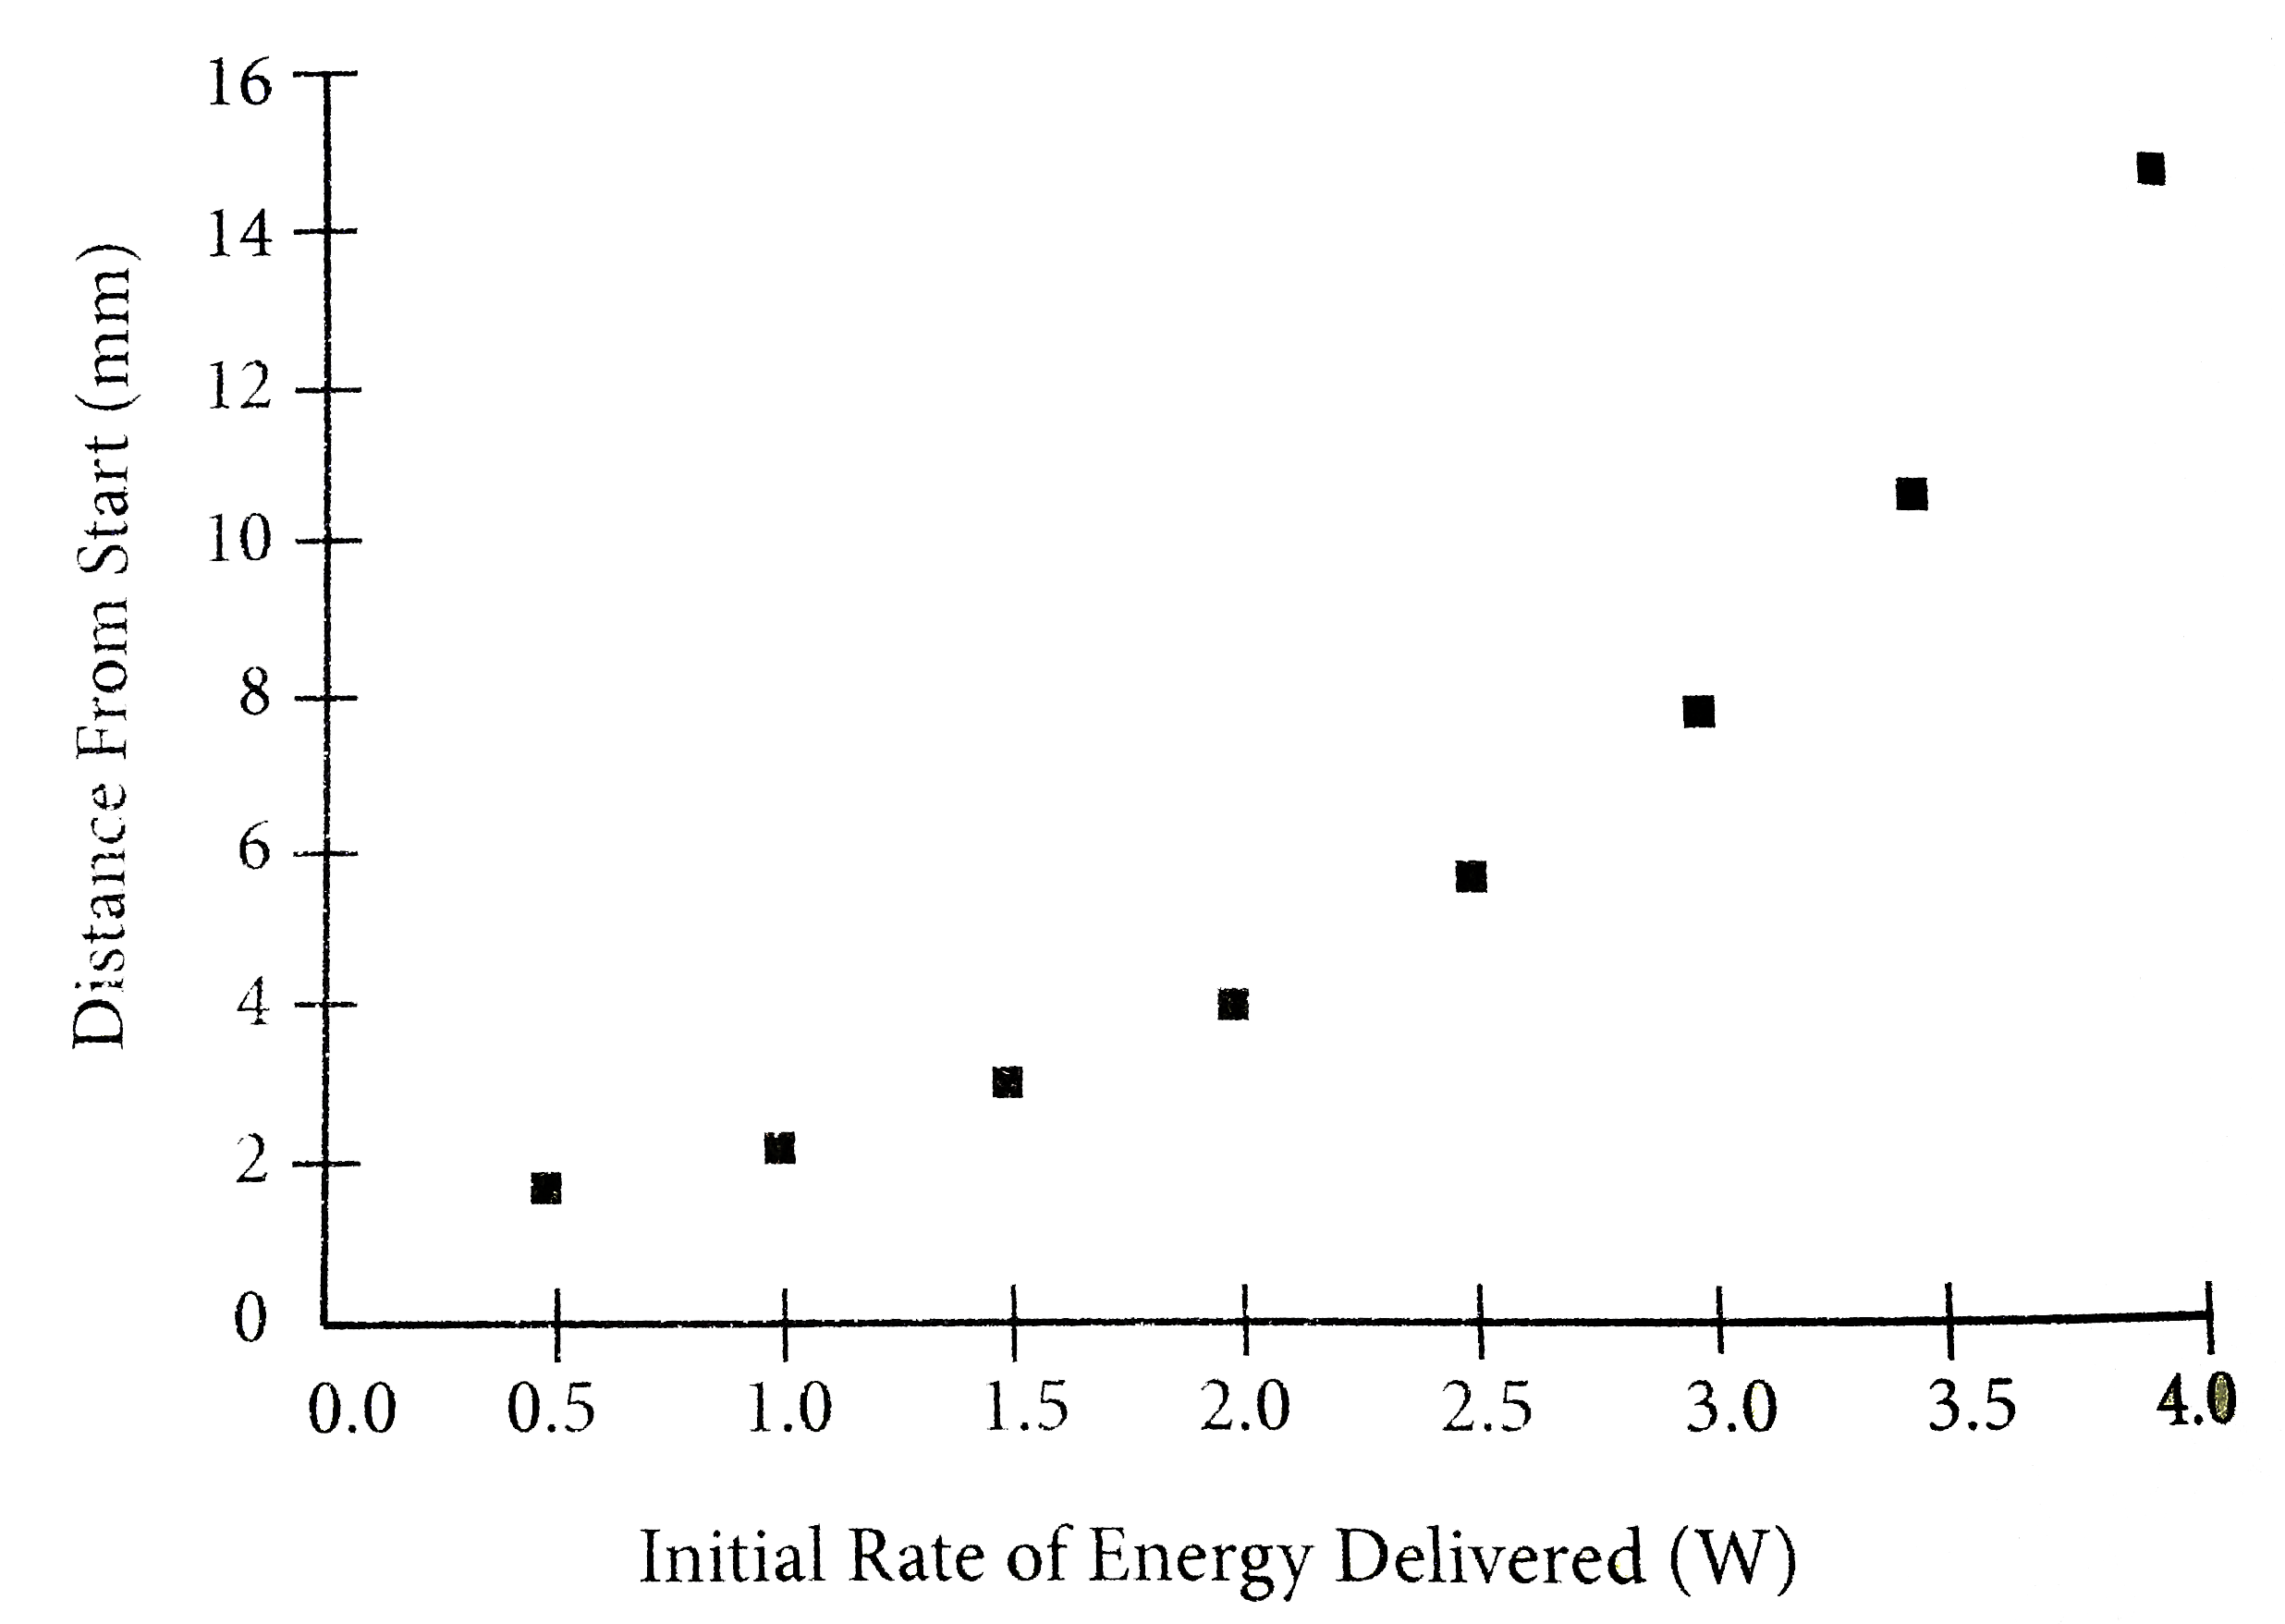
Mr. Lastorka's science class is running experiments with an energy efficient model electric car, As the initial rate of energy delivered to the car, measured in watt, increases, the number of millimeters moved by the car from its starting positions increases exponentially . The results the several trial runs are shown on the scatterplot graph below.

Based on the data, the students in Mr . Lastroka's class determine the exact equation involving Watts, x and total distance from start,y. They call the function y=f(x) over the x-axis. He challenges each student to determine the new function and what it would mean from a physics perspective. Four students pairs gave their answers below. Who is correct, and for what reasons?
Charles and Shannon, who identify the new equation as y=−2x and explain that the new graph indicates that the car is still moving forward at the same rate as before
Michael and Lauren, who identify and new equations as y=−2x and explain theat the new graph indicates the car is now moving in reverse at the same rate as before.
Matthew and Karen, who identify the new equations as y=−2x and explain that the new graph indicates that the car is now moving forward more rapidly than before.
Andy and Joanie, who identify the new equation as y=2−x and explain that the new graph indicates that the car is no longer moving in any direction.
The correct Answer is:B
Topper's Solved these Questions
Similar Questions
IF 3y=y+2, what is the value of 2y?
View SolutionThe population ,P, of town Y since 1995 can be estimated by the equation P=1.0635x+3,250, where x is the number of years since 1995 and 0≤x≤20. In the context of this equation, what does the number 1.0635 most likely represent?
View SolutionFor i=√−1, what is the sum of (5+2i)+(−7+30i)?
View SolutionDetermine the point of symmetry of a regular hexagon.
View SolutionMatch the following Column A to Column B

View SolutionMatch the following Column A to Column B

View SolutionMatch the following Column A to Column B

View SolutionFind the area of figure given below.

View SolutionFind the perimeter of the figure given below.

View SolutionFind the area of the figure given below.

View SolutionThe area of the shaded part in the figure given below is ______.

View SolutionThe inequation represented by the graph given below is :
View SolutionThe inequation that best describes the graph given below is _________
View SolutionThe inequation that best describes the following graph is _________
View SolutionThe equation of straight line shown in figure is :
ltimg src="https://d10lpgp6xz60nq.cloudfront.net/physics_images/ALN_PHY_R04_E01_020_Q01.png" width="80%"gt
View Solution
