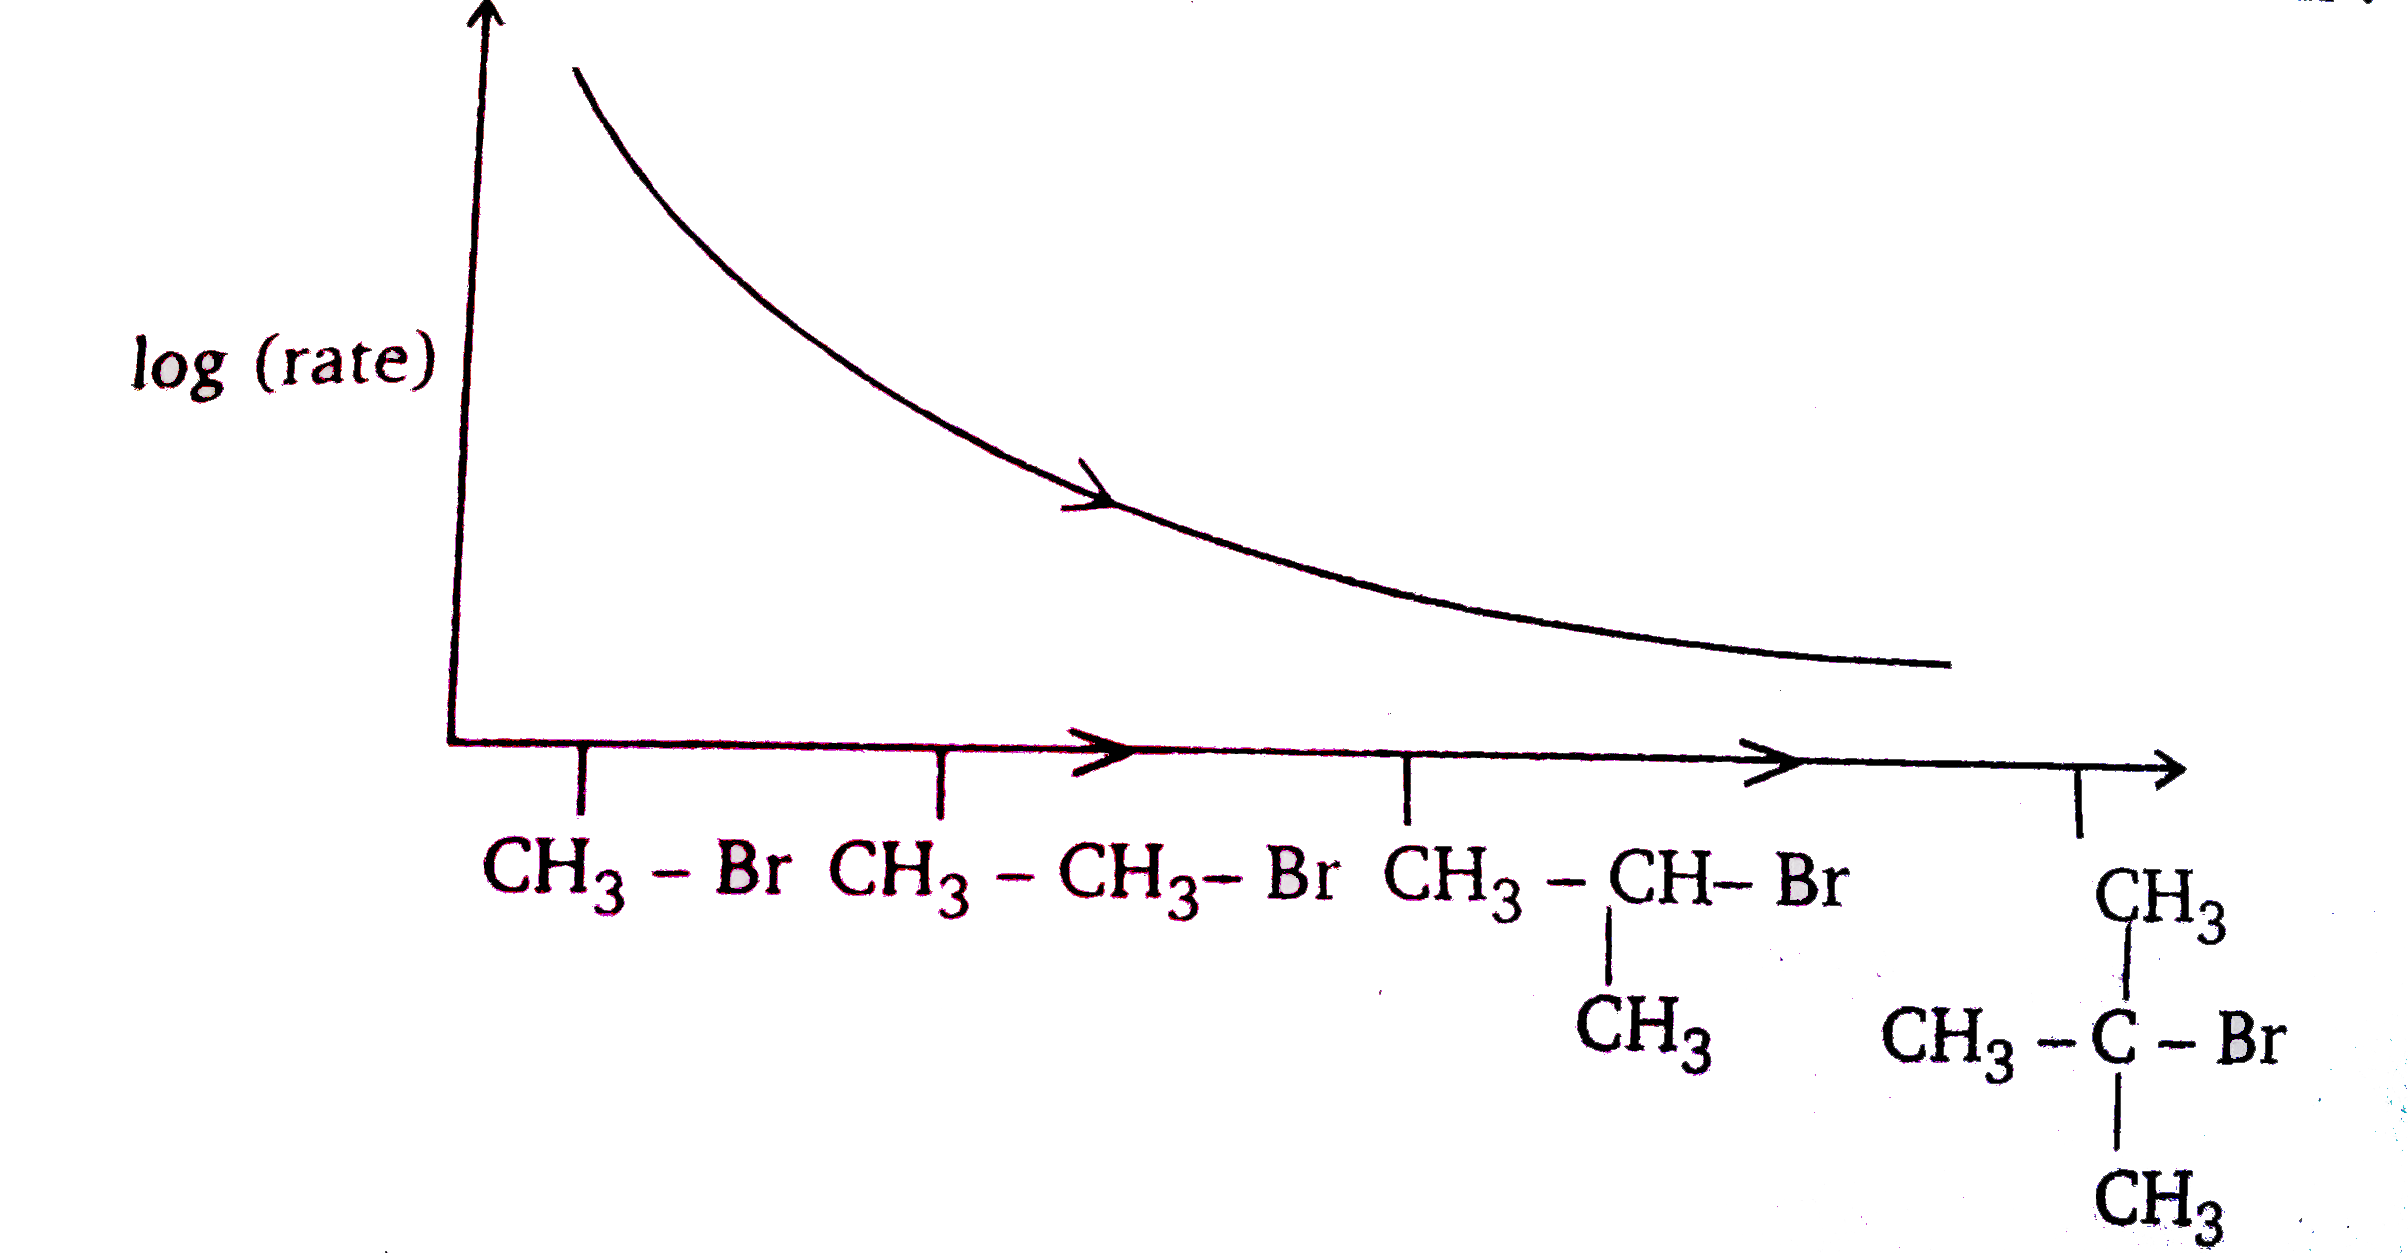
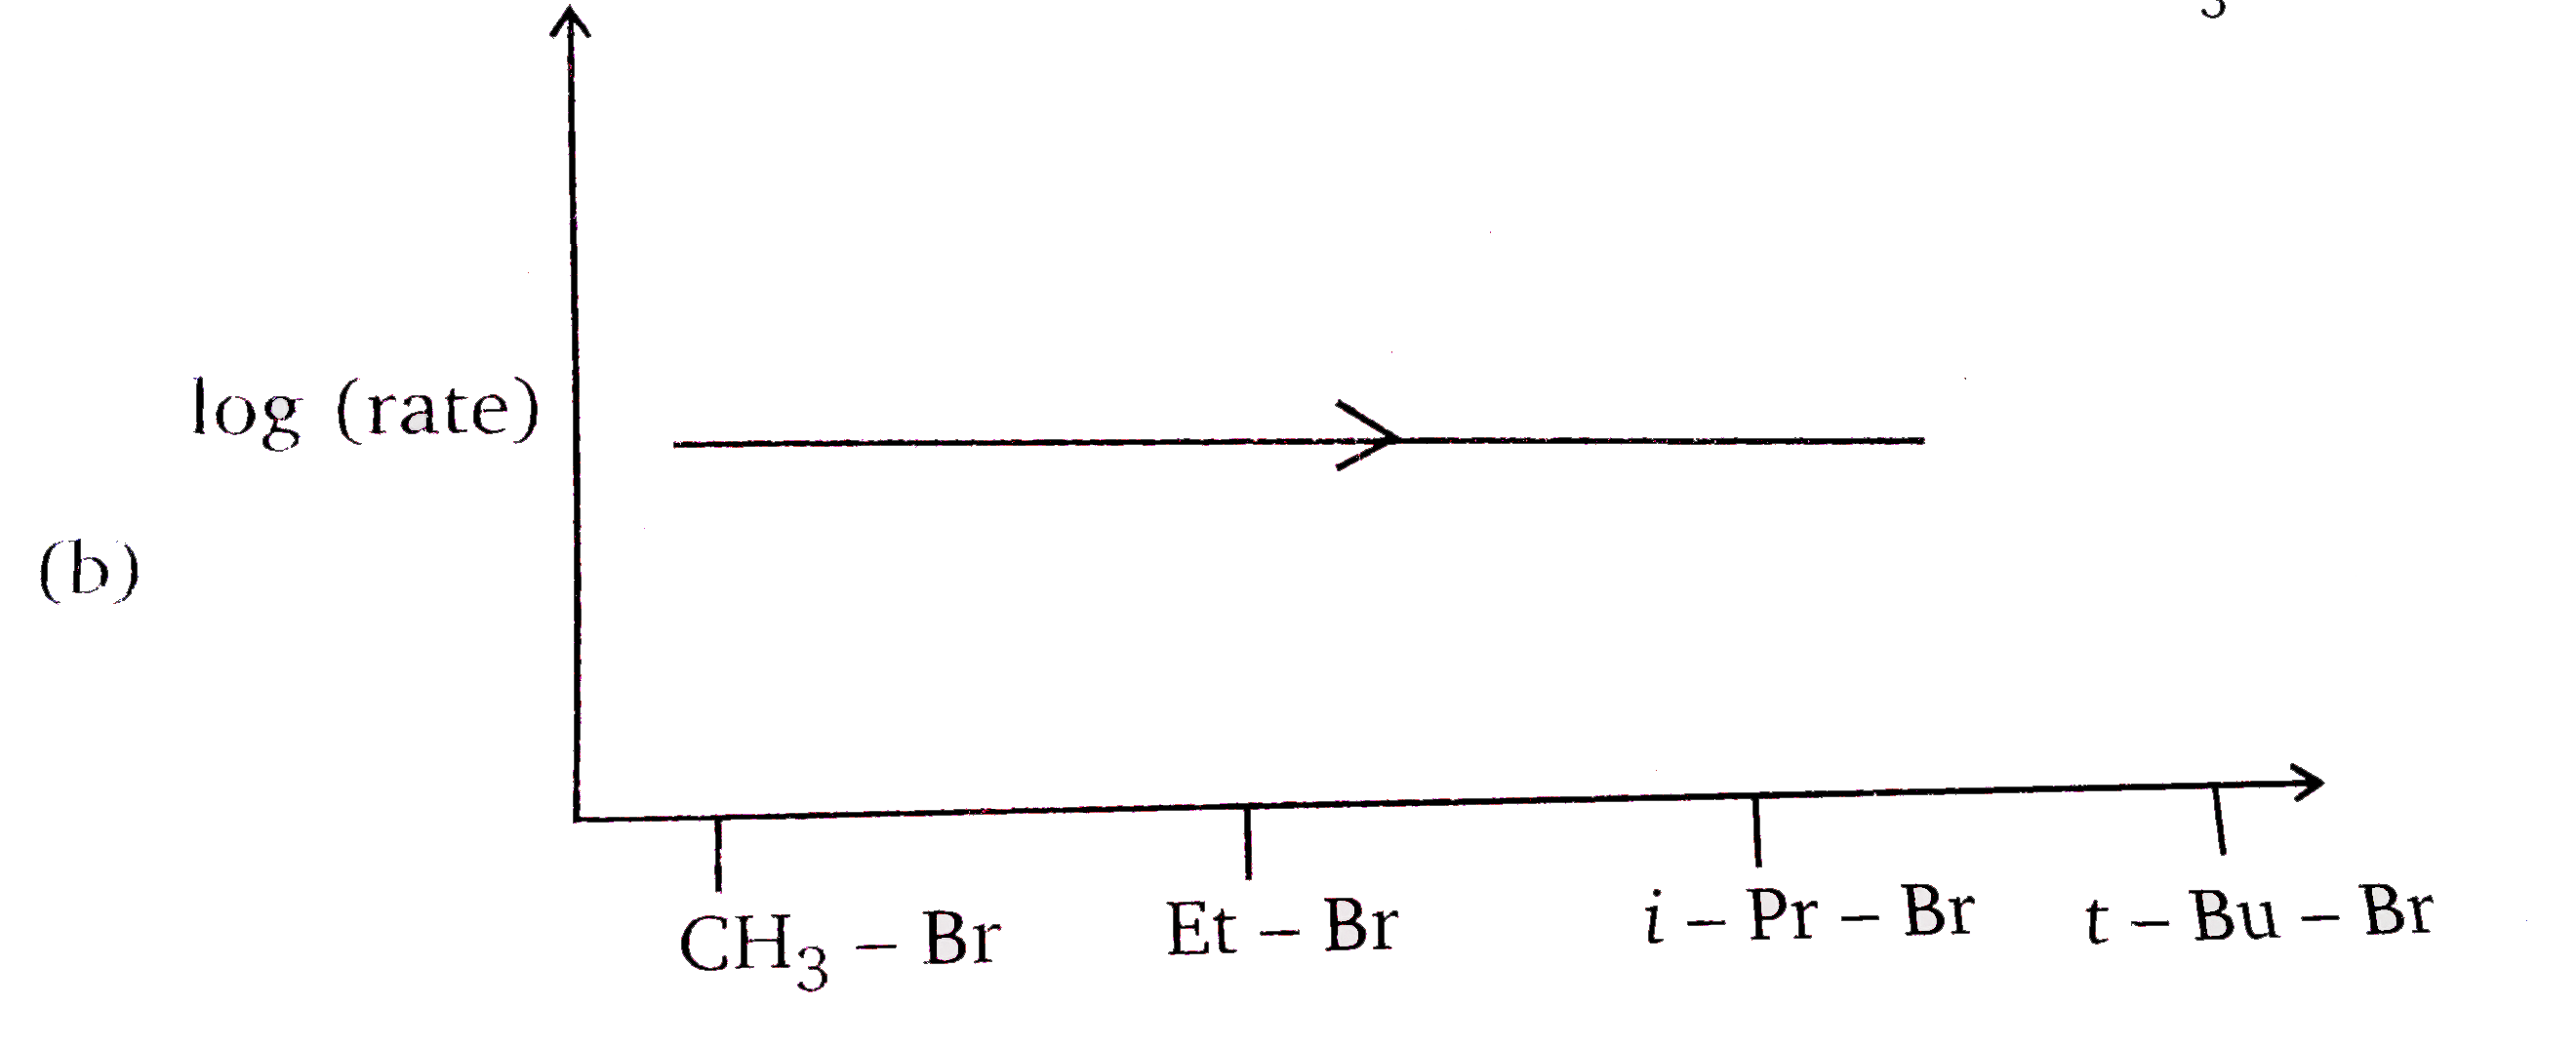
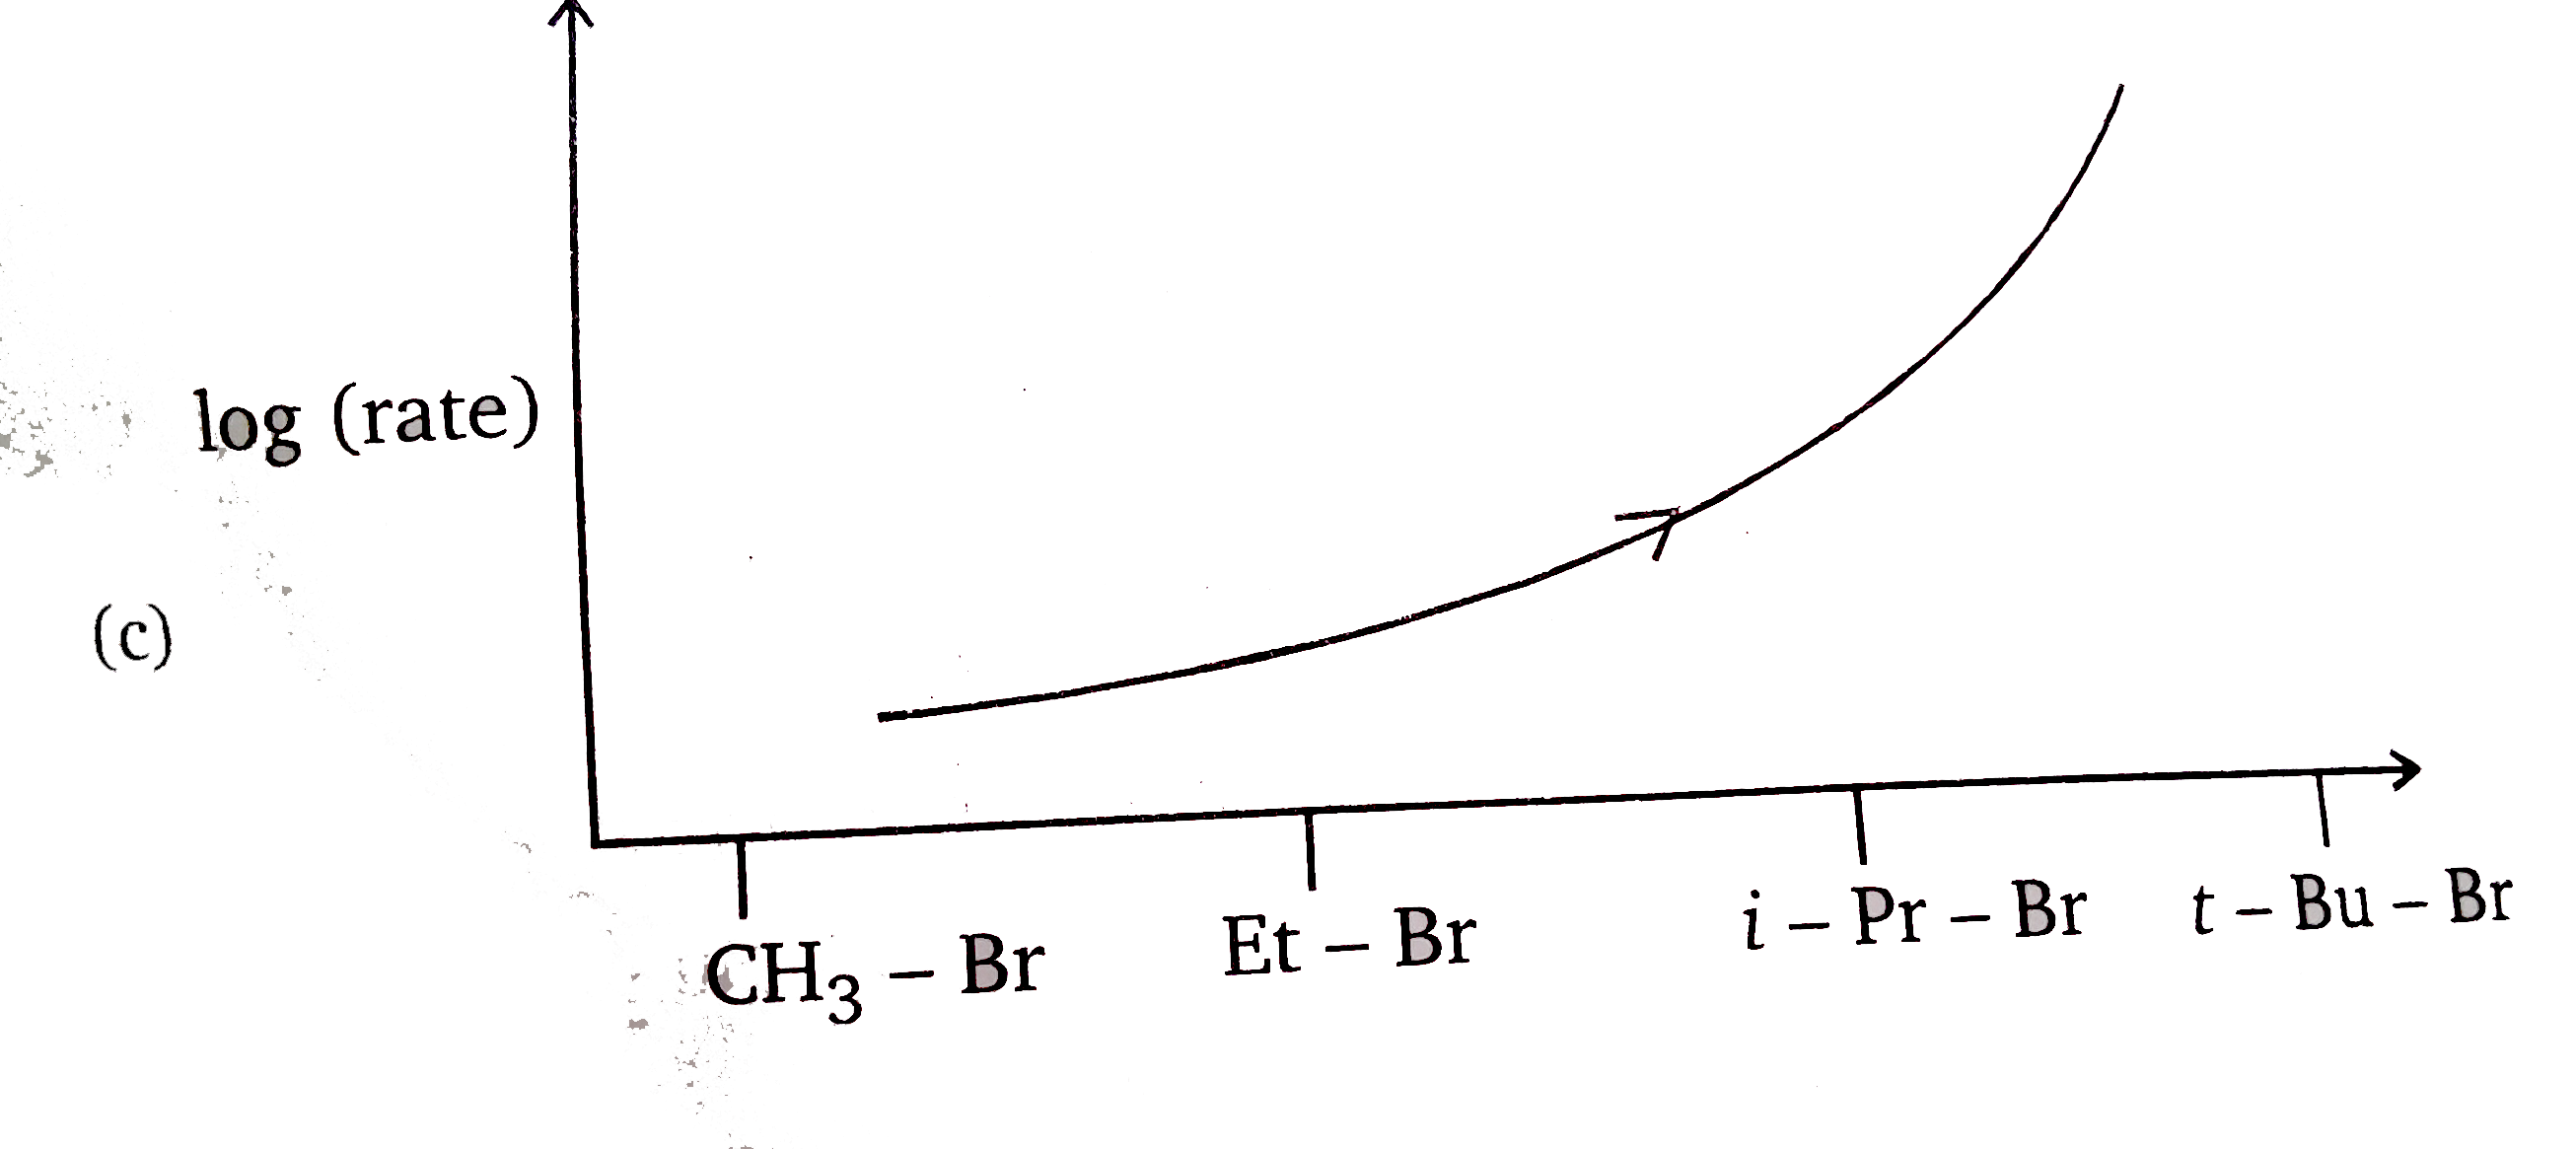
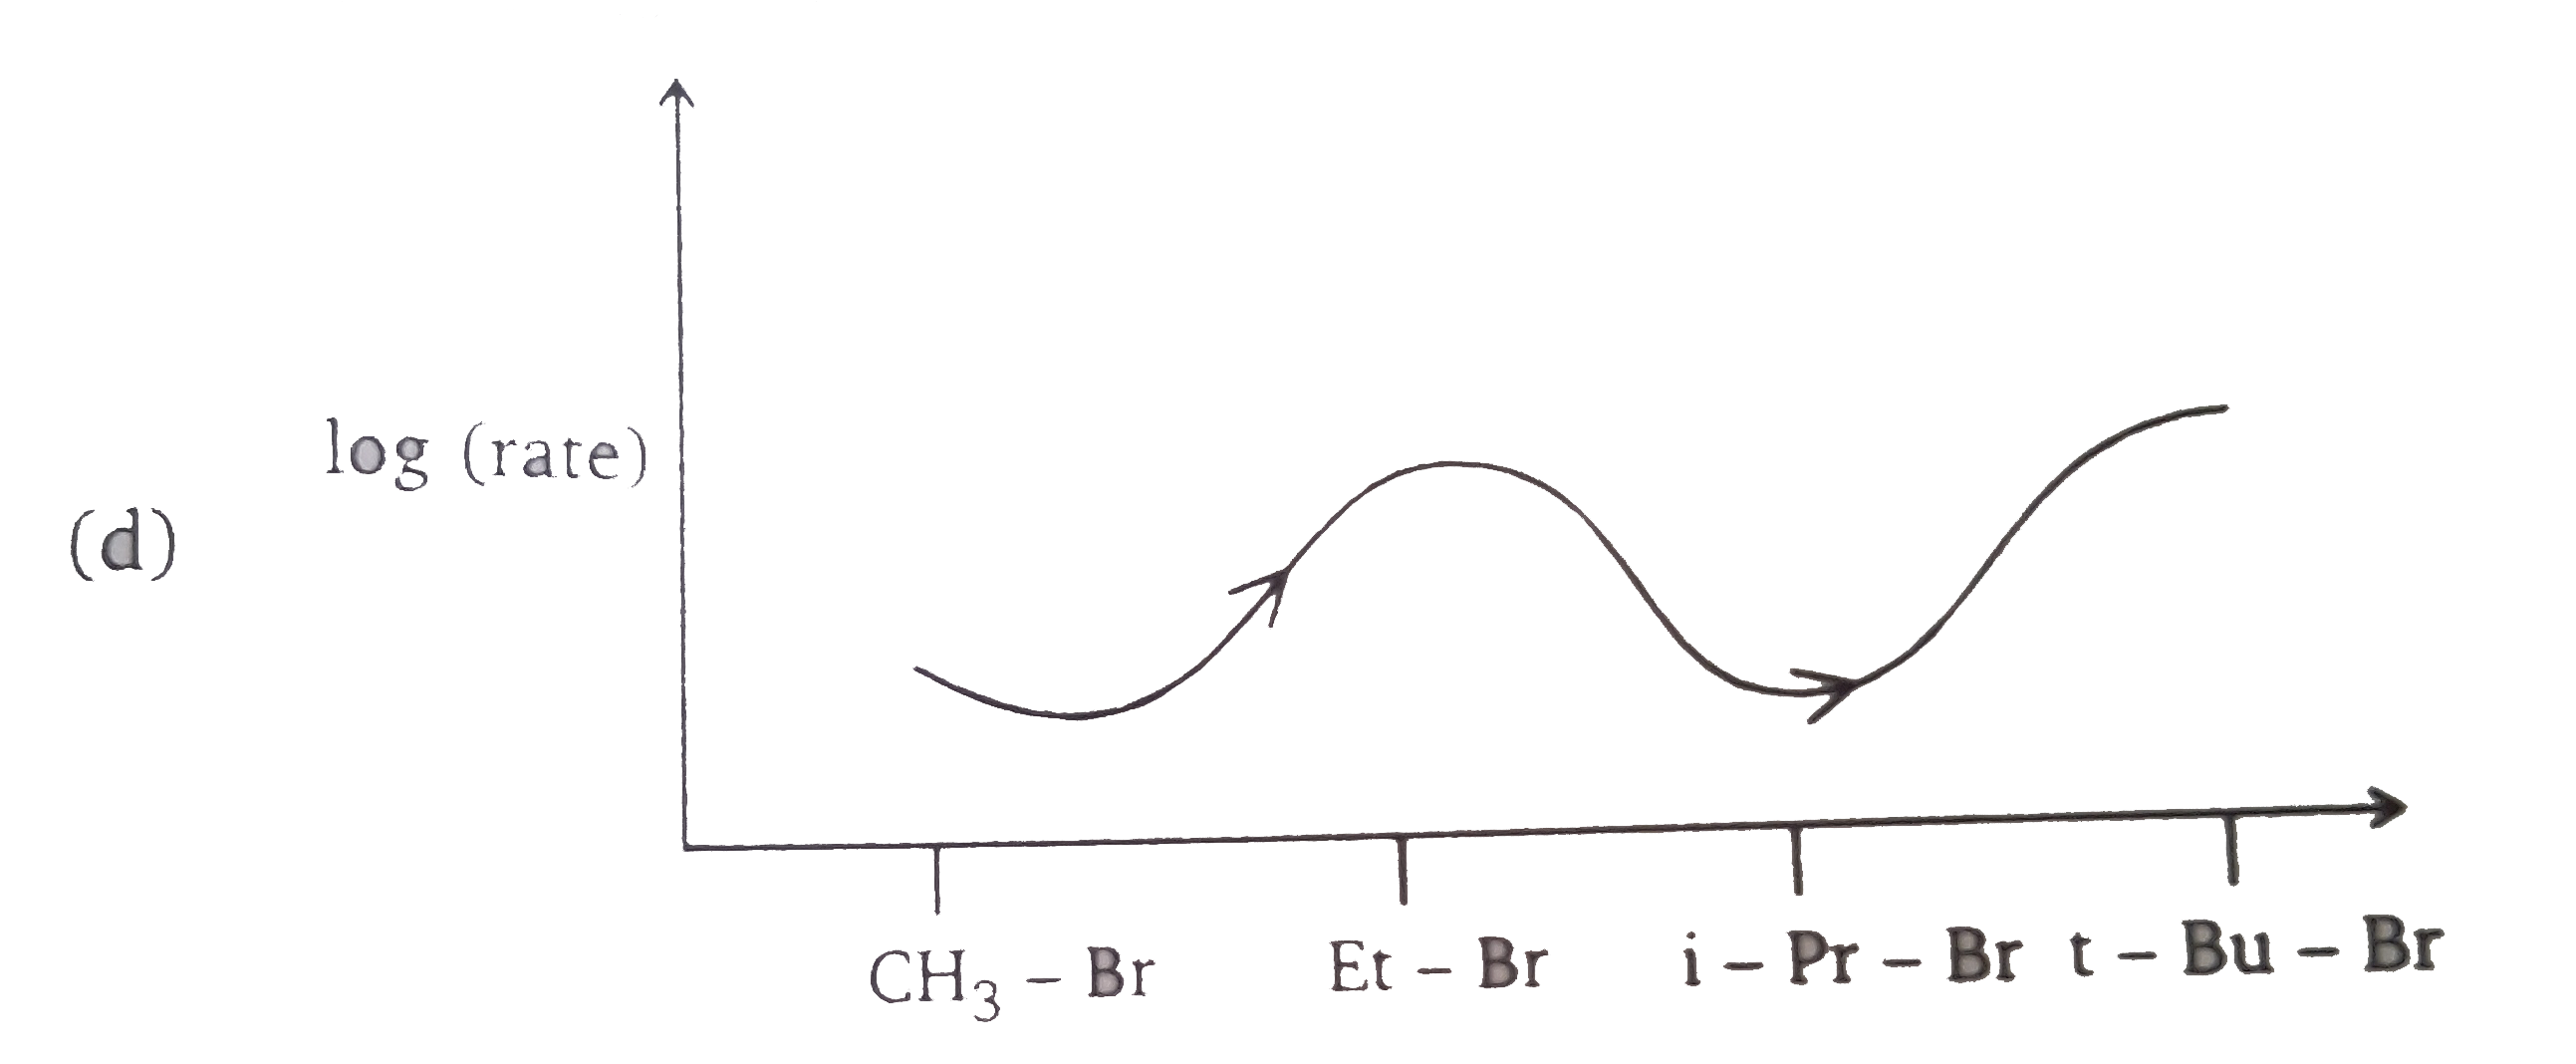
Which of the following graph represents correct graph fopr reaction:
A
B
C
D
Video Solution
Text Solution
The correct Answer is:A, C
(c ) Rate of prop stabiliity of in R.D.S.
|
Updated on:21/07/2023
Topper's Solved these Questions
Similar Questions
Knowledge Check
- Question 1 - Select One
Which of the following graph represents e−x?
A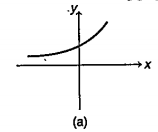 B
B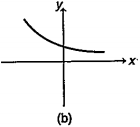 C
C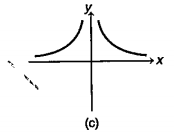 D
D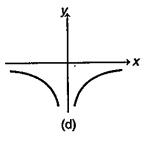
- Question 2 - Select One
Which of the foollowing represents the correct graph for SN2 reaction ?
A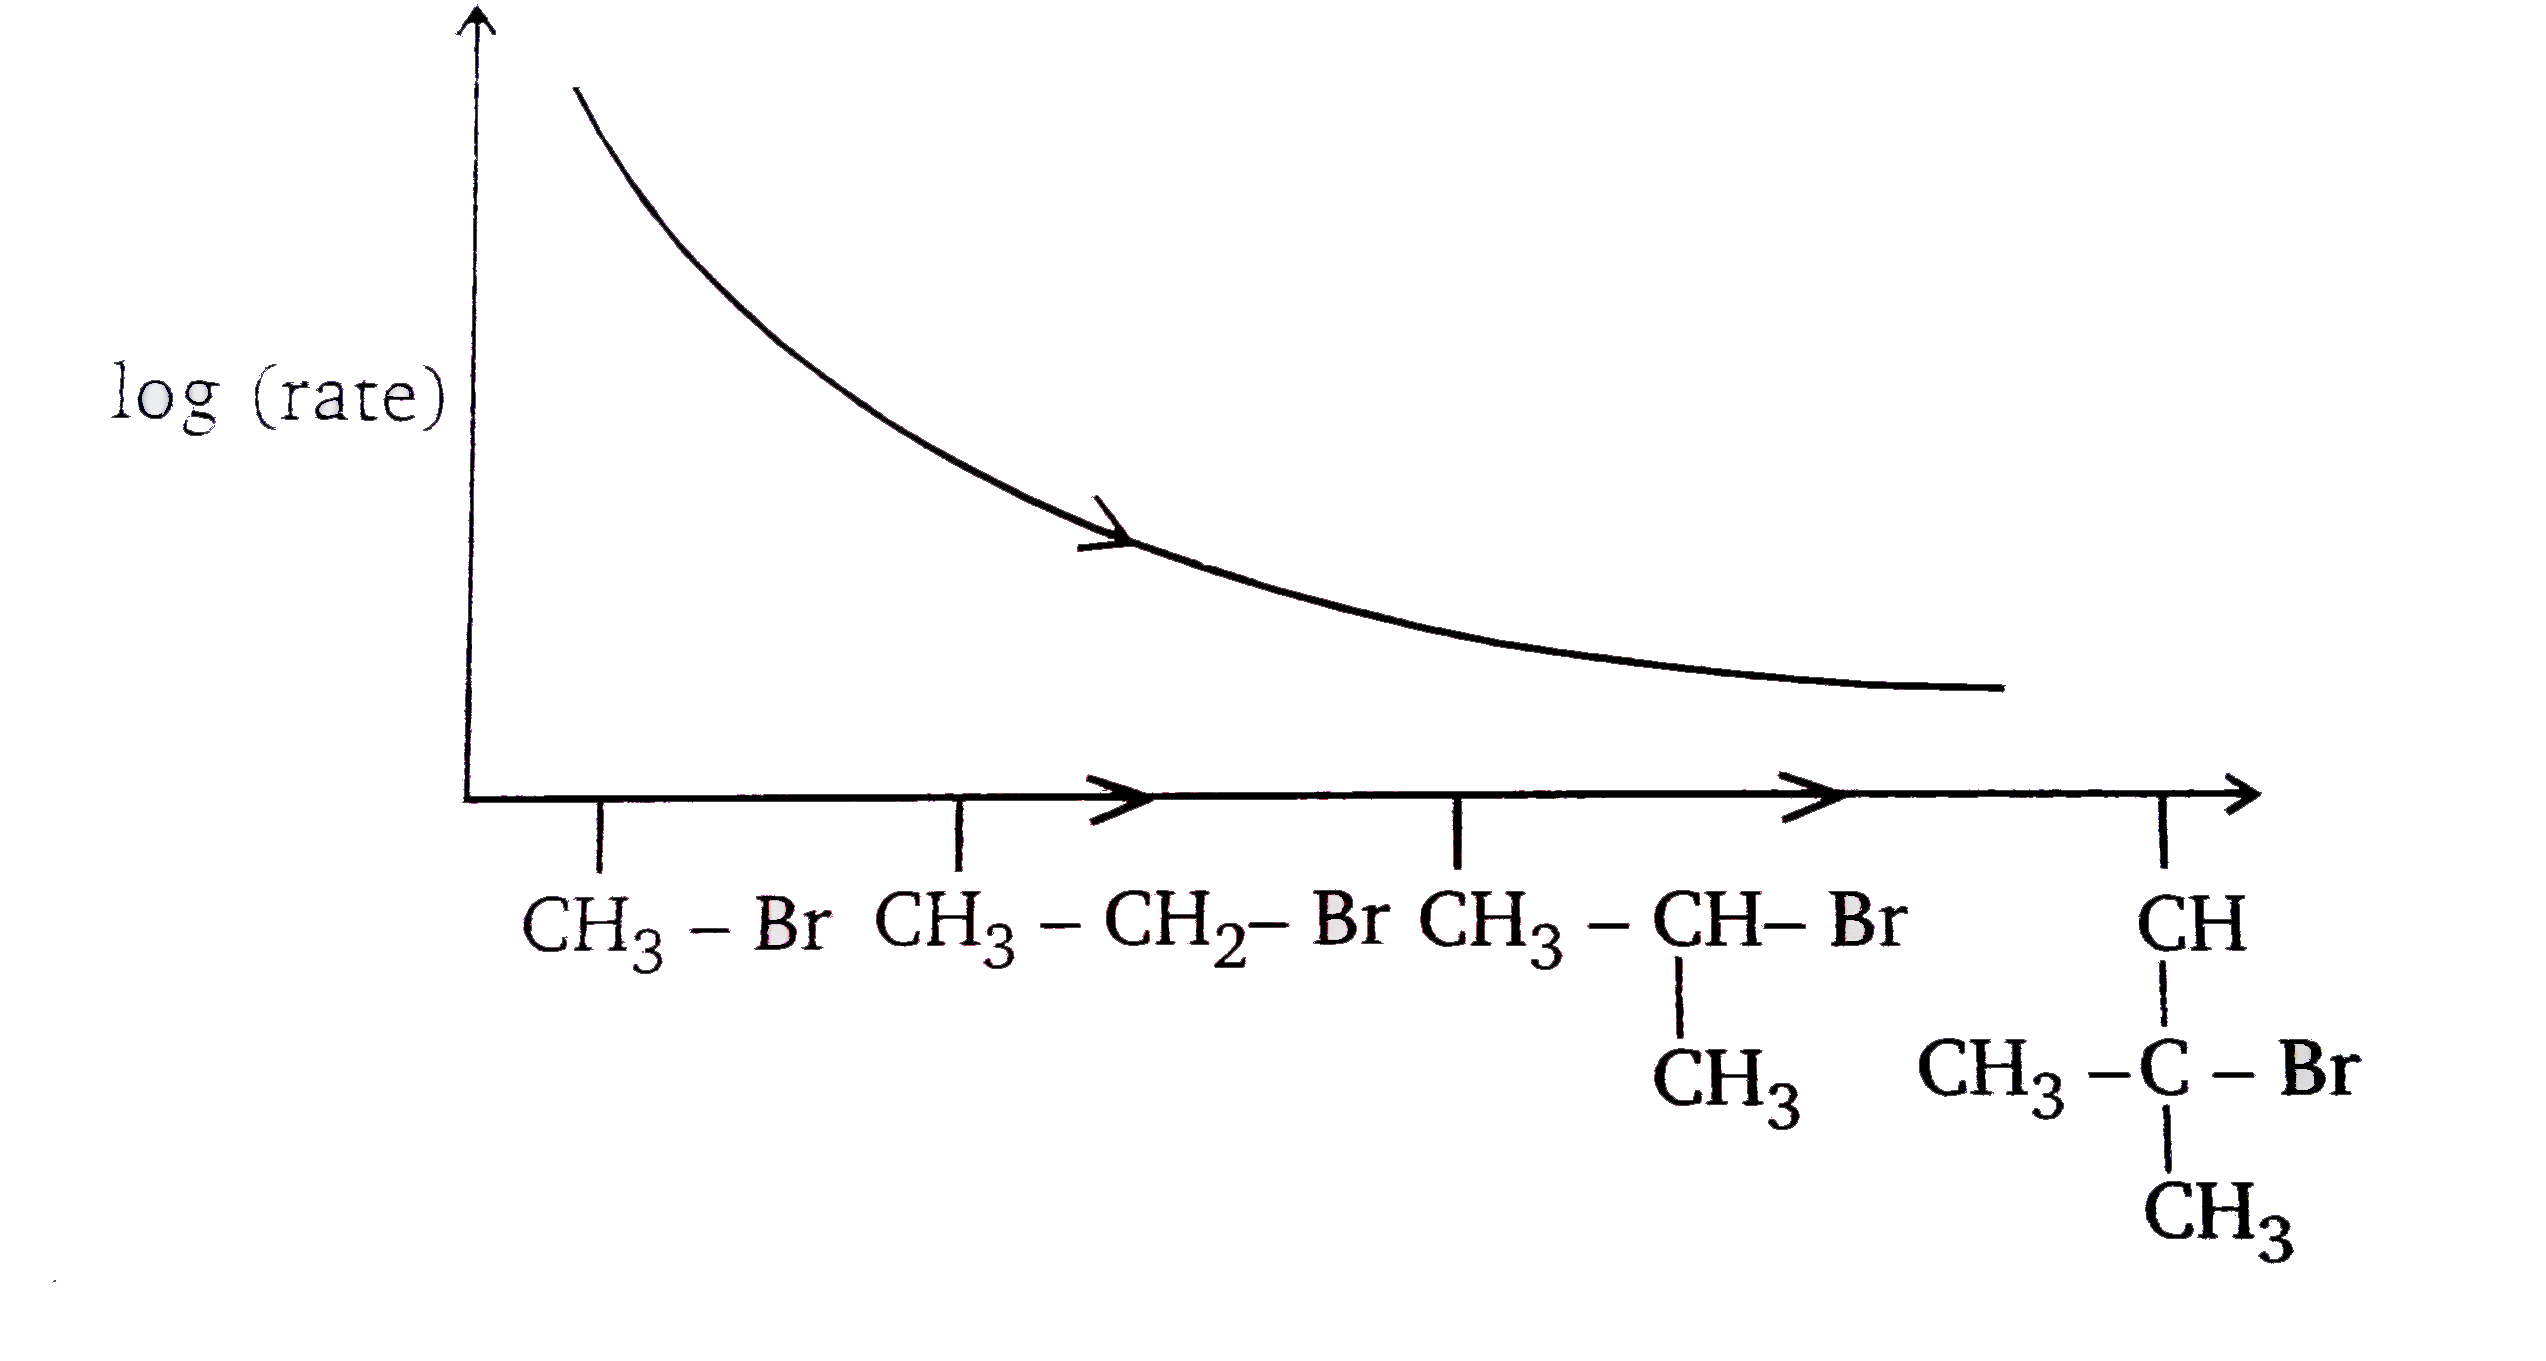 B
B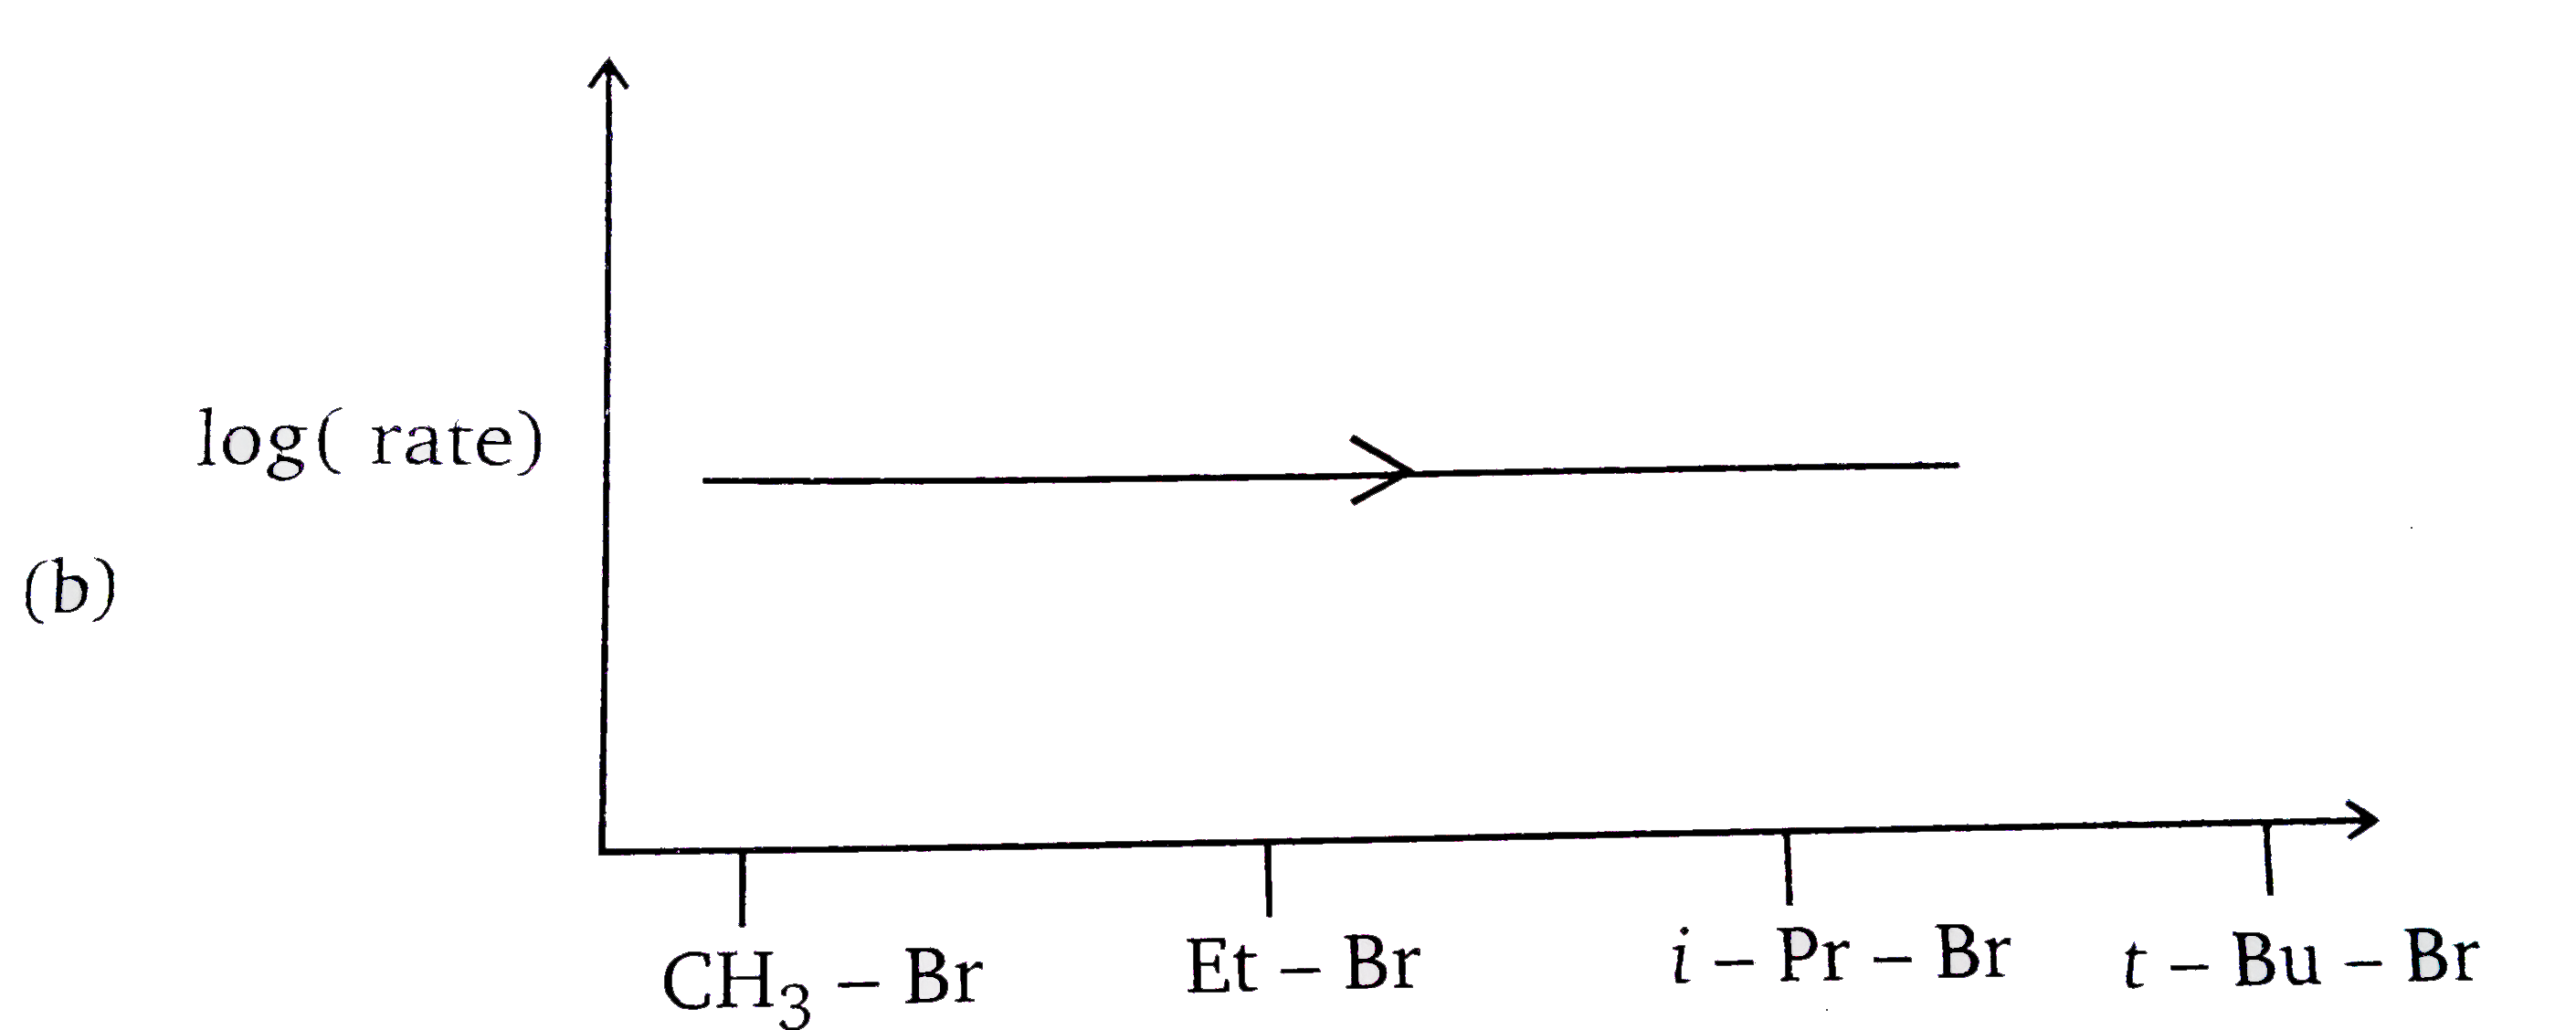 C
C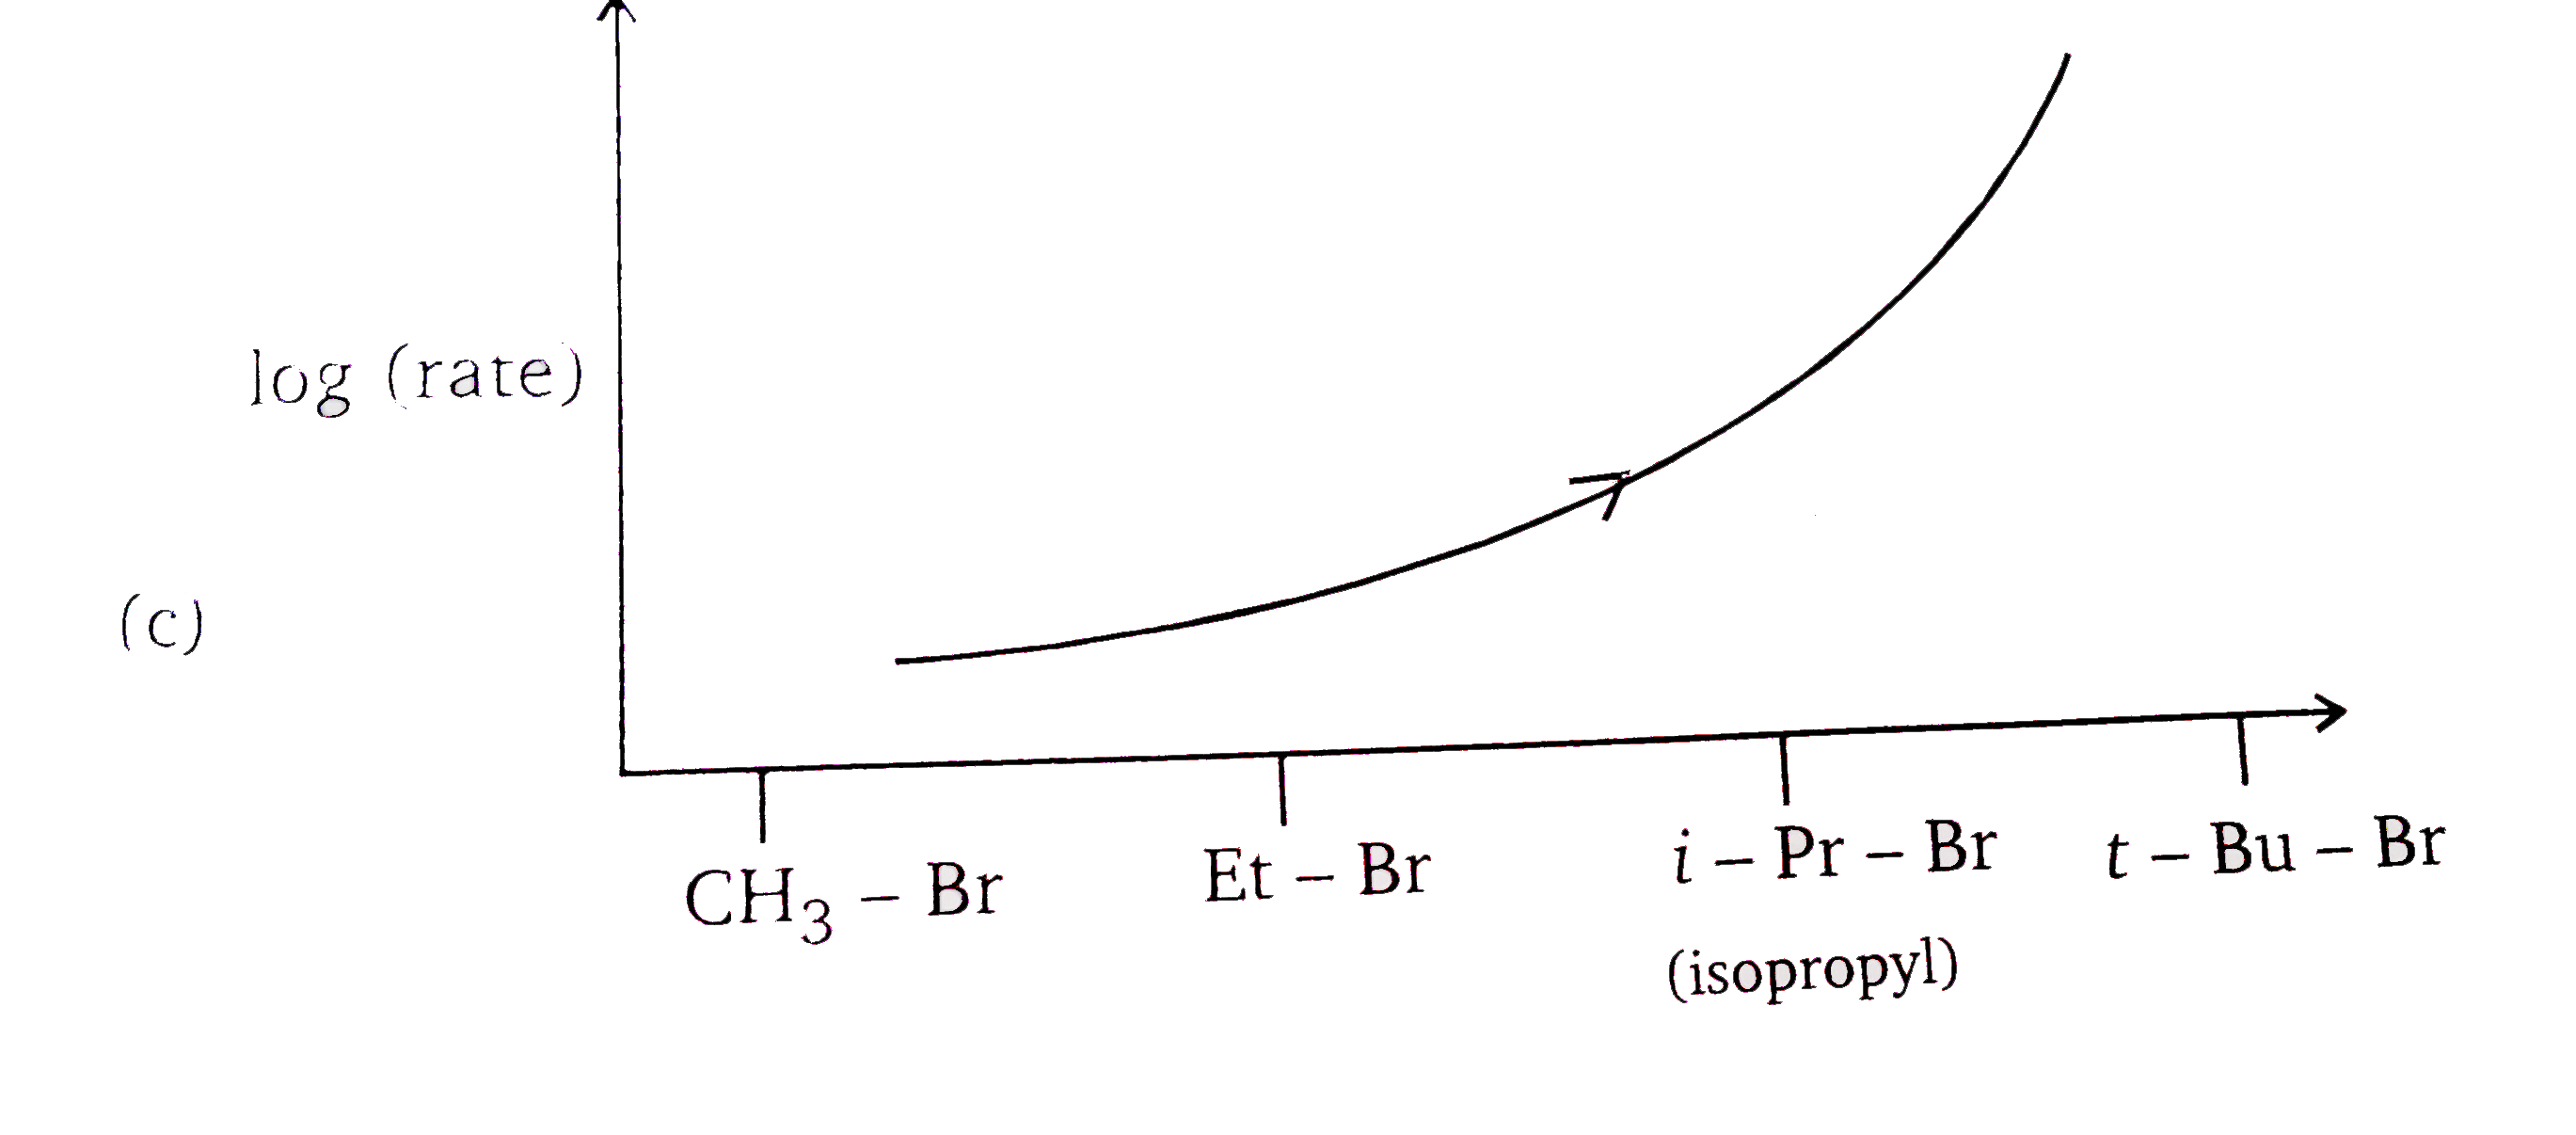 D
D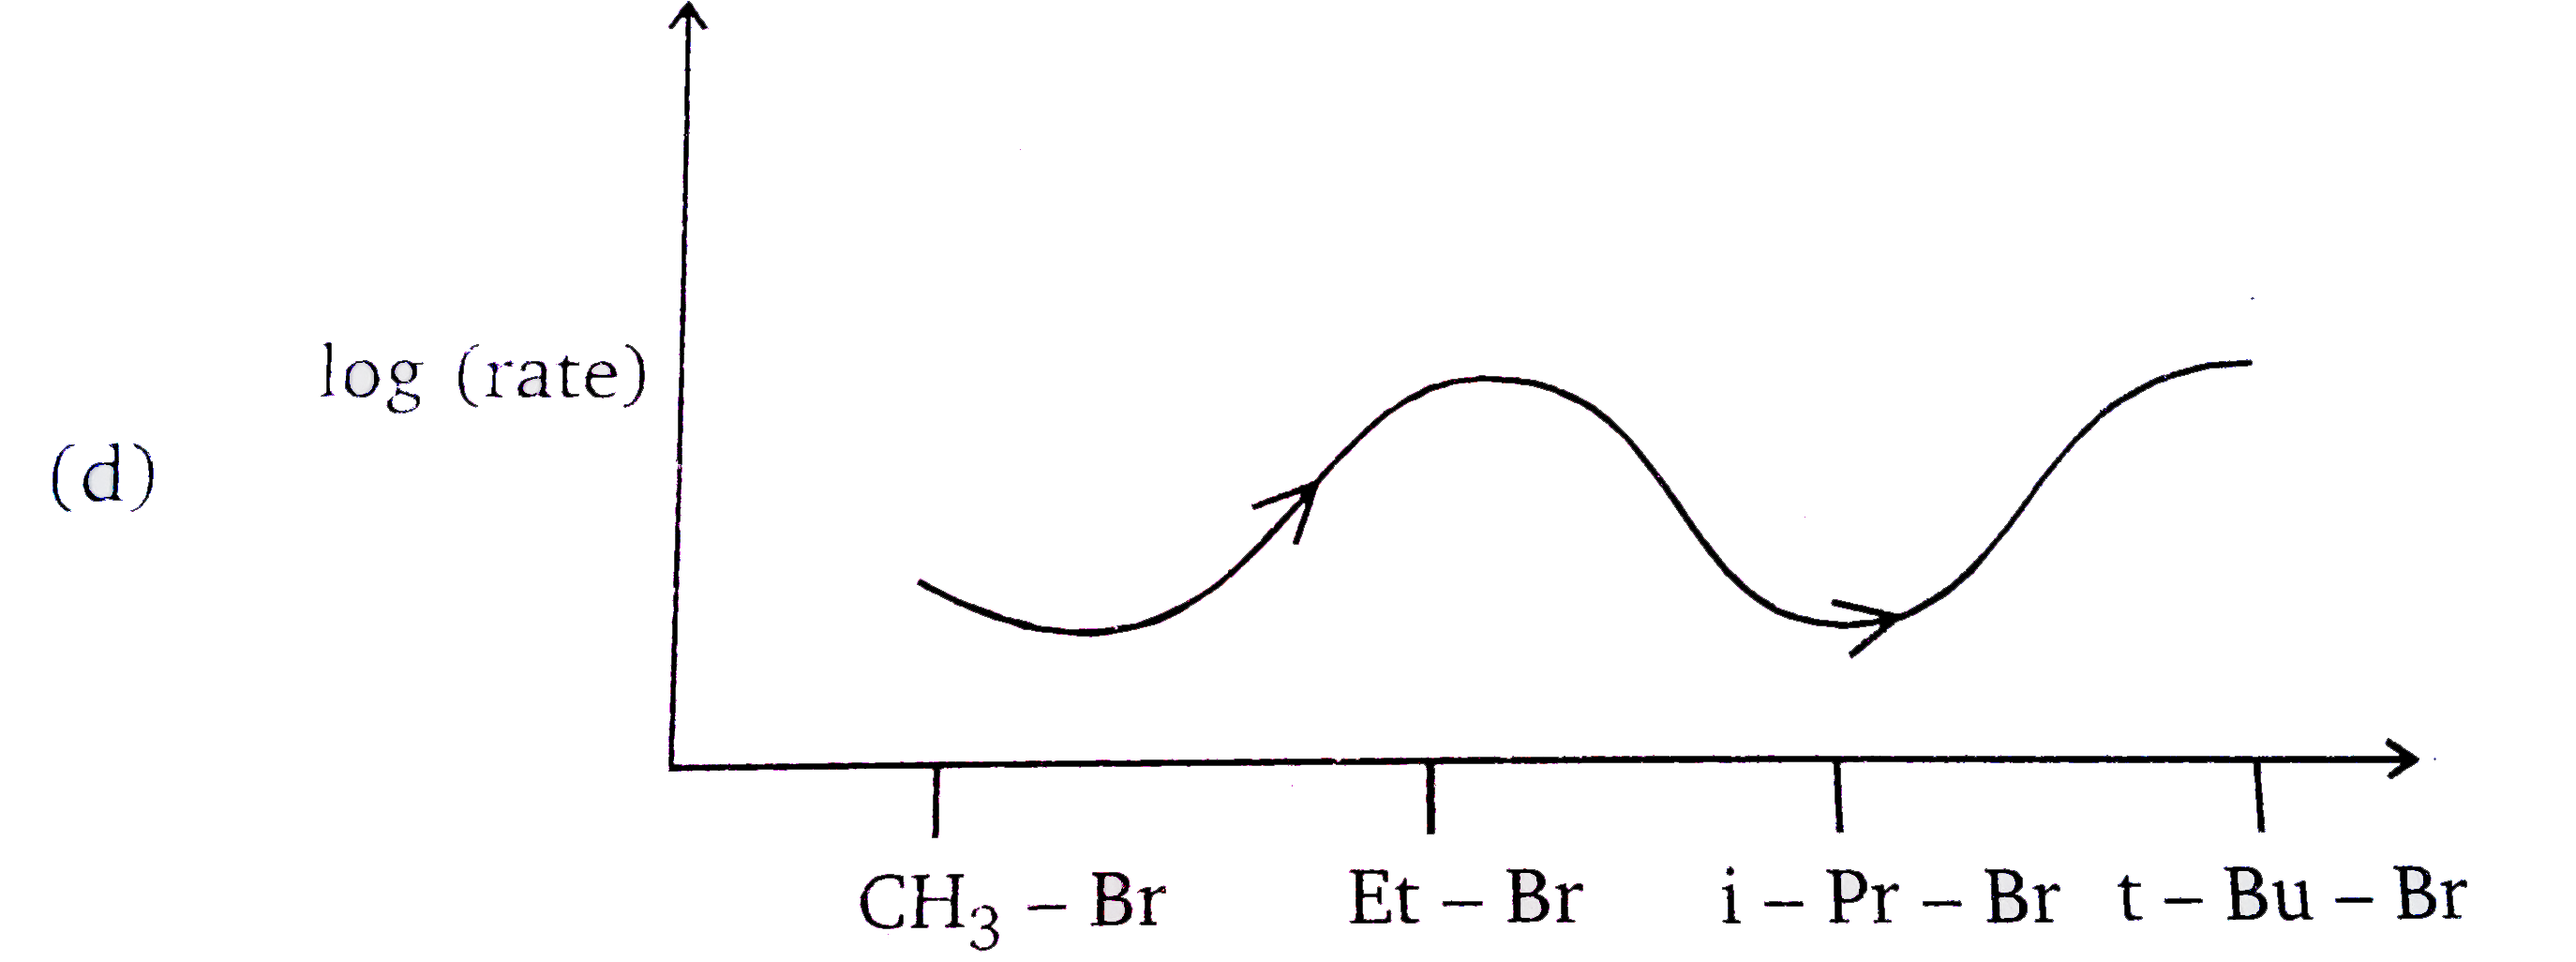
- Question 3 - Select One
Which of the following graph represents 3s orbital
A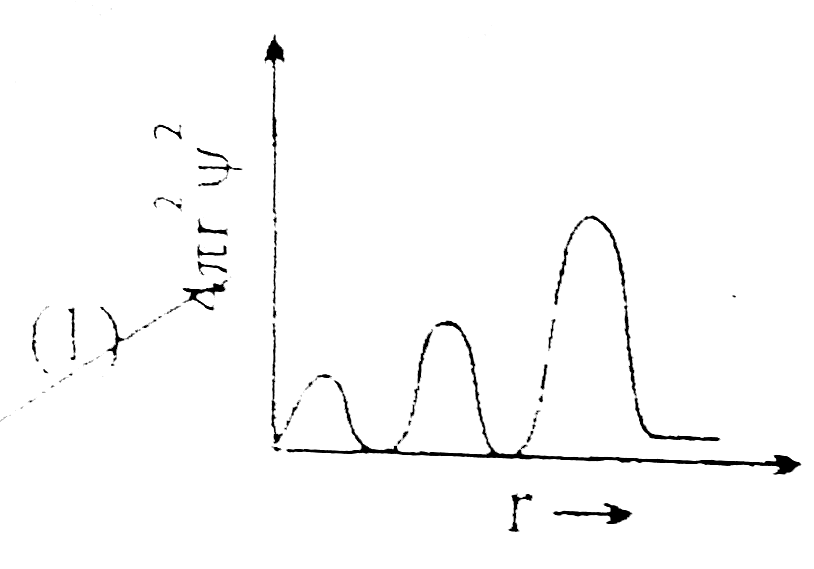 B
B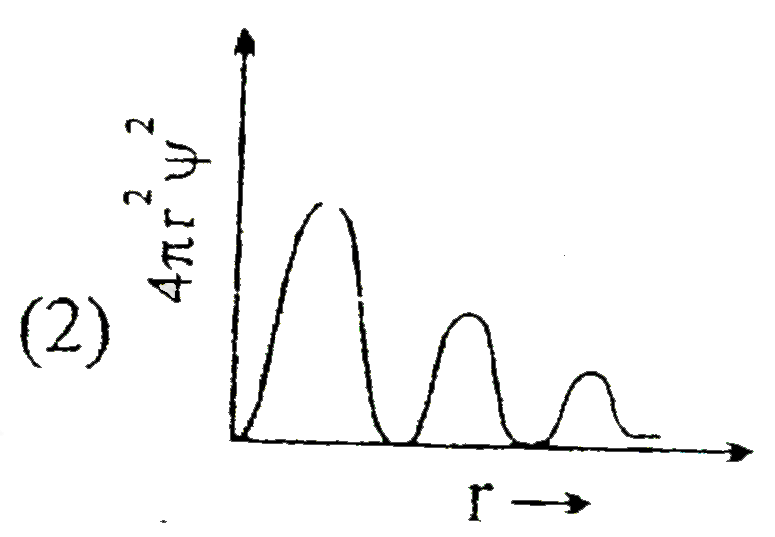 C
C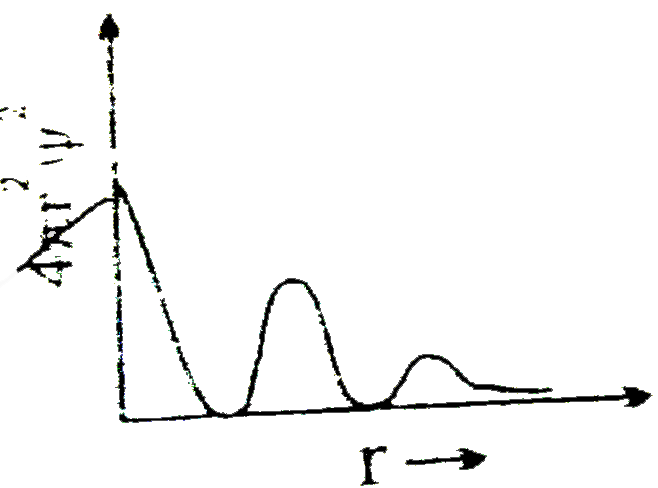 D
D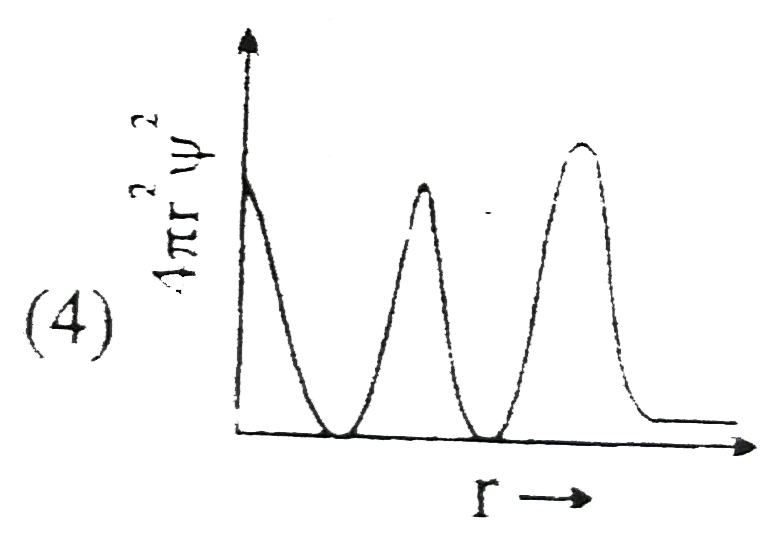
Which of the following graph represents Boyle's law ?
View SolutionWhich of the following graph represent Boyle's law ?
View SolutionWhich of the following graph represents Boyle's law ?
View SolutionWhich of the following graph is correct?
View SolutionWhich of the following graph represents e−x?
View Solution

