A survey was conducted among a randomly chosen sample of 250 single men and 250 single women about whether they owned any dogs or cats. The table below displays a summary of the survey results.
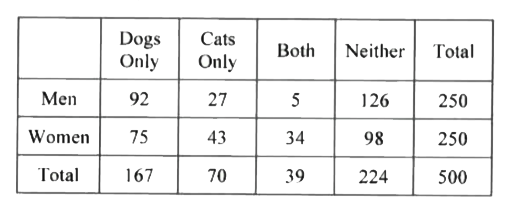
According to the table, which of the following statements is true?
The number of men that reported they had any pets is greater than the number of people that reported they had dogs only.
The number of people that reported they had any pets is less than twice the number of women that reported they had dogs only.
The percentage of men that reported they had dogs only is less than the percentage of people that reported they had cats only.
The percentage of women that reported they had any pets is greater than the percentage of people that reported they did not have any pets.
The correct Answer is:D
Step by step video, text & image solution for A survey was conducted among a randomly chosen sample of 250 single men and 250 single women about whether they owned any dogs or cats. The table below displays a summary of the survey results. According to the table, which of the following statements is true? by Maths experts to help you in doubts & scoring excellent marks in Class 12 exams.
Similar Questions
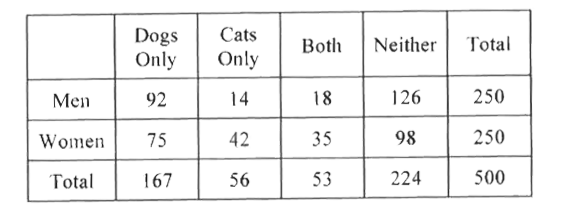
A survey was conducted among a randomly chosen sample of 250 single woman about whether they owned and dogs or cats. The table below displays a summery of the survey results.
What fraction of the people surveyed who said they own dogs are women?View SolutionEach month. The Bureau of Labor Statistics conducts a survey called the Current Population Survey (CPS) to measure unemployement in the United States. Across the country, about 60,000 households are included in the survey sample. These households are grouped by geographic region. A summery of the January 2014 survey results for make responds in one geographica region is shown in the table below.

Q. According to data in the table, for which age group did the smallest percentage of men report that they were unemployed in January 2014?View Solution
Knowledge Check
- Question 1 - Select One
A survey was conducted among a randomly chosen sample of 250 single men and 250 single women about whether they owned any dogs or cats. The table below displays a summary of the survey results.
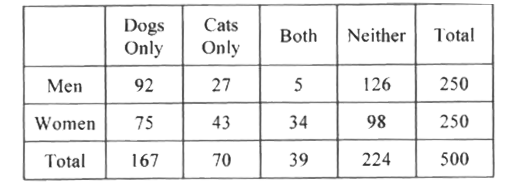
According to the table, which of the following statements is most likely to be false?AThe porability that a woman is a cat owner is greater than the probability that a cat owner is a womanBThe probability that a dog owner is male is greater than the probability that a randomly chosen person is a cat owner.CThe probability that a woman does not own a dog or cat is greater than the probability that a man owns at least one dog and one cat.DThe probability that a cat owner is a woman is greater than the probability that a men owns a dog. - Question 2 - Select One
A survey was conducted among a randomly chosen sample of 100 males and 100 females to gather data on family size. The data are shown in the table below.
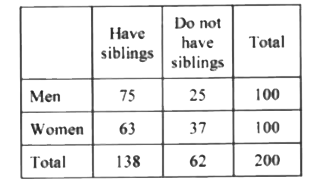
Which of the following is closest to the perecent of those surveyed who have siblings?A31B63C69D75 - Question 3 - Select One
2500 single men and 2500 single women were asked about whether they owned any dogs or cats. The table below displays a summery of the results.
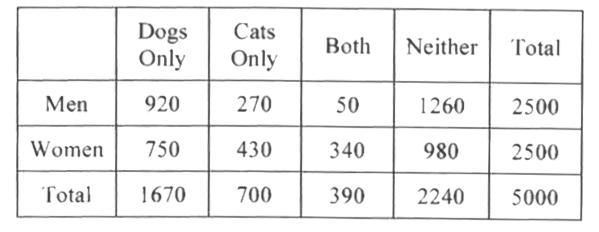
Of the people who said they had neigher dogs nor cats, 200 were selected at random, and they were asked if they had any pets at all. 43 people said they did have pets,and the remaining 157 said that they did not. Based on both the initial data given in the table, together with the new data stated in this paragraph, which of the following is most likely to be accurate?AApproximately 482 of the original people surveyed would say that they have no pets.BApproximately 1758 of the original people surveyed would say that they have no pets.CApproximately 1963 of the original people surveyed would say that they have no pets.DApproximately 3925 of the original people surveyed would say that they have no pets.
Each month. The Bureau of Labor Statistics conducts a survey called the Current Population Survey (CPS) to measure unemployement in the United States. Across the country, about 60,000 households are included in the survey sample. These households are grouped by geographic region. A summery of the January 2014 survey results for make responds in one geographica region is shown in the table below.

Q. If one unemployed man from this sample is chosen at random for a follow-up survey, what is the probability that he will be between the ages of 45 to 54?View SolutionThe members of a city council wanted to assess the opinions of all city residents about converting an open field into a dog park. The council surveyed a sample of 500 city residents who own dogs. The survey showed that the majority of those sampled were in favor of the dog park. Which of the following is true about the city council’s survey?
View Solution744 children from the United States, aged 6 through 11, were tested to see if they were overweight . The data are shown in the table below.

∗ According to the table, which of the following statements is most likely to be true about children between 6 and 11 years old, inclusive, in the United States ?View SolutionThe table below shows the results of a survey of 250 people who were asked whether they like to read and whether they play a musical instrument.
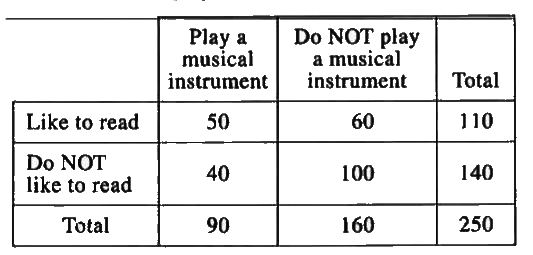
According the the results, what is the probability that a randomly selected person who was surveyed likes to read, given that the person plays a musical instrument?View SolutionThe Harrisburg Recreation Center recently changed its hours to open 1 hour later and close 3 hours later than it had previously. Residents of Harrisburg age 16 or older were given a survey and 560 residents replied. The survey asked each resident his or her student status (high school, college, or nonstudent) and what he or she thought about the change in hour (approve, disapprove, or no opinion). The results are summarized in the table below.

Suppose a person will be chosen at random from these 560 residents. Which of the following values is closest to the probability that the person chosen will NOT be a high student and will NOT have replied with no opinion?View Solution

