
The test grades of the 26 students in a math class are shown in the chart above. What is the median test grade for the clsss?
The correct Answer is:87
Step by step video, text & image solution for The test grades of the 26 students in a math class are shown in the chart above. What is the median test grade for the clsss? by Maths experts to help you in doubts & scoring excellent marks in Class 12 exams.
Updated on:21/07/2023Similar Questions
The table shows the marks obtained by 25 students in a class test. Find the mean of the marks obtained

View SolutionIn State X,Mr. Camp’s eighth-grade class consisting of 26 students was surveyed and 34.6percent of the students reported that they had at least two siblings. The average eighth‑grade class size in the state is 26. If the students in Mr. Camp’s class are representative of students in the state’s eighth-grade classes and there are 1,800 eighth-grade classes in the state, which of the following best estimates the number of eighth‑grade students in the state who have fewer than two siblings?
View Solution
Knowledge Check
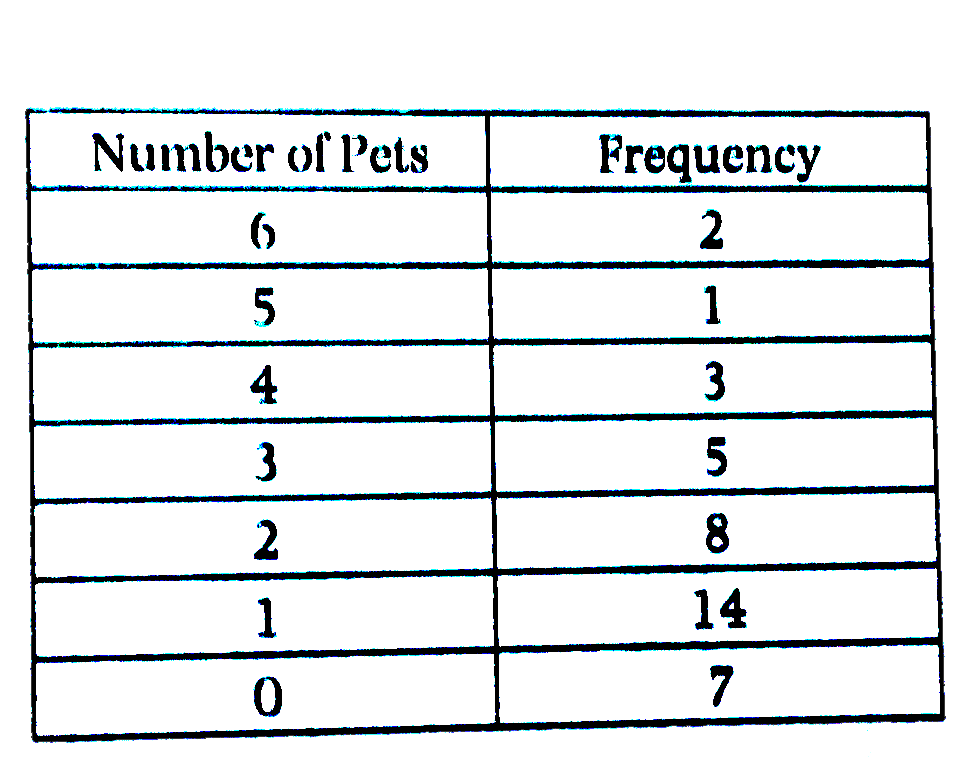
The number of pets owned by children in a sixth grade class are shown in the table above . What is the median of the data ?A1B2C3D5In a particular college, the test scores of the most recent test given for a particular Physics class and a particular Literature class were studied. Both tests were scored from 0 to 100 and had a total of 20 question, which were equally weighted with no partial credit. The physics class had 128 students and the Literature class had 75 students . The test results are shown in the two graphs below.
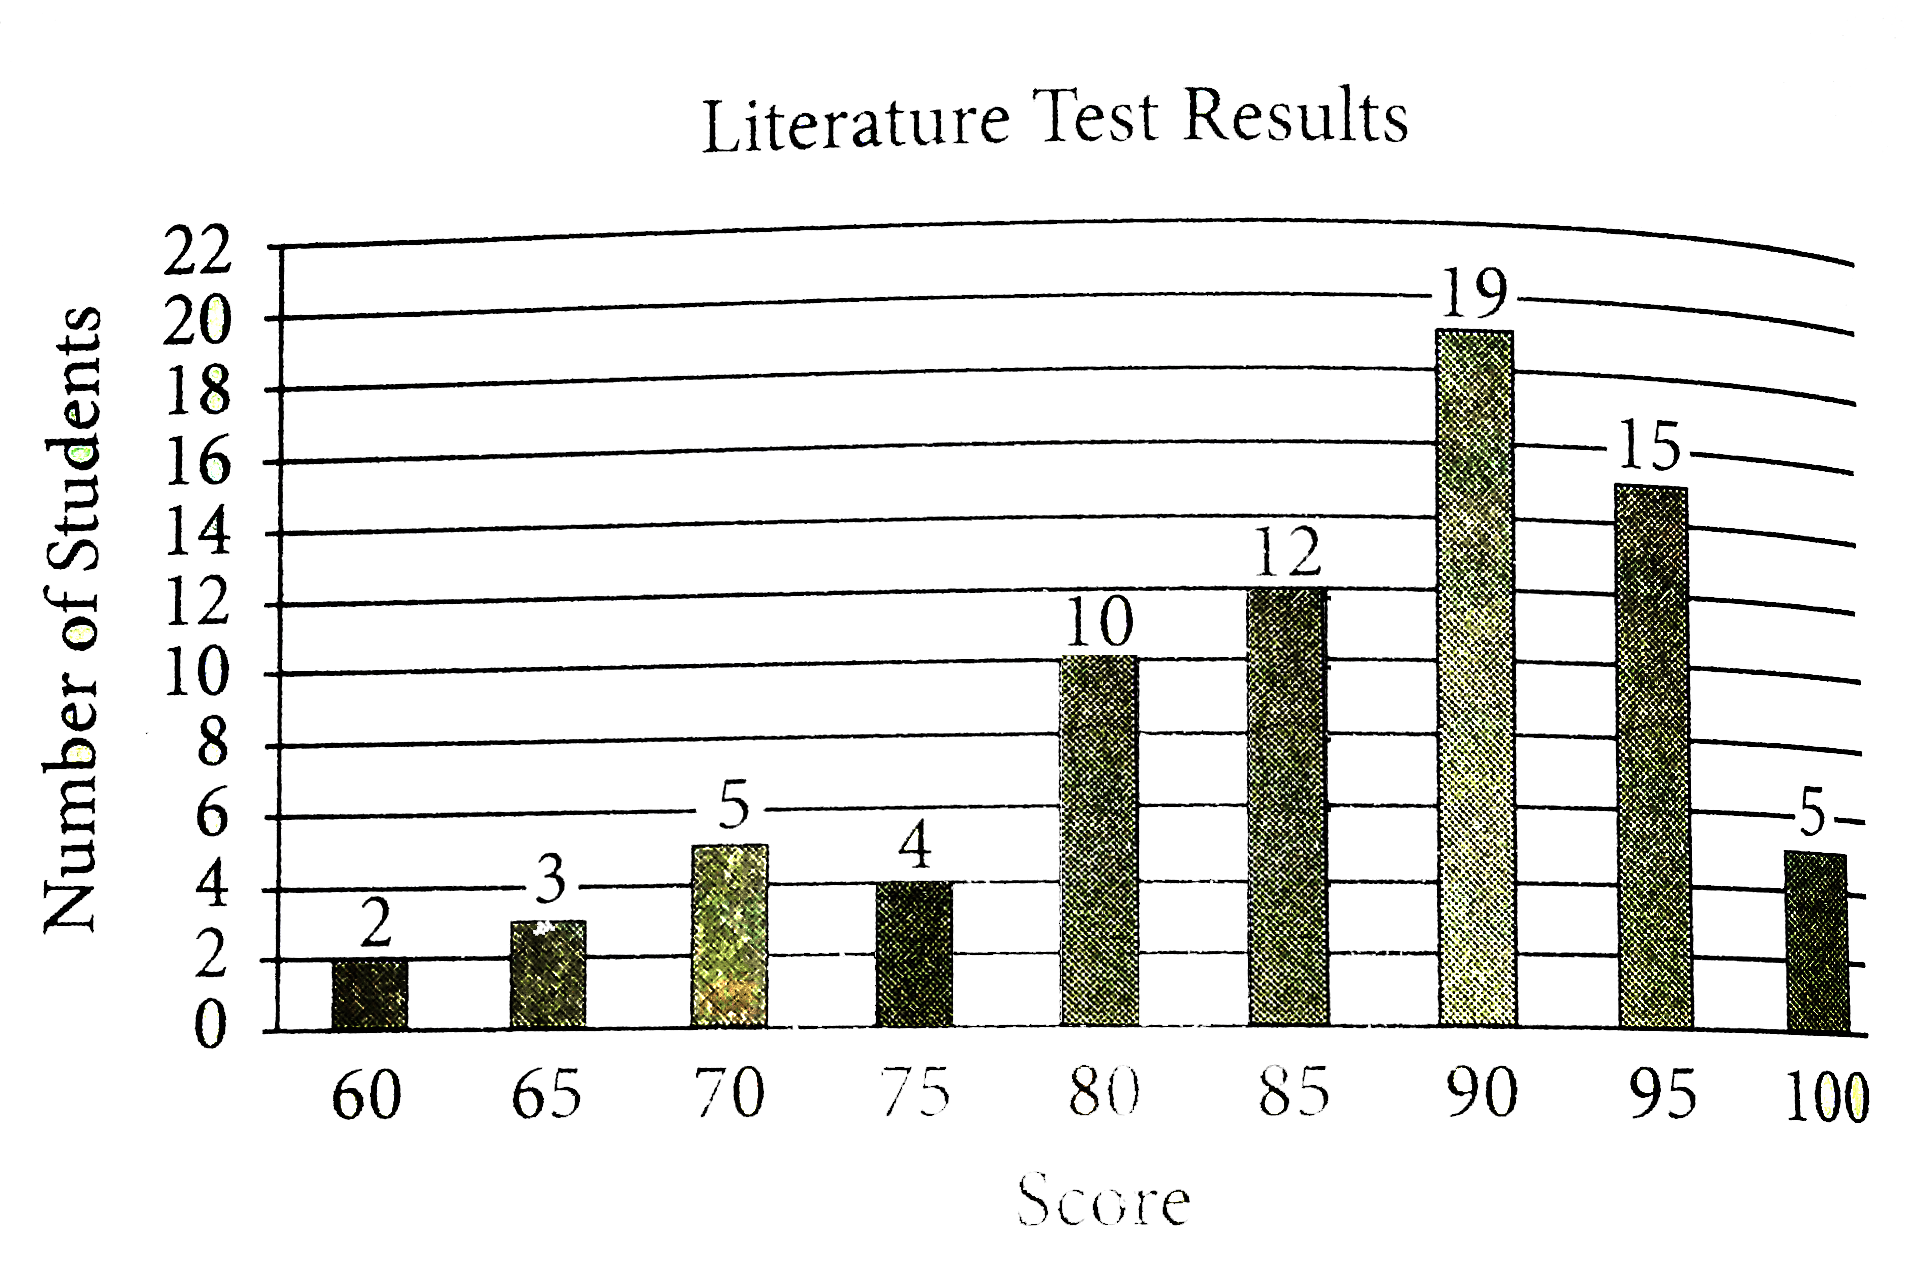
The dean of the college is comparing the scores from the two classes and calculates the median for each class. If the dean labels the median score of the Physics class P and the median score of the Literature class L, what is the sum of P and L?A175B170C85D80The highest and lowest test scores of five students in Mr . Canyon's science class are listed below . Which students had the greatest range of scores ?
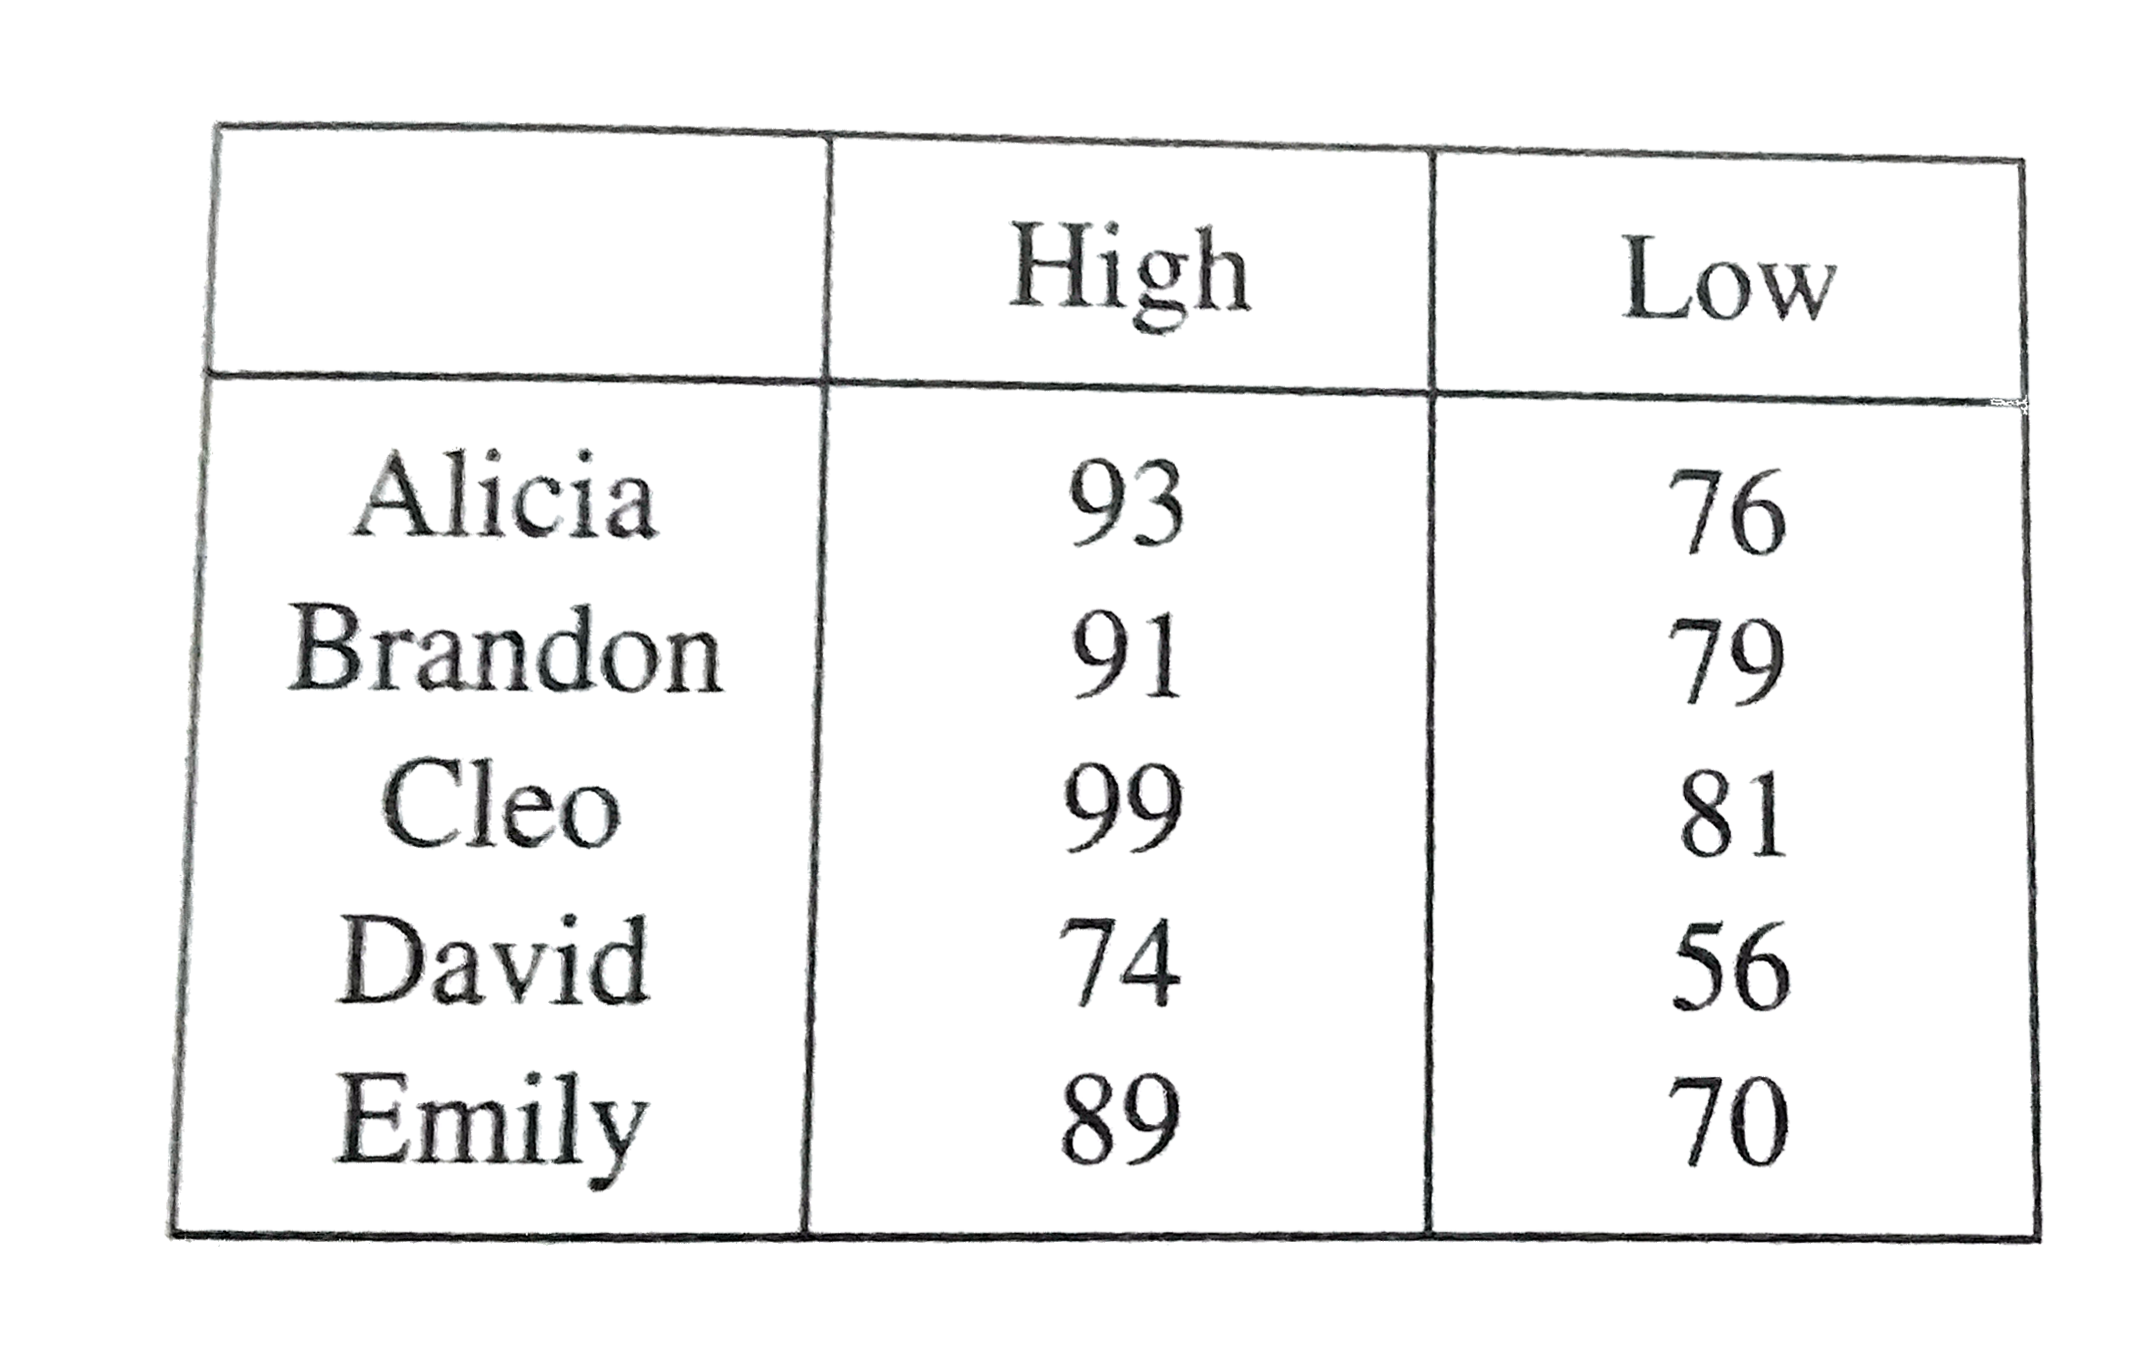 AAliciaBBrandonCCleoDEmily
A student draws a cumulative frequency curve for the marks obtained by 40 students of a class as shown below. Find the median marks obtained by the students of the class. (FIGURE)
View Solution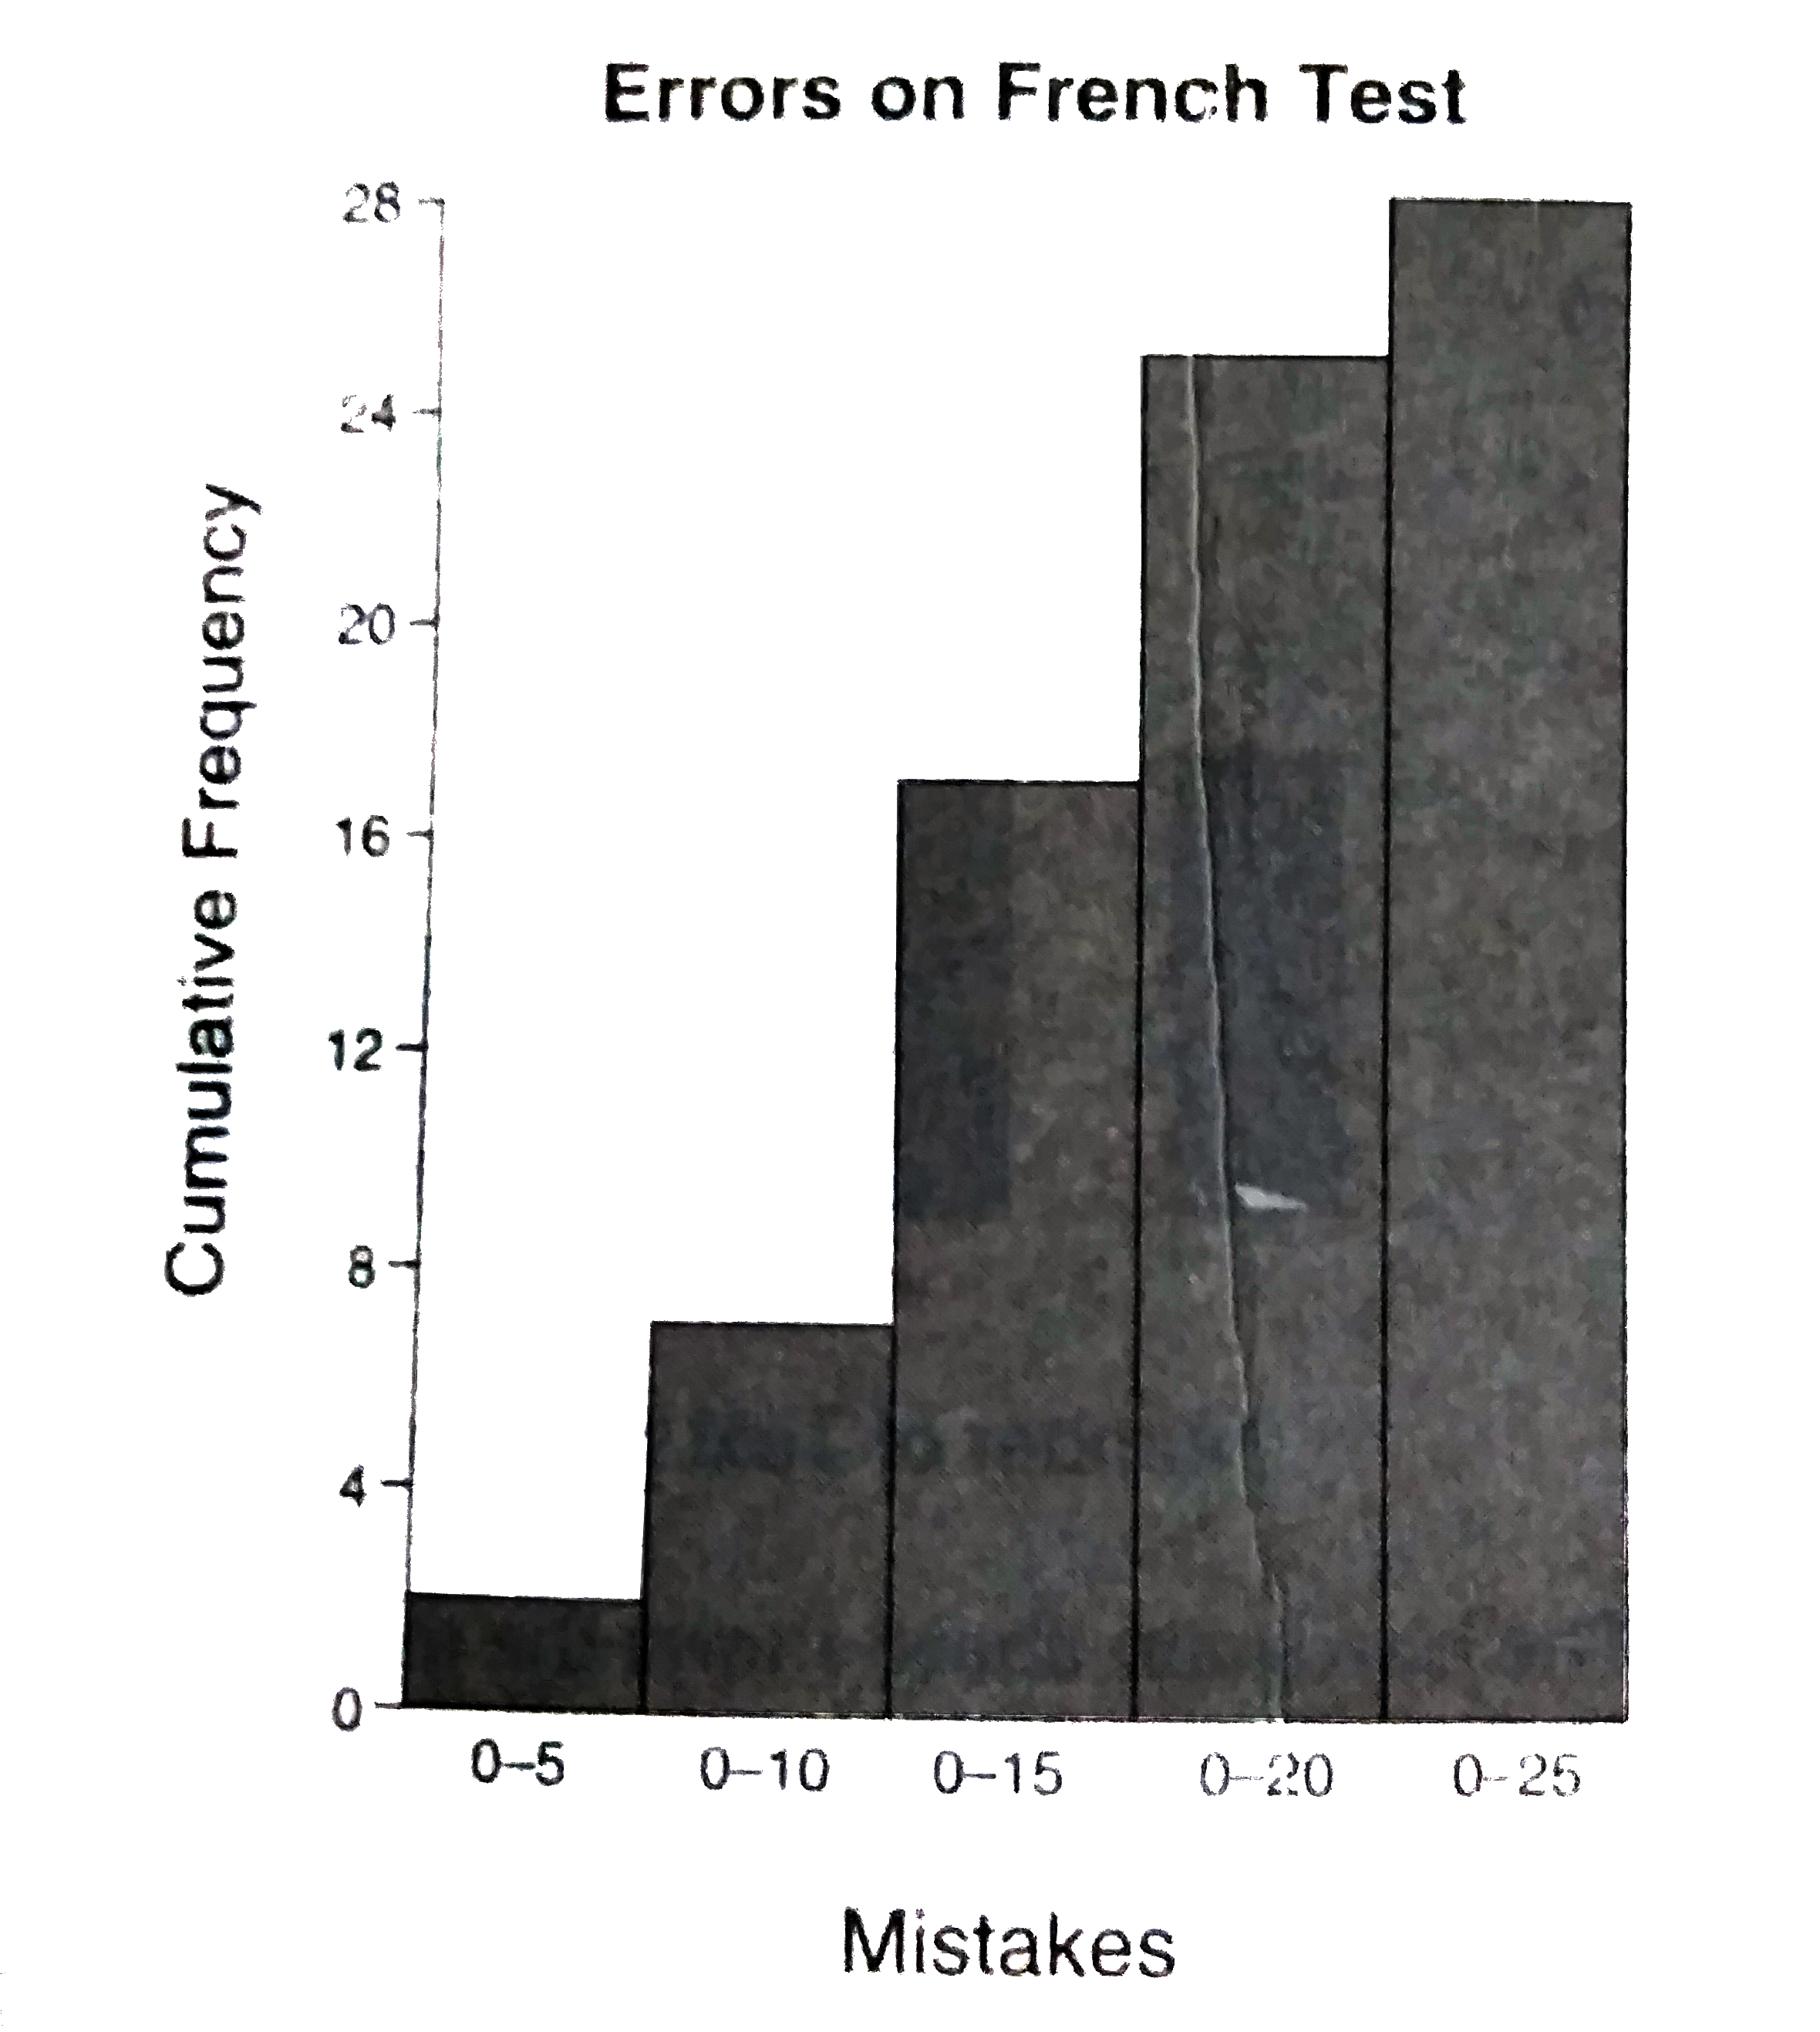
The cumulative histogram above shows the distribution of mistakes 28 students in a French languge class made on a test. What is the probability that a student selected at random made more than 10 mistakes?
View Solution
The frequency chart shows test scores for a certain class. The total number of student is 31. If a student in the class was picked at random , what is the probability that the student's score was below 71 ?
View SolutionA national math examination has 4 statics problems. The distribution of the number of students who ansered the question correctly is shown in the chart. If 400 students took the exam and each question was worth 25 points, then what is the average score of the students taking the exam?
Question NumberNumber of students who solved the question1200230433504250
View Solution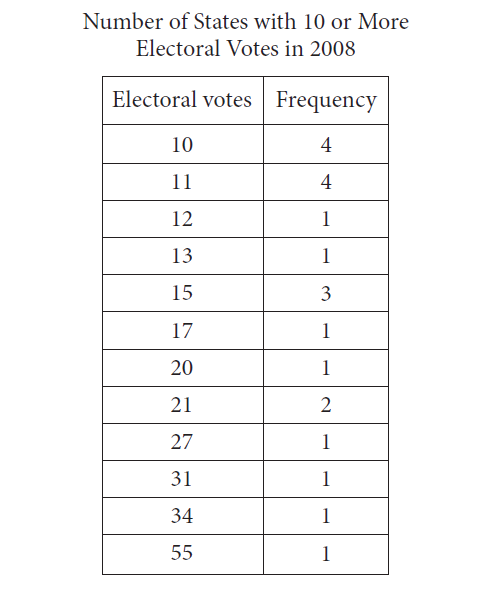
In 2008, there were 21 states with 10 or more electoral votes, as shown in the table above. Based on the table, what was the median number of electoral votes for the 21 states?
View Solution
