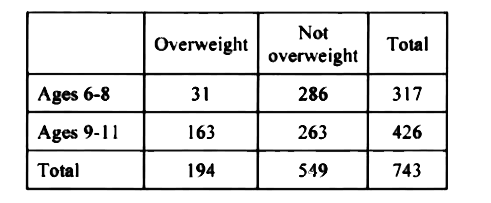
743 children from the United States, aged 6 through 11, were tested to see if they were overweight . The data are shown in the table below.

In 2014 the total population of children between 6 and 11 years old, inclusive , in the United States was about 74.3 million. If the test results are used to estimate information about children across the country, which of the following is the best estimate of the total number of children between 9 and 11 years old in the United States who were overweight in 2014 ?
The correct Answer is:B
Step by step video, text & image solution for 743 children from the United States, aged 6 through 11, were tested to see if they were overweight . The data are shown in the table below. In 2014 the total population of children between 6 and 11 years old, inclusive , in the United States was about 74.3 million. If the test results are used to estimate information about children across the country, which of the following is the best estimate of the total number of children between 9 and 11 years old in the United States who were overweight in 2014 ? by Maths experts to help you in doubts & scoring excellent marks in Class 12 exams.
Updated on:21/07/2023Similar Questions
Liebig test is used ot estimate
View Solution743 children from the United States, aged 6 through 11, were tested to see if they were overweight . The data are shown in the table below.

Based on the data, how many times more likely is it for a 6, 7, or 8 - year - old to NOT be overweight than it is for a 9, 10, or 11 - year - old to NOT be overweight? (Round the answer to the nearest tenth.)
View Solution
Knowledge Check
744 children from the United States, aged 6 through 11, were tested to see if they were overweight . The data are shown in the table below.

∗ According to the table, which of the following statements is most likely to be true about children between 6 and 11 years old, inclusive, in the United States ?AThe probability that a 6-8 year old is overweight is greater than the probability that an overweight child aged 6-11 is less than 9 years old.BThe probability that a 6-11 year old is overweight is greater than the probability that a 9-11 year old is not overweight.CThe probability that an overweight 6-11 year old is at least 9 years old is greater than the probability that a 6-11 year old is not overweight.DThe probability that a 6-8 year old is overweight is greater than the probability that a 9-11 year old is not overweight.Which of the following is correct about mammalia testes ?
AGraafian follicles, Sertoli cells, Leydig's cellsBGraafian follicles, Sertoli cells, Seminiferous tubuleCSertoli cells, Seminiferous tubules, Leydig's cellsDGraafian follicle, Leydig's cells, Seminiferous tubuleUsing the tests of divisibility, find which of the following numbers are,
divisible by 11A59587B1678036C1001001001D501358
State, which of the following variables are continuous and which are discrete :
number of children in your class.
View SolutionAmmonium molybdate test is used for the estimation of:
View Solution
The figure above shows the average annual gas prices in the United States from 2003 to 2013. Based on the information shown, which of the following conclusions is valid?
View Solution
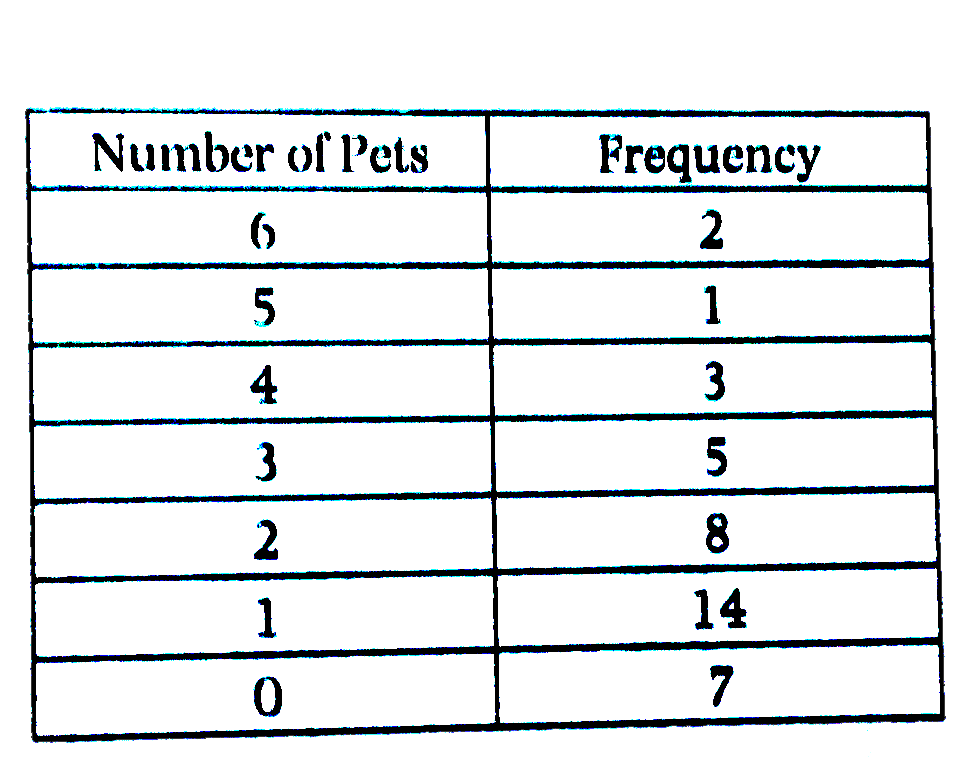
The number of pets owned by children in a sixth grade class are shown in the table above . What is the median of the data ?
View SolutionThe following table gives the number of households in USA during 2000-2014.
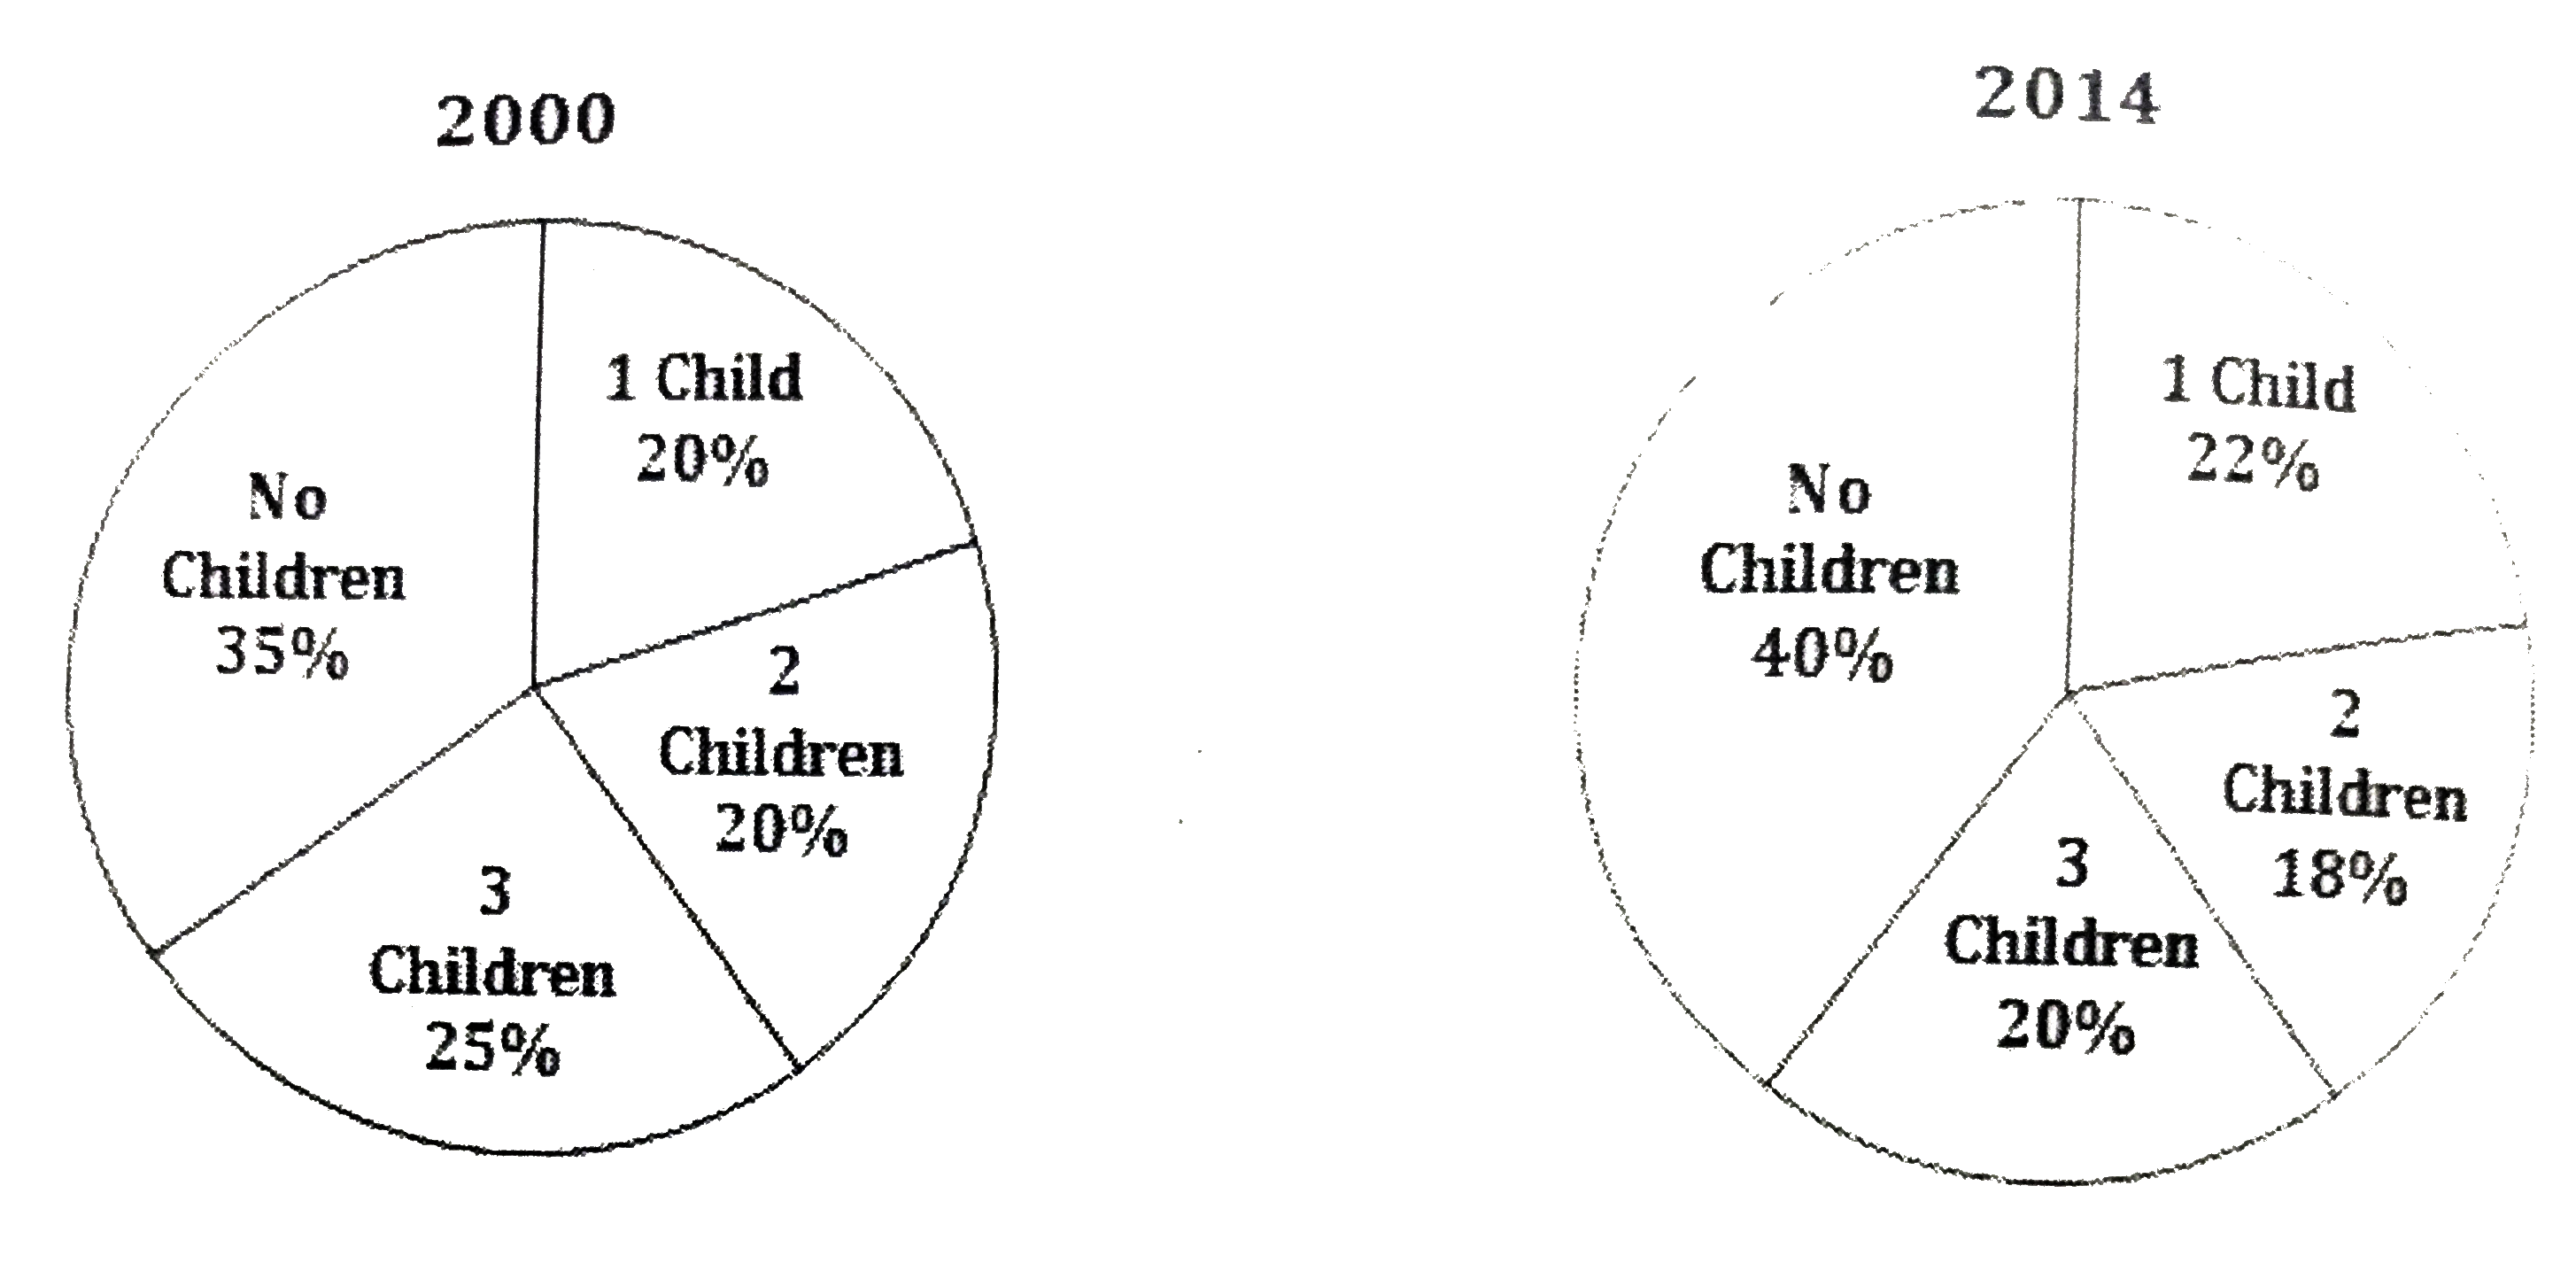
The following charts give the distribution of households based on the numbers of children for the years 2000 and 2014.

The following charts give the distribution based on the number of childre for the year 2000 and 2014.

What is the total number of children in 2014?
View Solution
