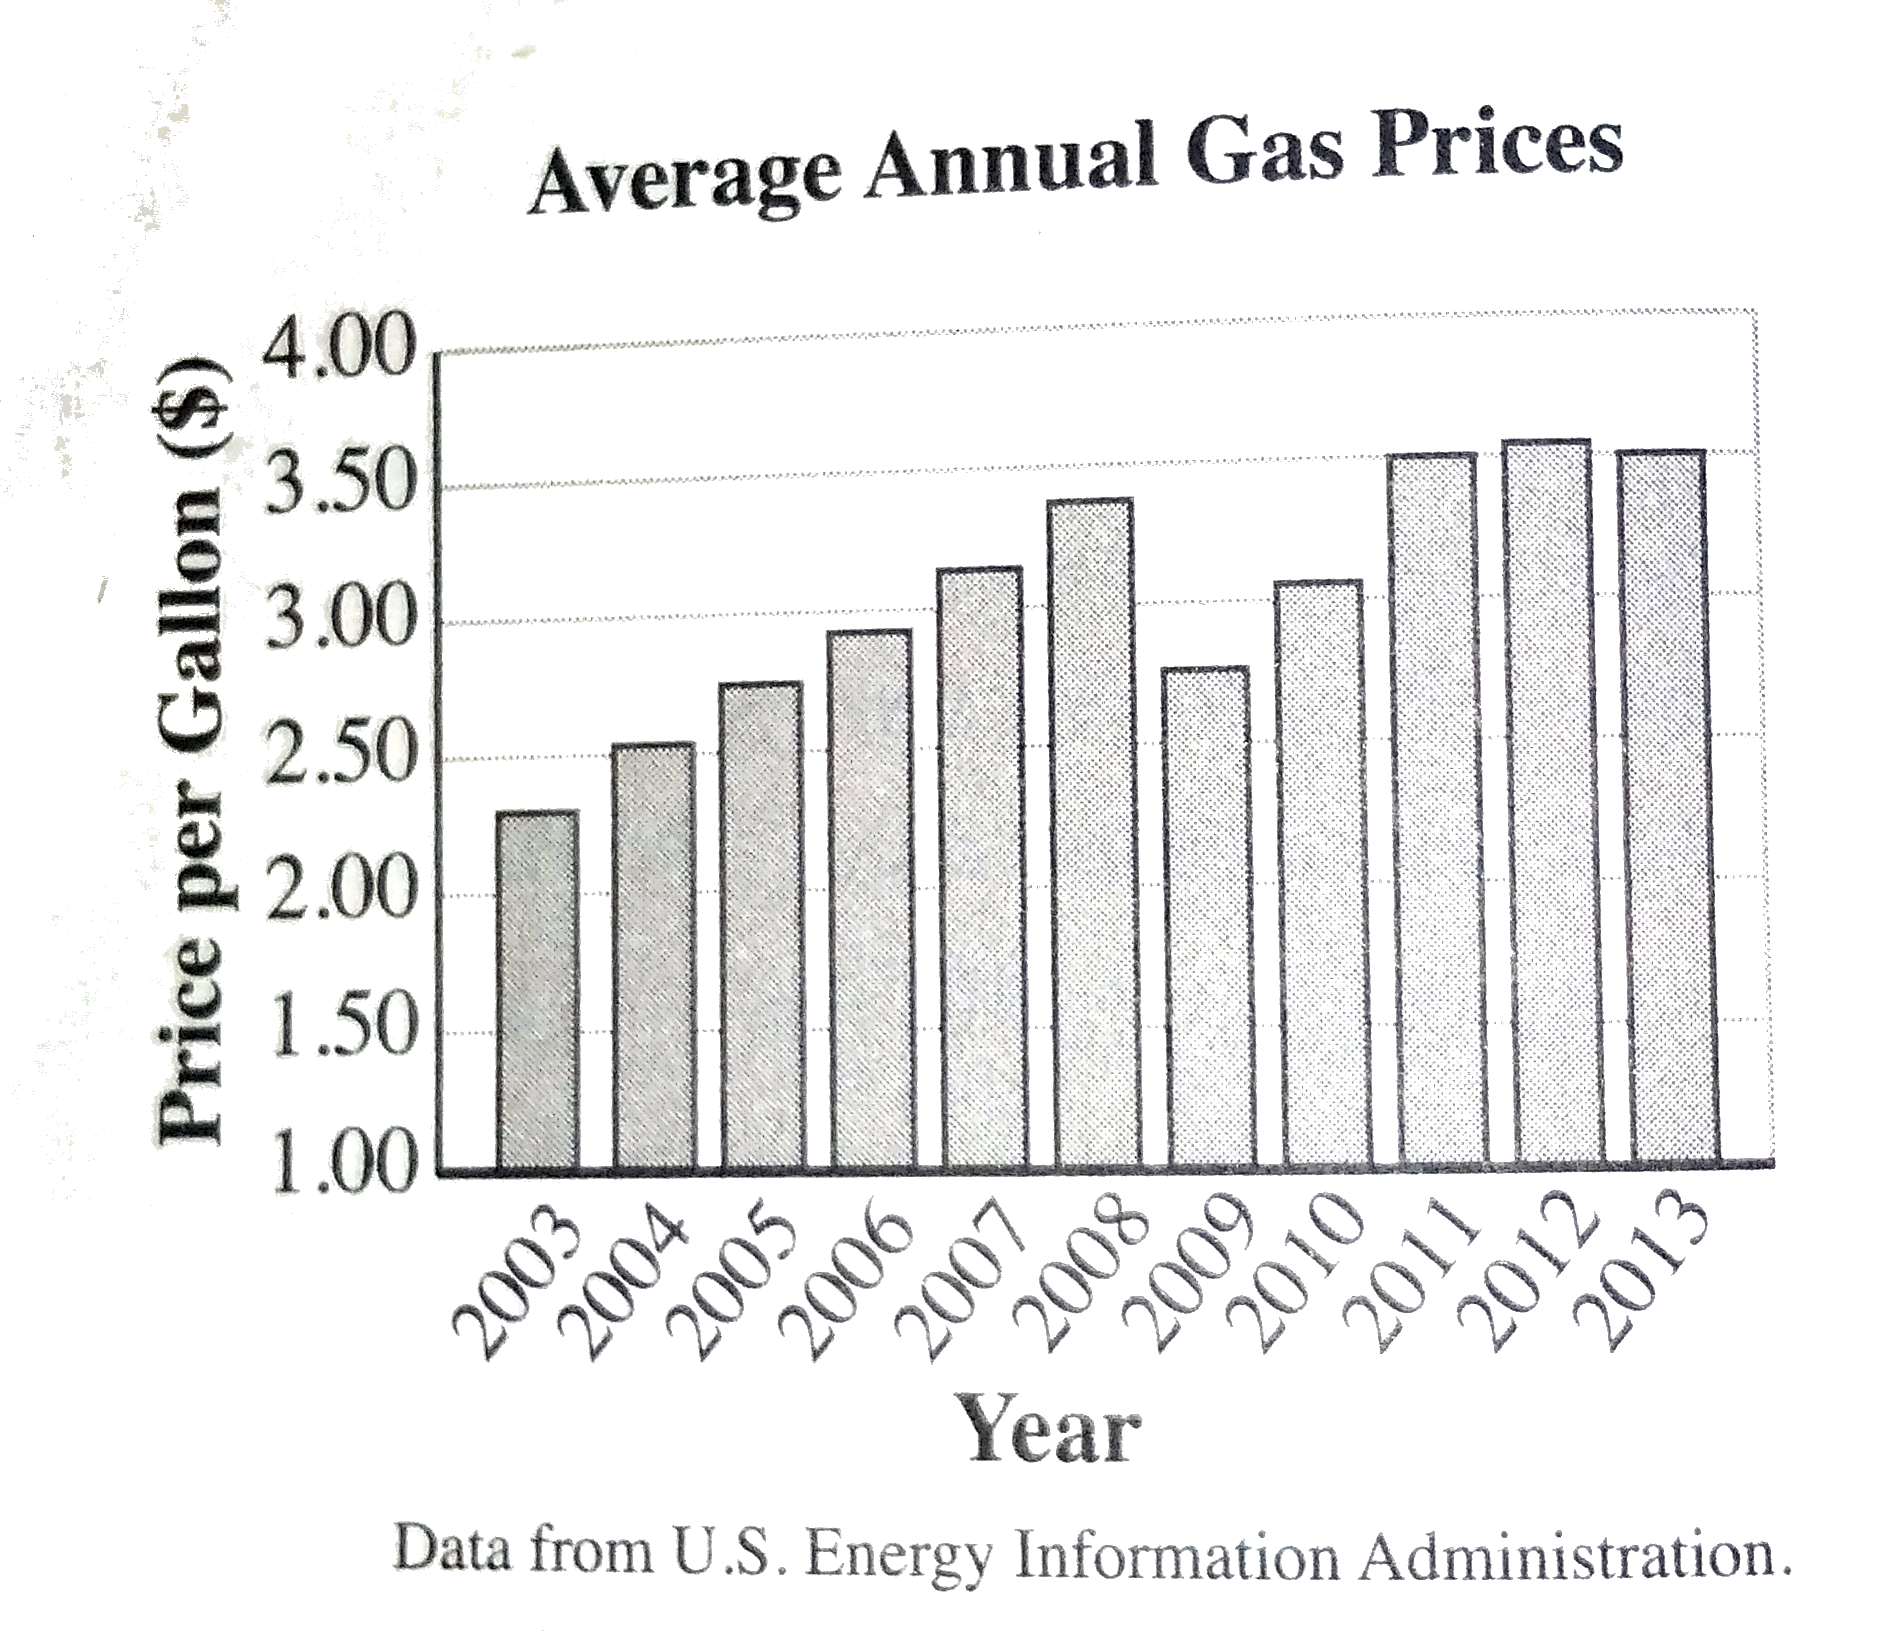
The figure above shows the average annual gas prices in the United States from 2003 to 2013. Based on the information shown, which of the following conclusions is valid?
A gallon of gas cost more in 2008 than in 2013
The price more than doubled between 2003 and 2013
The drop in price from 2008 to 2009 was more than $1.00 per gallon.
The overall change in price was together between 2003 and 2008 than it was between 2008 and 2013.
The correct Answer is:D
Step by step video & image solution for The figure above shows the average annual gas prices in the United States from 2003 to 2013. Based on the information shown, which of the following conclusions is valid? by Maths experts to help you in doubts & scoring excellent marks in Class 10 exams.
Updated on:21/07/2023Topper's Solved these Questions
Similar Questions
Knowledge Check
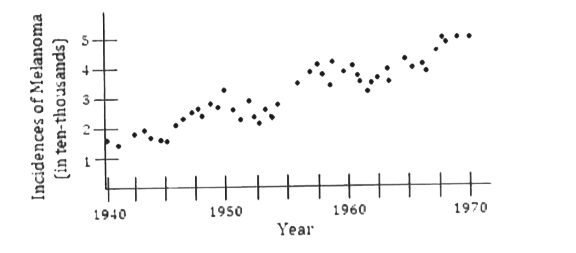
The scatterplot above shows the numbers of people diagnosed with melanoma, in ten - thousands, from 1940 to 1970. Based on the data shown in the figure, which of the following values is closest to the range of the number of incidences of melanoma between 1945 and 1950?A5000B10000C17000D36000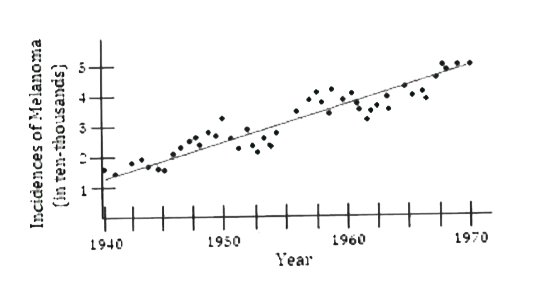
The scatterplot above shows the number of people diagnosed with melanoma, in ten-thousands, from 1940 to 1970. Based on the line of best fit to the data, as shown in the figure, which of the following values is closest to the average yearly increase in the number of incidences of melanoma?A1300B330C0.33D0.13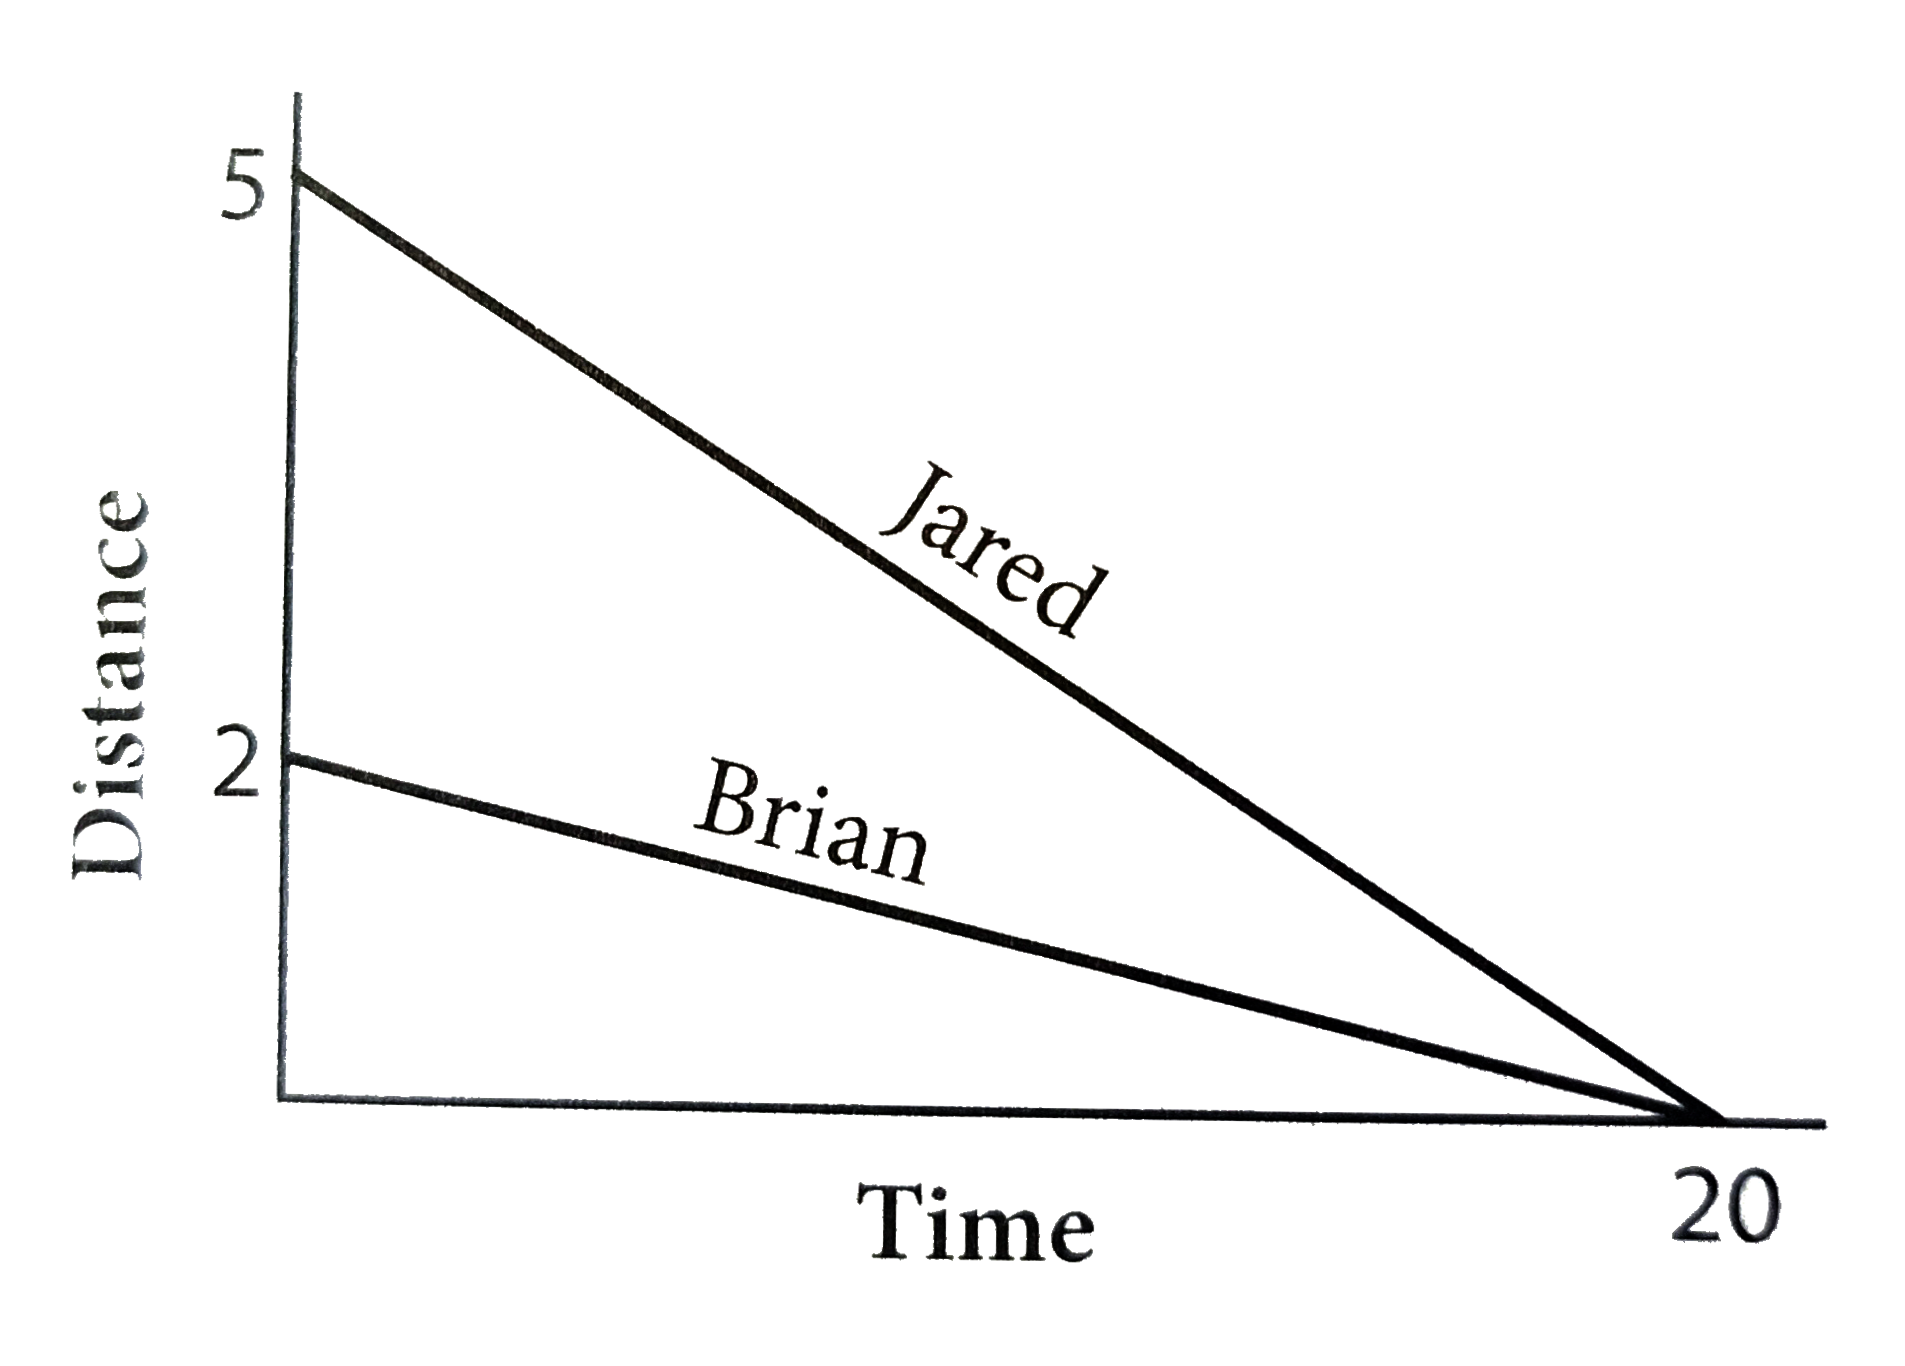
Brain and Jared live in the same apartment comlex and both bike to and from work every day. The figure above shows a typical commute home for each of them. Based on the figure, which of the following statemetns is true ?AIt takes Brain longer to bike home because his work is farther away.BIt takes Jared longer to bike home because his work is farther away.CJared and Brain arrive home at the same time, so they must bike at about the same rate.DJared bikes a longer distance than Brain in the same amount of time, so Jared must bike at a faster rate.
Figure, shows the variation of potential energy (U) of 2 mol of Argon gas with its density in a cyclic process ABCA. The gas was initiallly in the state A whose pressure and temperature are PA=2atm,TA=300K, respectively. It is also stated the path AB is a rectangular hyperbola and the internal energy of the gas at state C is 3000r. Based on the above information answer the following question :
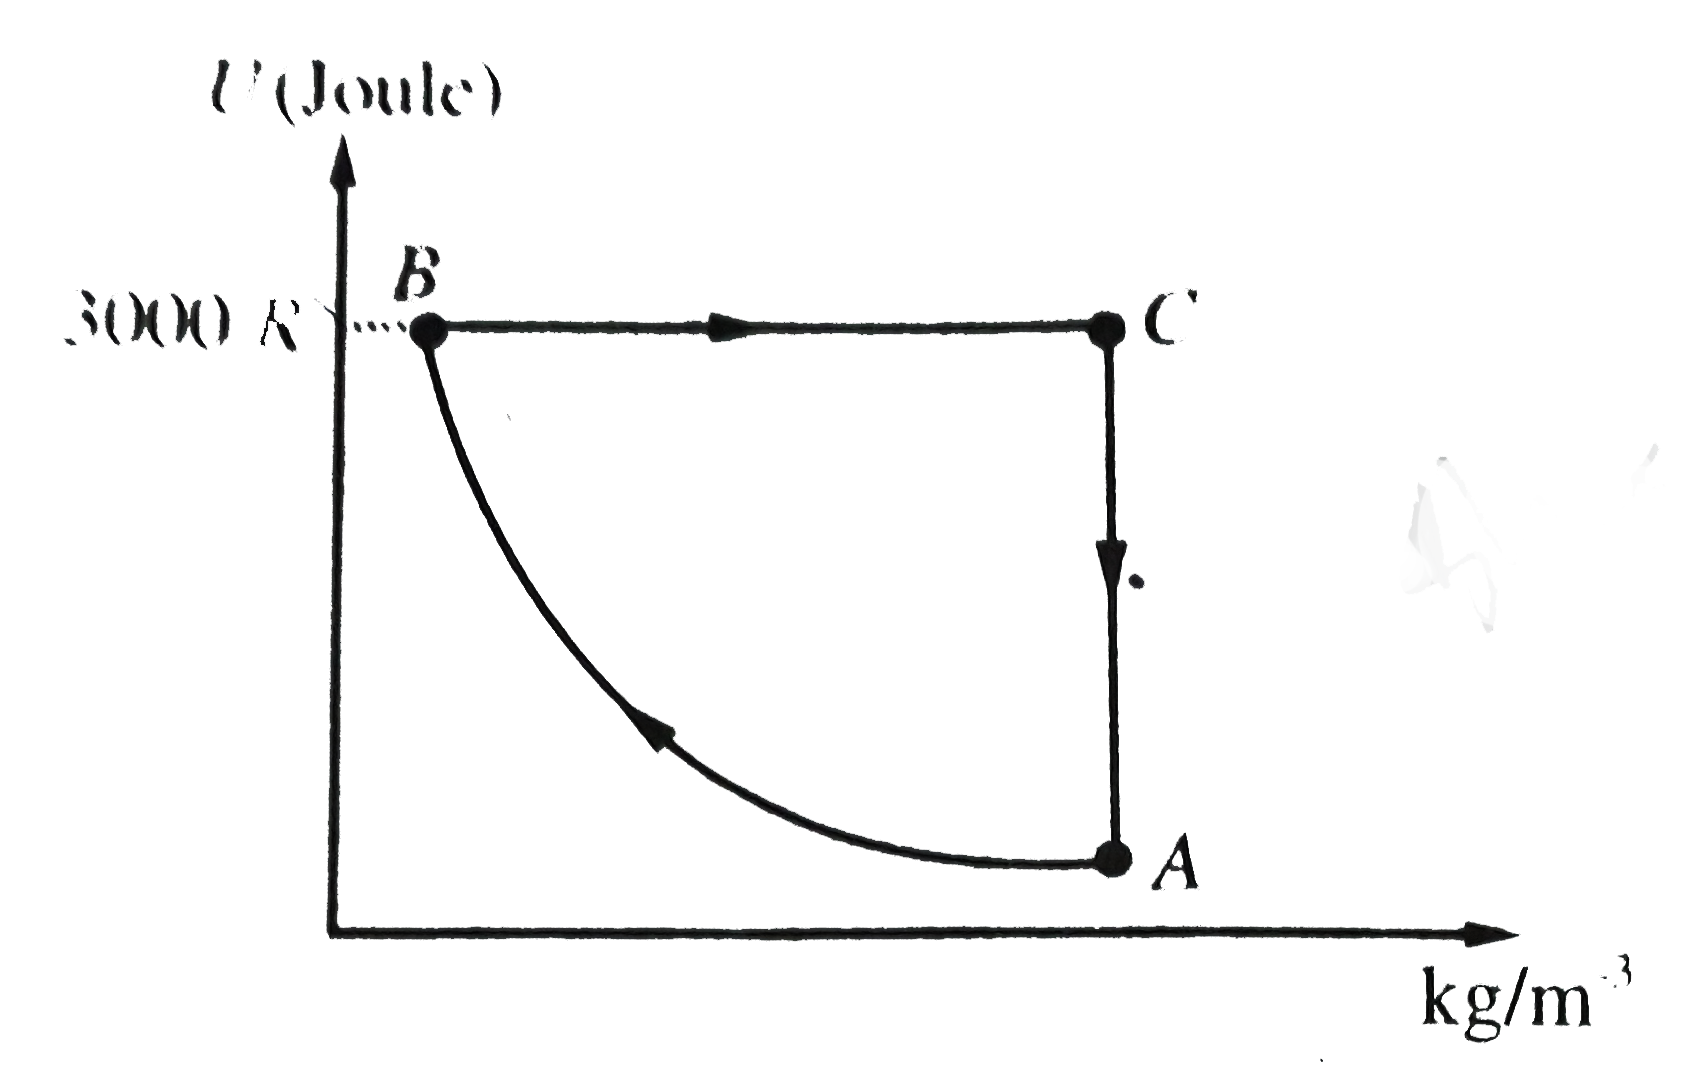
Heat supplied in the process CA is
View SolutionThe figure shows position time graph of two riders C and D. Based on the information represented by the graph, answer the following questions.
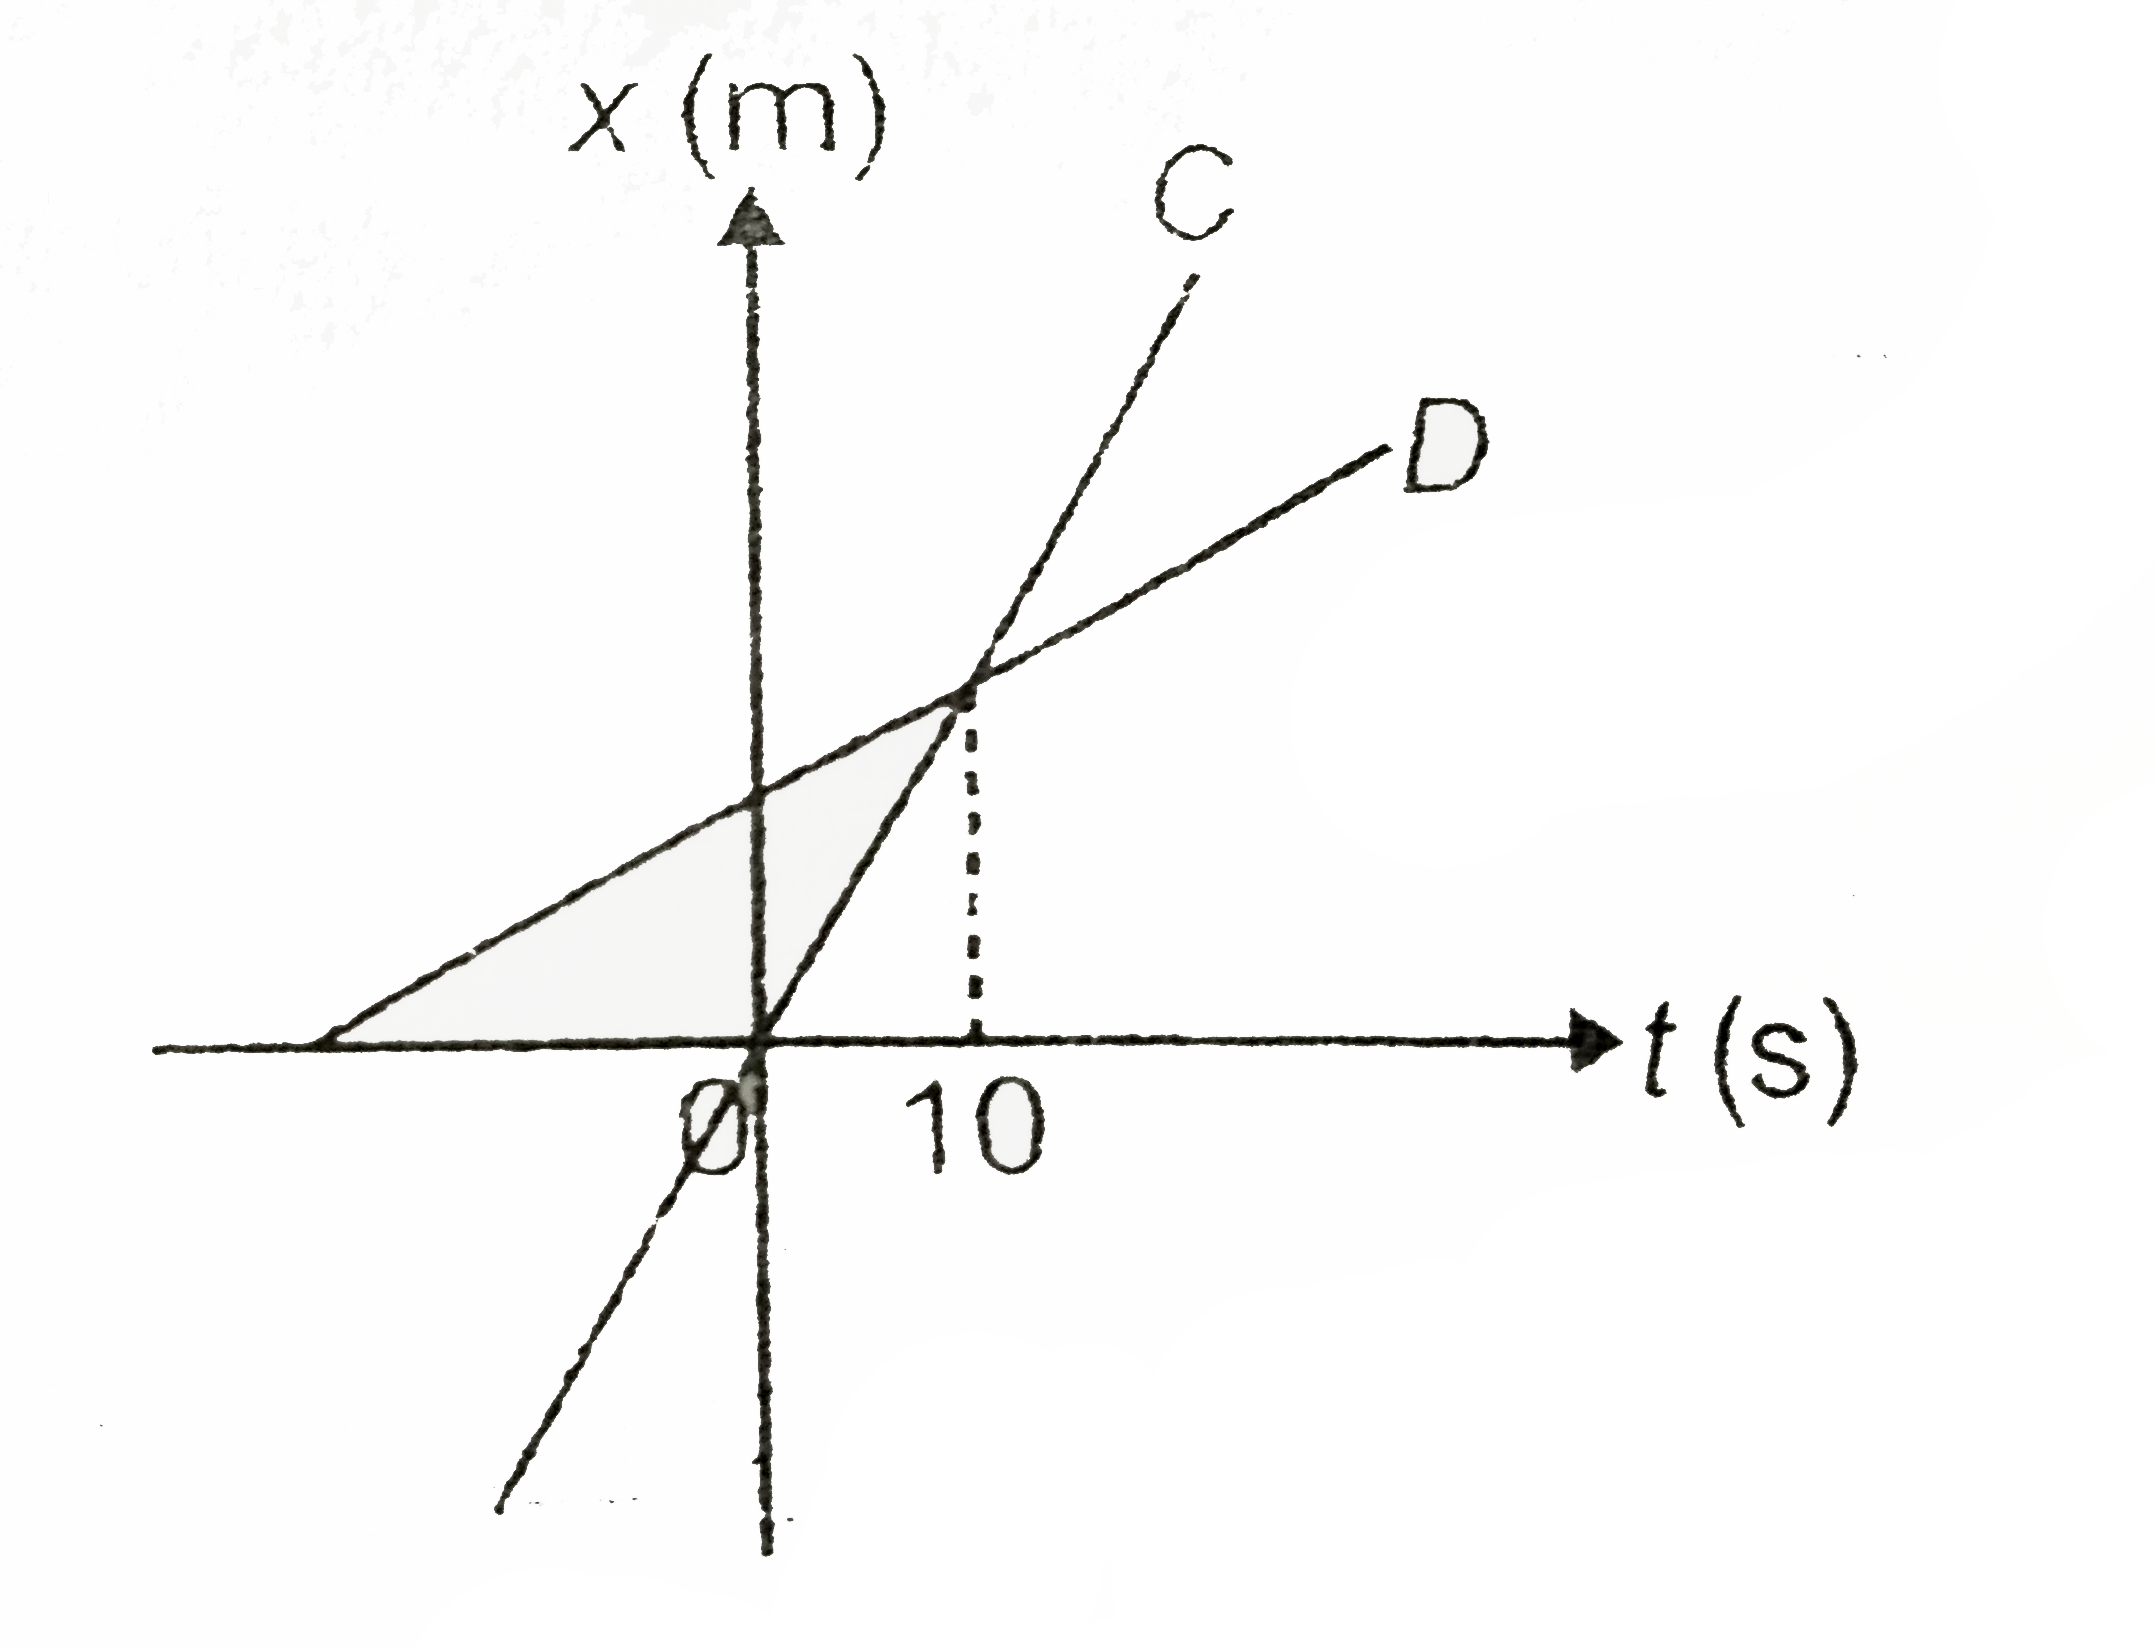
At t = 0 s
View SolutionThe figure shows position time graph of two riders C and D. Based on the information represented by the graph, answer the following questions.
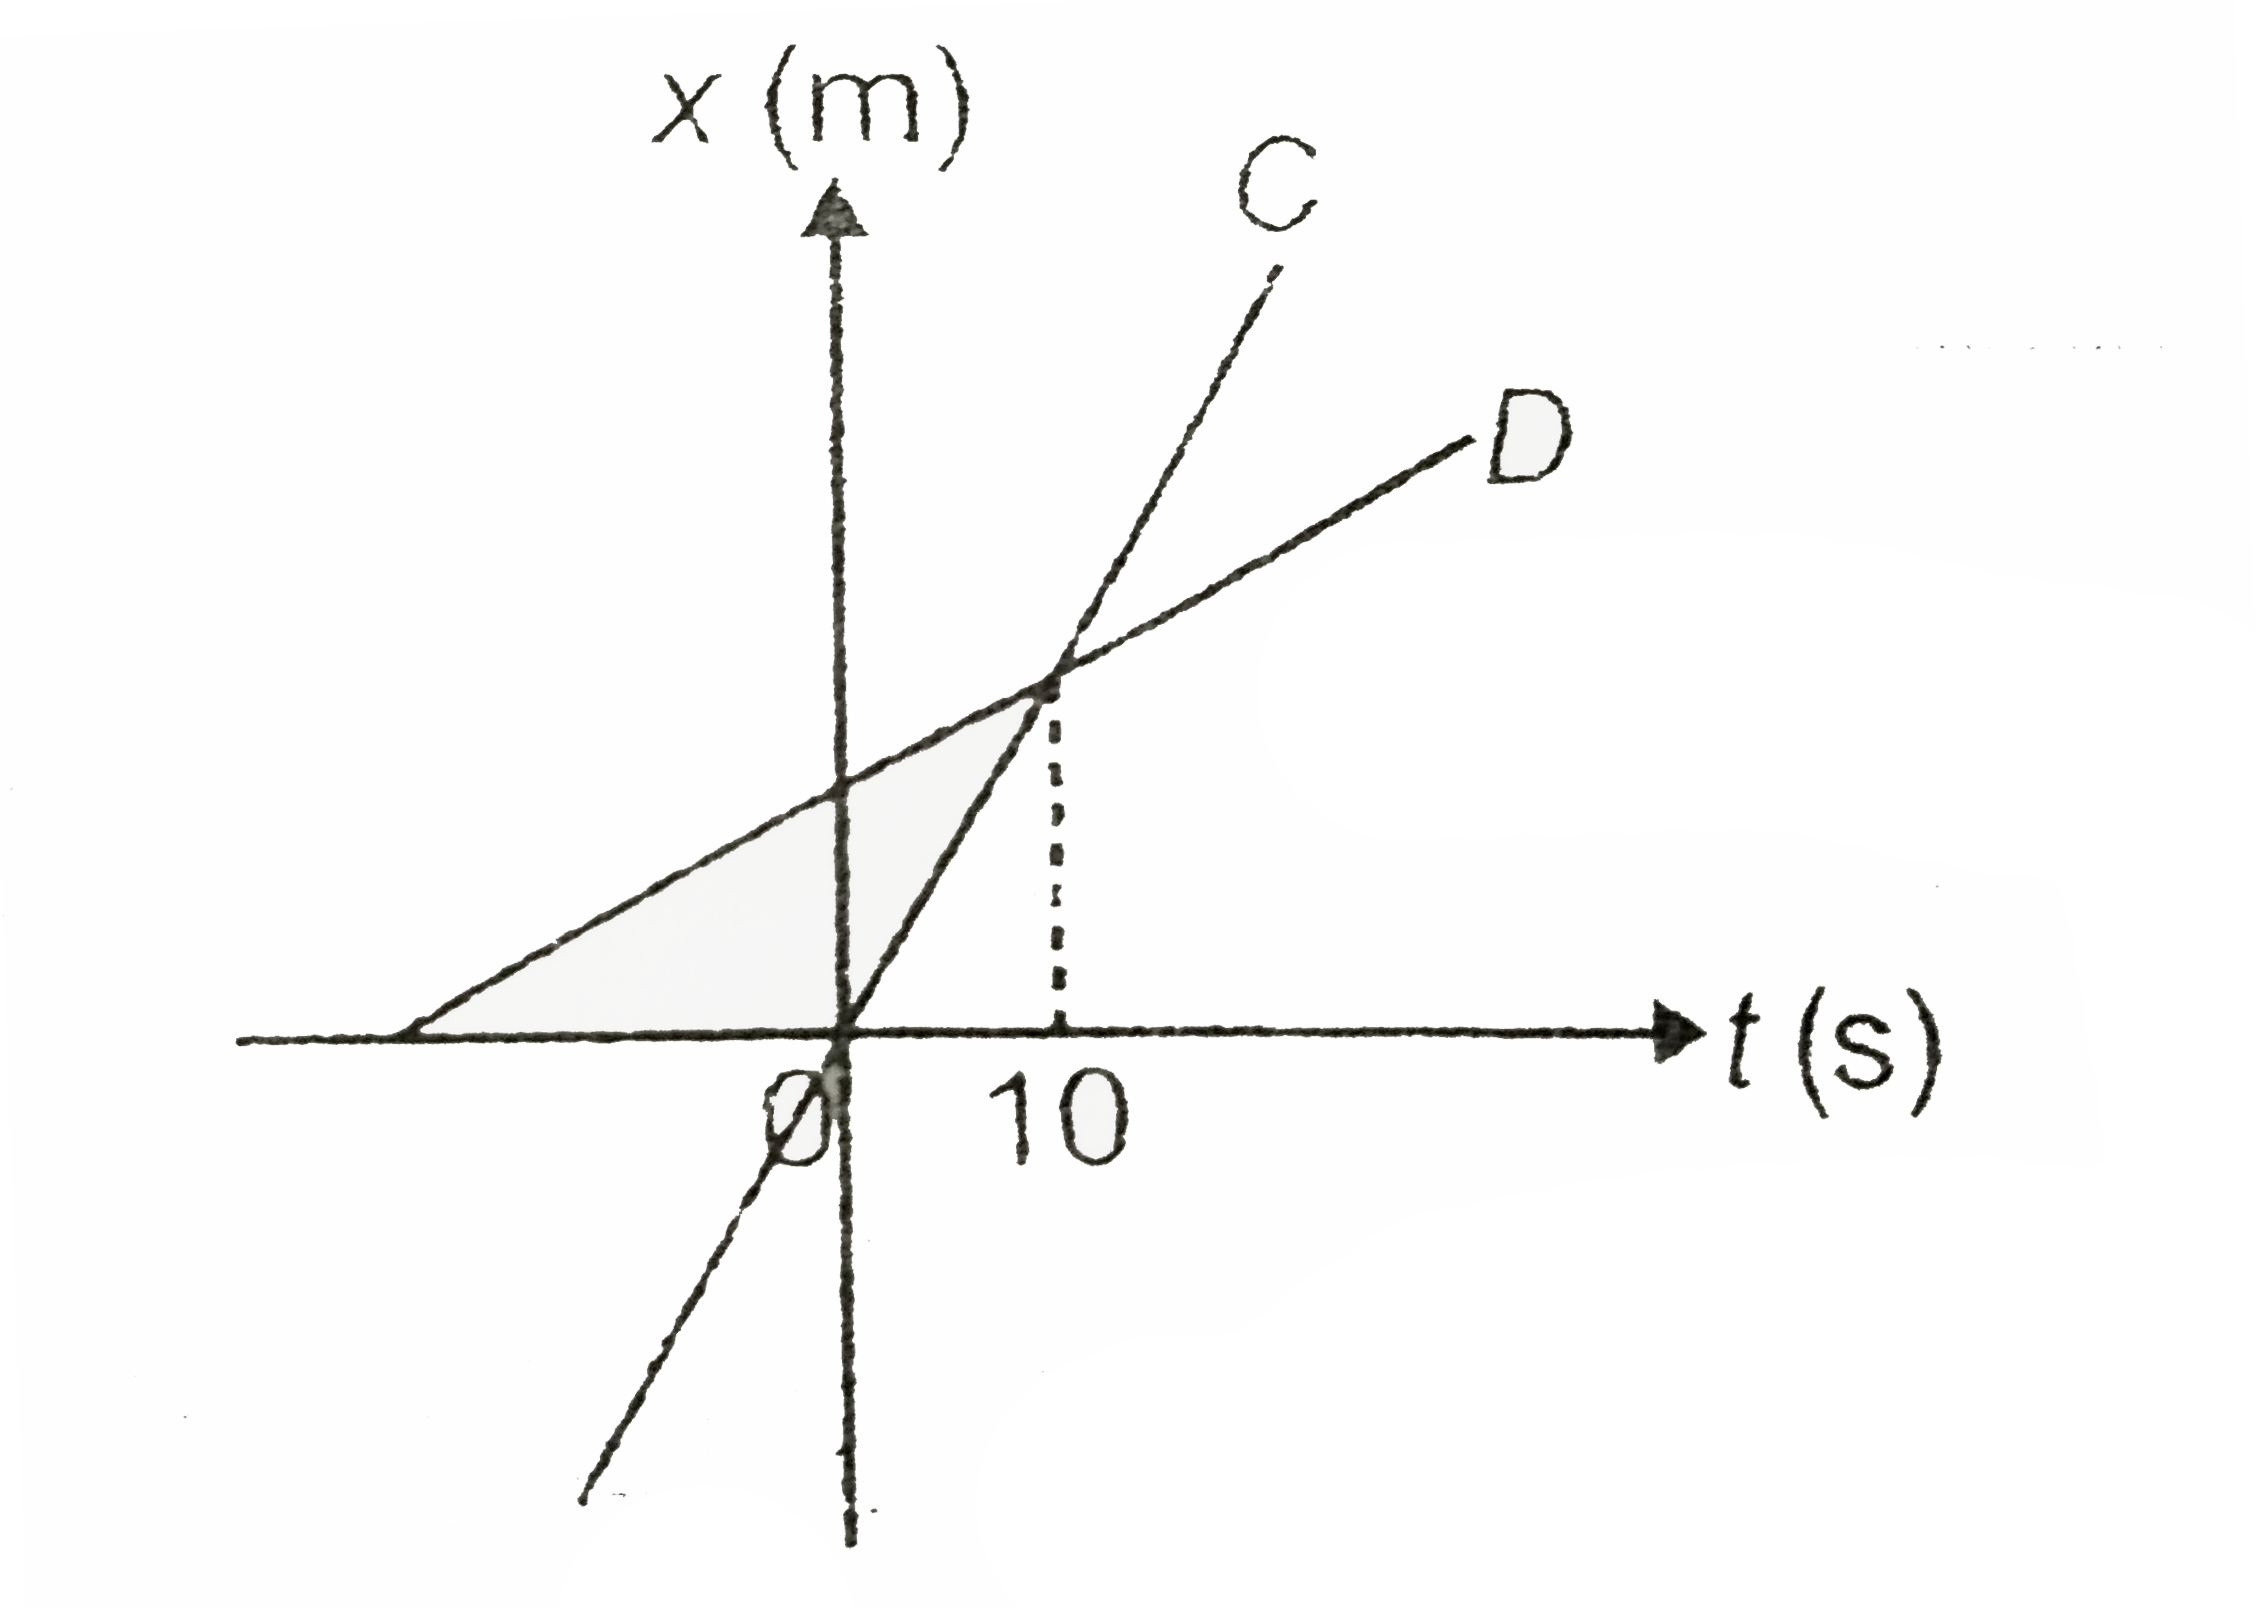
At t = 0 s
View SolutionThe figure shows position time graph of two riders C and D. Based on the information represented by the graph, answer the following questions.
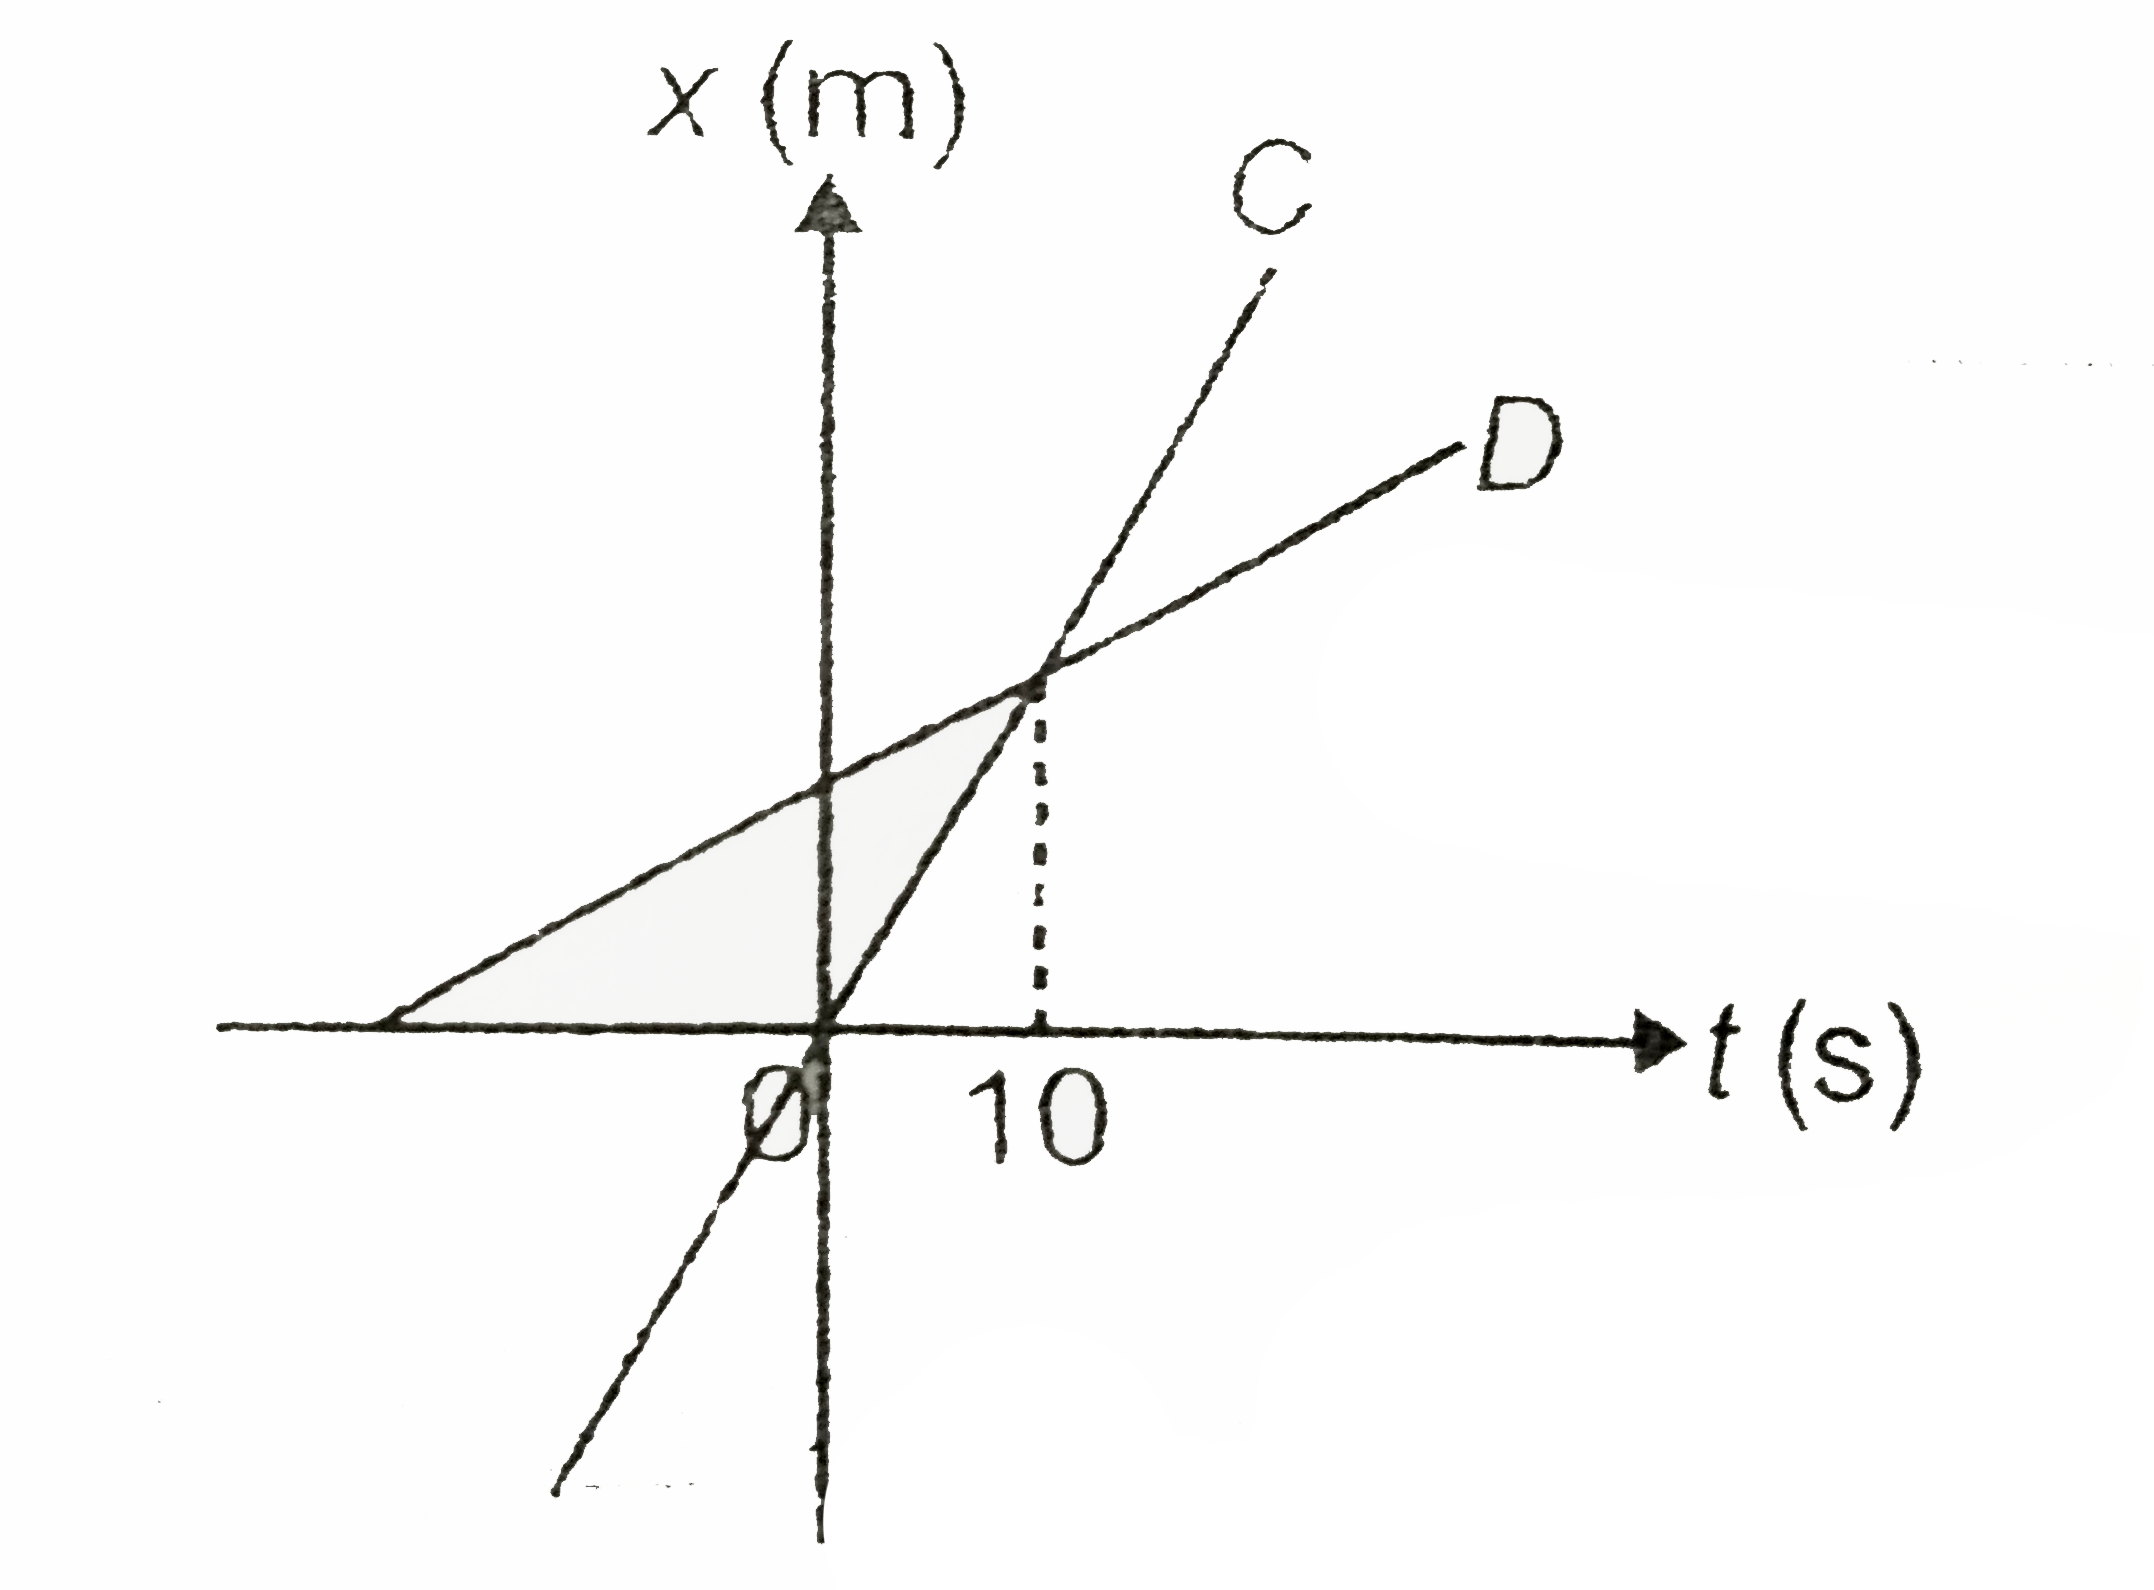
At t = 0 s
View SolutionThe scatterplot below compares the average gasoline prices I Boston, per gallon, to the average gasoline prices across the United States, per gallon, during a one-year period from 2017 to 2018.
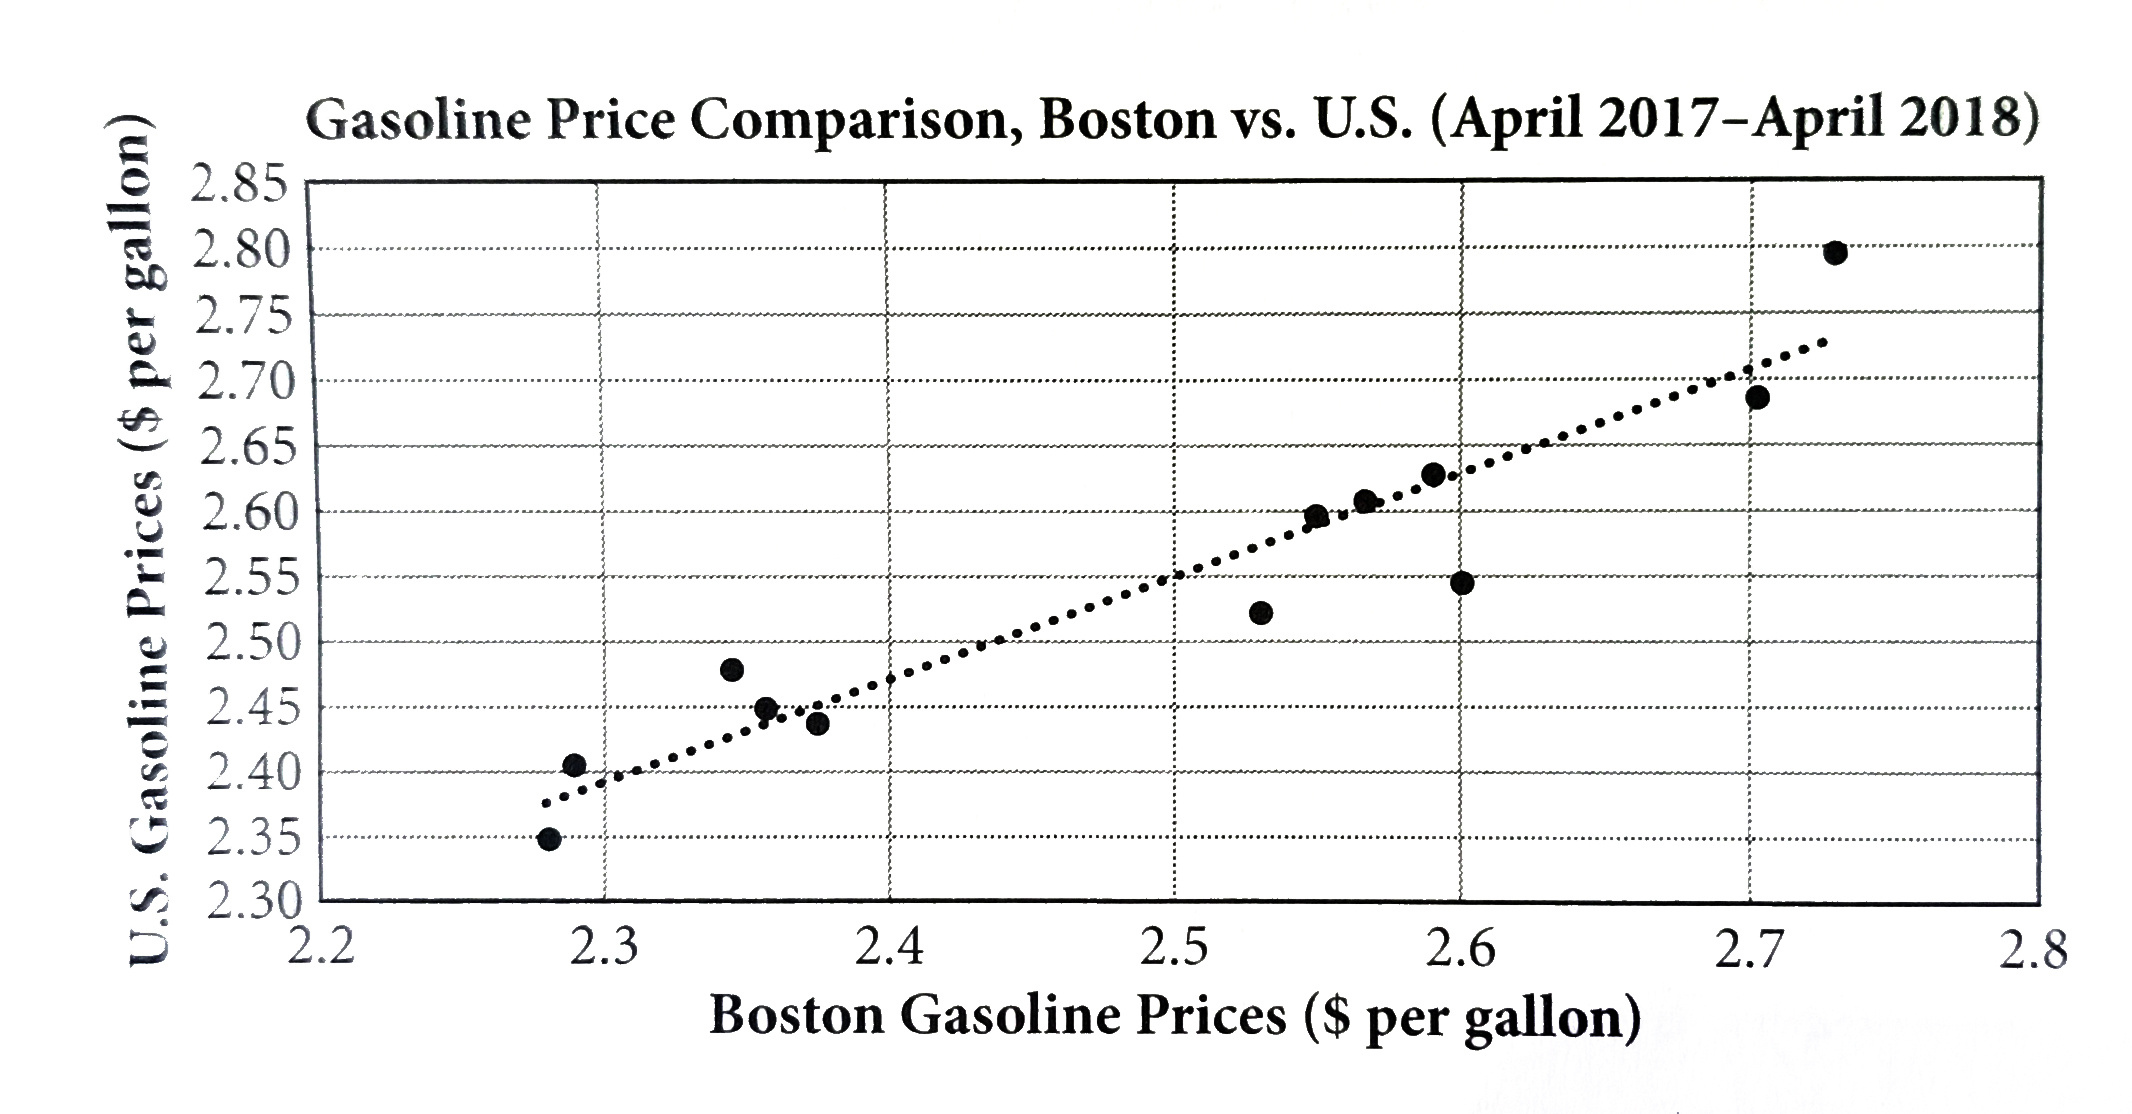
Of the following equations, whihc best modeles the data in the scatterplot ?
View Solution

