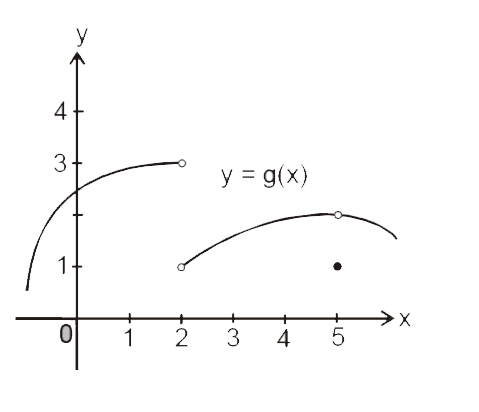
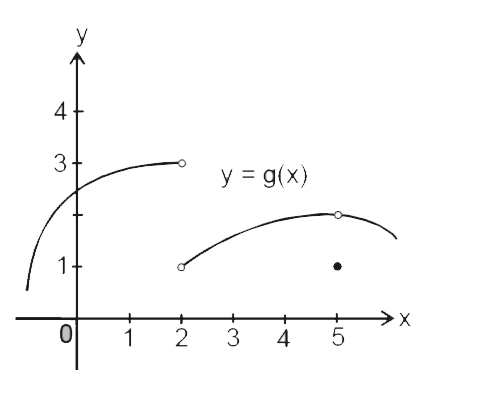
The graph of a function g is shown in the figure. Use it to state the values ( if they exist ) of the following
Limx→2g(x)
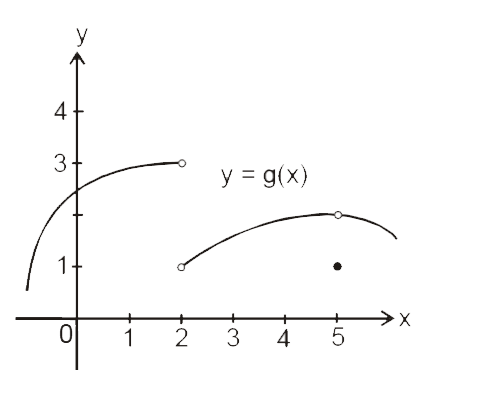
Step by step video & image solution for The graph of a function g is shown in the figure. Use it to state the values ( if they exist ) of the following underset( x rarr 2)("Lim")g(x) by Maths experts to help you in doubts & scoring excellent marks in Class 12 exams.
Updated on:21/07/2023Topper's Solved these Questions
- LIMITBOOK - MOTIONCHAPTER - LIMITEXERCISE - EXERCISE -1
48 Videos
- LIMITBOOK - MOTIONCHAPTER - LIMITEXERCISE - EXERCISE -2( LEVEL-I)
16 Videos
- INVERSE TRIGONOMETRIC FUNCTIONSBOOK - MOTIONCHAPTER - INVERSE TRIGONOMETRIC FUNCTIONSEXERCISE - Exercise -4 Level -II
7 Videos
- MATRICES BOOK - MOTIONCHAPTER - MATRICES EXERCISE - Exercise - 4 (Level-II)
28 Videos
Similar Questions
Knowledge Check
limx→11−x1−x2=
A−1B−12C12Dविधमान नहीं है |The graph of the function y = g(x) is shown. The number of solutions of the equationm ||g(x)|−1|=12, is
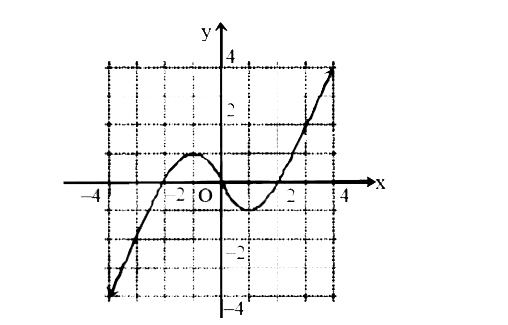 A4B5C6D8
The graph of the function f(x)=Limt→0(2xπcot−1xt2), is
A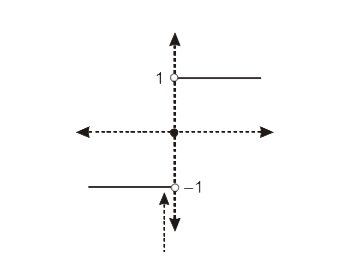 B
B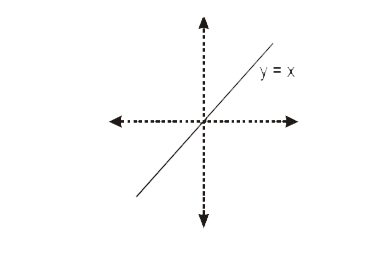 C
C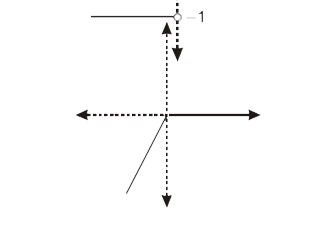 D
D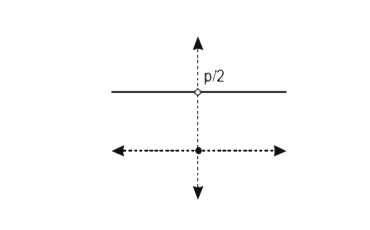
For the function g whose graph is given, state the value of each quantity, if it exists.
View SolutionThe graph of function f(x) is shown below :
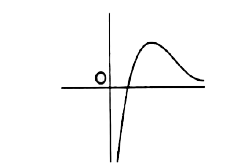
Then the graph of g(x)=1f(|x|) is:
View SolutionThe graph of function f(x) is shown below :

Then the graph of g(x)=1f(|x|) is:
View SolutionThe graph of the function y=g(x) is shown.The number of solutions of the equation ||g(x)|−1|=12, is
View SolutionThe graph of a function y=g(x) is shown in the following figure. If f(x)=−3x2−kx−12,k∈Randf(g(x))>0∀x∈R then least integral value of k is equal to a. 13 b.64 c. 15 d.16
View Solution

