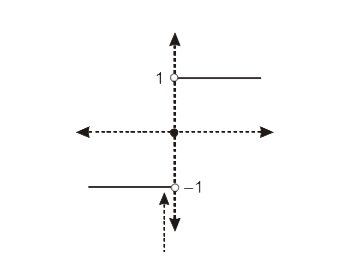
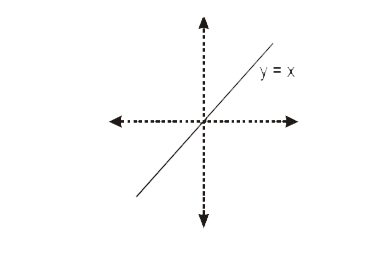
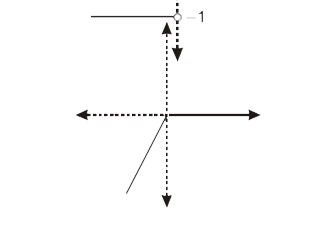
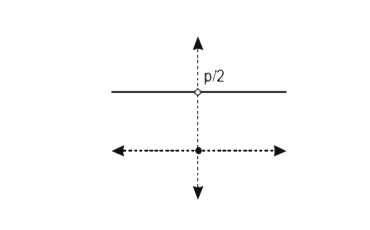
Plot the graph of the function f(x)=limt→0(2xπtan−1xt2)
The correct Answer is:f(x) =|x|
Step by step video, text & image solution for Plot the graph of the function f(x)=lim_(t->0)((2x)/pitan^(- 1)x/(t^2)) by Maths experts to help you in doubts & scoring excellent marks in Class 12 exams.
Topper's Solved these Questions
- BOOK - MOTIONCHAPTER - LIMITEXERCISE - EXERCISE-417videos
LIMIT
- BOOK - MOTIONCHAPTER - LIMITEXERCISE - EXERCISE-2(LEVEL-2)5videos
LIMIT
- BOOK - MOTIONCHAPTER - INVERSE TRIGONOMETRIC FUNCTIONSEXERCISE - Exercise -4 Level -II7videos
INVERSE TRIGONOMETRIC FUNCTIONS
- BOOK - MOTIONCHAPTER - MATRICES EXERCISE - Exercise - 4 (Level-II)28videos
MATRICES
Similar Questions
Knowledge Check
- Question 1 - Select One
The graph of the function f(x)=Limt→0(2xπcot−1xt2), is
A B
B C
C D
D
- Question 2 - Select One
The interval in which the function
f(x)=∫x0(tt+2−1t)dtwill be non- increasing isA(−2,−1]∪(0,3]B(−2,−1]∪[0,3]C(-2,-1]cup [0,2]D(−2,−1]∪(0,2] - Question 3 - Select One
If the function f(x) satisfies limx→1f(x)−2x2−1=π, then limx→1f(x) is equal to
A1B2C0D3
For the function f(x)=2. Find limx→1f(x)
View SolutionFind the derivative with respect to x of the following functions :
(a) F(x)=∫2x0sintt dt ,
(b) f(x)=∫0x√1+t4dtView SolutionIf the graph of the function y=f(x) has a unique tangent at point (ea,0) (not vertical, non-horizontal) on the graph, then evaluate limx→ea(1+9f(x))−tan(f(x))2f(x).
View SolutionA wave pulse on a horizontal string is represented by the function
y(x,t)=5.01.0+(x−2t)2 (CGS units)
plot this function at t=0,2.5 and 5.0s.View Solutionif f be a differentiable function such that f(x)=x2∫x0e−tf(x−t). dt. Then f(x) =
View Solution
