एक विद्यालय में एक वर्ष 10% छात्र बढ़ जाते है दूसरे वर्ष 10% छात्र घट जाते है और यह क्रम चलता रहता है, यदि वर्ष 2000 में छात्रों की संख्या में वृद्धि हुई हो तो, 2003 में छात्रों के संख्या 2000 की तुलना में वृद्धि या कमी का प्रतिशत क्या रहा ?
increased by 8.9%
decreased by 8.9%
increased by 9.8%
decreased by 9.8%
The correct Answer is:a
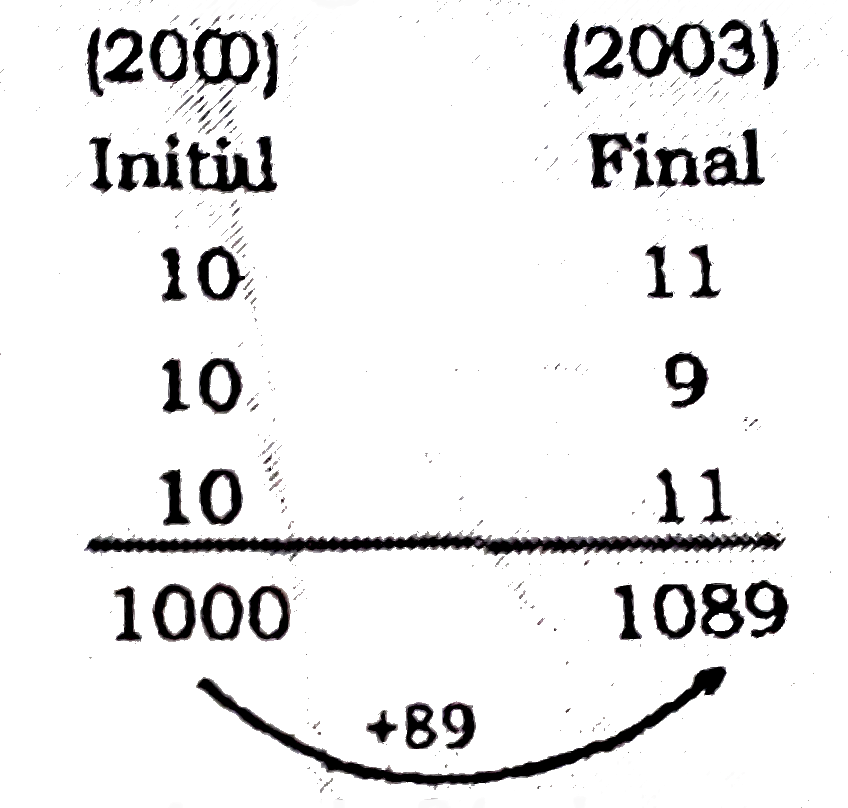
(a) 10%=110

Reqired % increment
=891000×100=8.9%
Hence, strength after 3 years will increase by 8.9%
(3 वर्ष के पश्चात क्षमता 8।9% बढ़ जाएगी।)
Topper's Solved these Questions
Similar Questions
रुपये 50,000 की पूंजी निवेश करके एक व्यापार शुरू करता है 3 माह के बाद B रुपये 70,000 निवेश कर उस व्यापार में शामिल हो जाता है ज्ञात करे वर्ष के अंत में उन्हें किस अनुपात में लाभ प्राप्त होगा
06:14View Solutionदो पाइप A और B एक टैंक को क्रमश: 20 मिनट और 30 मिनट में भर सकते है । यदि दोनों पाइप एक साथ खोल दिए जाये तो टैंक को भरने में कितना समय लगेगा ?
03:53View Solutionयह ज्ञात है की महाविद्यालय के छात्रों में से 60 % छात्रावास में रहते है और 40 % छात्रावास में नहीं रहते है । पूर्ववर्ती वर्ष से परिणाम सूचित करते है की छात्रावास में रहने वाले छात्रों में से30 % छात्रों में से 20 % छात्रों ने A ग्रेड लिए। वर्ष के अंत में महाविद्यालय के एक छात्र को यादृच्छया चुना गया और पाया गया की उसे A ग्रेड मिला है । इस बात की क्या प्रायिकता है की वह छात्रावास में रहने वाला है ?
02:08View SolutionIn a school, 512 of the number of students are girls and the rest are boys, 47 of the number of boys are below 14 years of age, and 25 of the number of girls are 14 years or above 14 years of age. If the number of students below 14 years of age is 1120, then the total number in the school is:
एक स्कूल में, छात्रों की संख्या में से 512 लड़कियाँ हैं और बाकी लड़के हैं, जिनमें से 47 लड़कों की संख्या 14 वर्ष से कम है, और 25 की संख्या में लड़कियाँ 14 वर्ष या 14 वर्ष से अधिक हैं। यदि 14 वर्ष से कम आयु के छात्रों की संख्या 1120 है, तो स्कूल में कुल संख्या है:02:29View SolutionThe population of a town has increased by 5% at the end of the first year and decreased by 4% at the end of second year. If the population at the end of second year was 55,12,248, then the population at the beginning of first year was:
एक शहर की आबादी पहले वर्ष के अंत में 5% बढ़ी है और दूसरे वर्ष के अंत में 4% कम हुई। यदि दूसरे वर्ष के अंत में जनसंख्या 55,12,248 थी, तो पहले वर्ष की शुरुआत में जनसंख्या थी:02:15View SolutionA man spends 75% of his income. If his income increases by 28% and his expenditure increases by 20%, then what is the increase or decrease percentage in his saving ?
एक आदमी अपनी आय का 75% खर्च करता है। यदि उसकी आय में 28% की वृद्धि होती है और उसके व्यय में 20% की वृद्धि होती है, तो उसकी बचत में वृद्धि या कमी का प्रतिशत कया है?02:03View SolutionA number is first increased by 40% and then decreased by 25%, again increased by 15% and then decreased by 20%, What is the net increase decrease per cent in the number ?
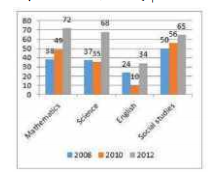
एक संख्या में पहले 40% की वृद्धि हुई है और फिर 25% की कमी हुई, फिर से 15% की वृद्धि हुई और फिर 20% की कमी हुई, संख्या में कुल वृद्धि या कमी के प्रतिशत को ज्ञात करे।02:31View SolutionThe given bar graph shows the number of marks scored by a student in each subject in three years.
दिया गया दंड आरेख एक छात्र के द्वारा तीन वर्षो में प्रत्येक विषय में लाये गए अंकों को दर्शाता है | In the given chart, the number of marks in social studies in 2012 is 13% of the school strength. The number of students is:
दिए गए चार्ट में, यदि वर्ष 2012 में सामाजिक अध्ययन में अंकों की संख्या स्कूल की के छात्रों की संख्या का 13% है। छात्रों की संख्या कितनी है?02:57View SolutionThe given Bar Graph presents the number of students of two schools for six years. दिया गया दंड आरेख छः वर्ष की अवधि में दो विद्यालयों में छात्रों की संख्या को दर्शाता है | In which year, the percentage increase in students in school B is the highest in comparison to its previous year? किस वर्ष में, विद्यालय B में छात्रों की संख्या में प्रतिशत वृद्धि इसके पिछले वर्ष की तुलना में सबसे अधिक रही है?
04:17View SolutionThe given Bar Graph presents the number of students of two schools for six years. दिया गया दंड आरेख छः वर्ष की अवधि में दो विद्यालयों में छात्रों की संख्या को दर्शाता है | In which year, the percentage increase of students in school A is the highest in comparison to its previous year? किस वर्ष, विद्यालय A में छात्रों की संख्या में प्रतिशत वृद्धि पिछले वर्ष की तुलना में सर्वाधिक है ?
03:43View SolutionThe given Bar Graph presents the number of students of two schools for six years. दिया गया दंड आरेख छः वर्ष की अवधि में दो विद्यालयों में छात्रों की संख्या को दर्शाता है | In which year the percentage increase in the number of total students in schools A and B taken together is the highest in comparison to its previous year? किस वर्ष विद्यालय A और B को मिलाकर कुल छात्रों की संख्या में प्रतिशत वृद्धि पिछले वर्ष की तुलना में सर्वाधिक है ?
01:48View SolutionThe given Bar Graph presents the results in terms of the number of students in a school for the five academic years, 2013-2014 to 2017-2018. In which year the percentage increase in total number of students is the lowest in comparison to its previous academic year? दिया गया दंड आरेख पांच शैक्षणिक वर्षों : 2013-2014 से 2017-2018 तक एक विद्यालय में छात्रों की संख्या के संदर्भ में परिणामों को प्रस्तुत करता है | किस वर्ष छात्रों की कुल संख्या में प्रतिशत वृद्धि पिछले शैक्षणिक वर्ष की तुलना में सबसे कम है ?
01:46View SolutionIn the given bar graph, the percentage decrease in the number of students in Institute A in 2016 is what percent of students in 2015. इस दंड आरेख में संस्थान A में 2016 में छात्रों की संख्या में प्रतिशत कमी 2015 के छात्रों की संख्या का क्या प्रतिशत है ?
03:22View SolutionIn a particular year, the number of students enrolled in different streams in a college is as follows:
एक विशेष वर्ष में, किसी कॉलेज के विभिन्न विषयों में नामांकित छात्रों की संख्या इस प्रकार है : The percentage of girl students is:
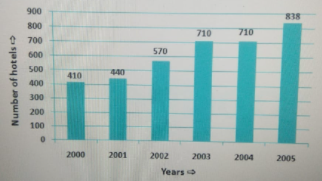
छात्राओं का प्रतिशत है :03:16View SolutionStudy the chart and answer the questions:
In which of the given years is the percentage increase in the number of hotels in comparison to the previous year, is the maximum?
चार्ट का अध्ययन करें और प्रश्नों का उत्तर दें:पिछले वर्ष की तुलना में होटलों की संख्या में किस वर्ष में अधिकतम प्रतिशत वृद्धि हुई है?03:33View SolutionThe given Bar Graph presents the number of students of two schools for six years. दिया गया दंड आरेख (बार ग्राफ) छह वर्षो के दौरान दो स्कूलों में विद्यार्थियों की संख्या को दर्शाता है| In which year, the percentage increase in students in school B is the highest in comparison to its previous year? किस वर्ष में, स्कूल B के विद्यार्थियों की संख्या में प्रतिशत वृद्धि इसके पिछले वर्ष की तुलना में सबसे अधिक है?
02:08View Solution

