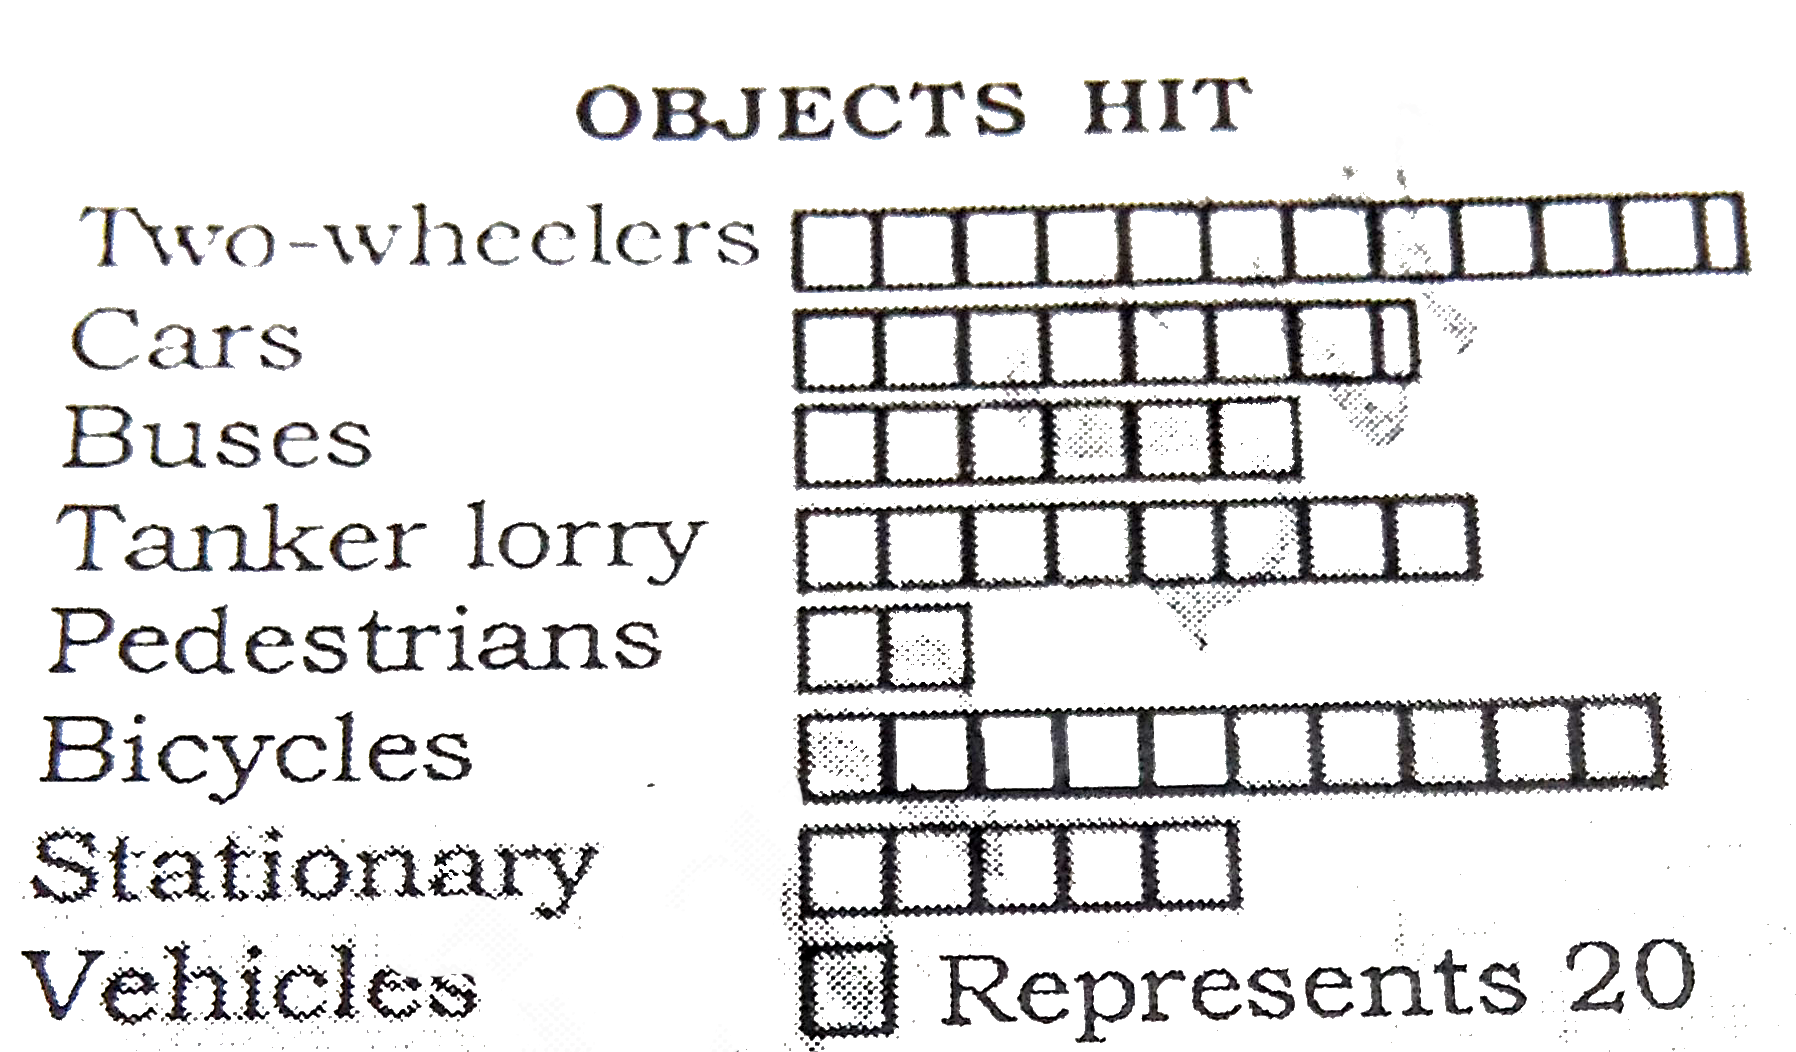
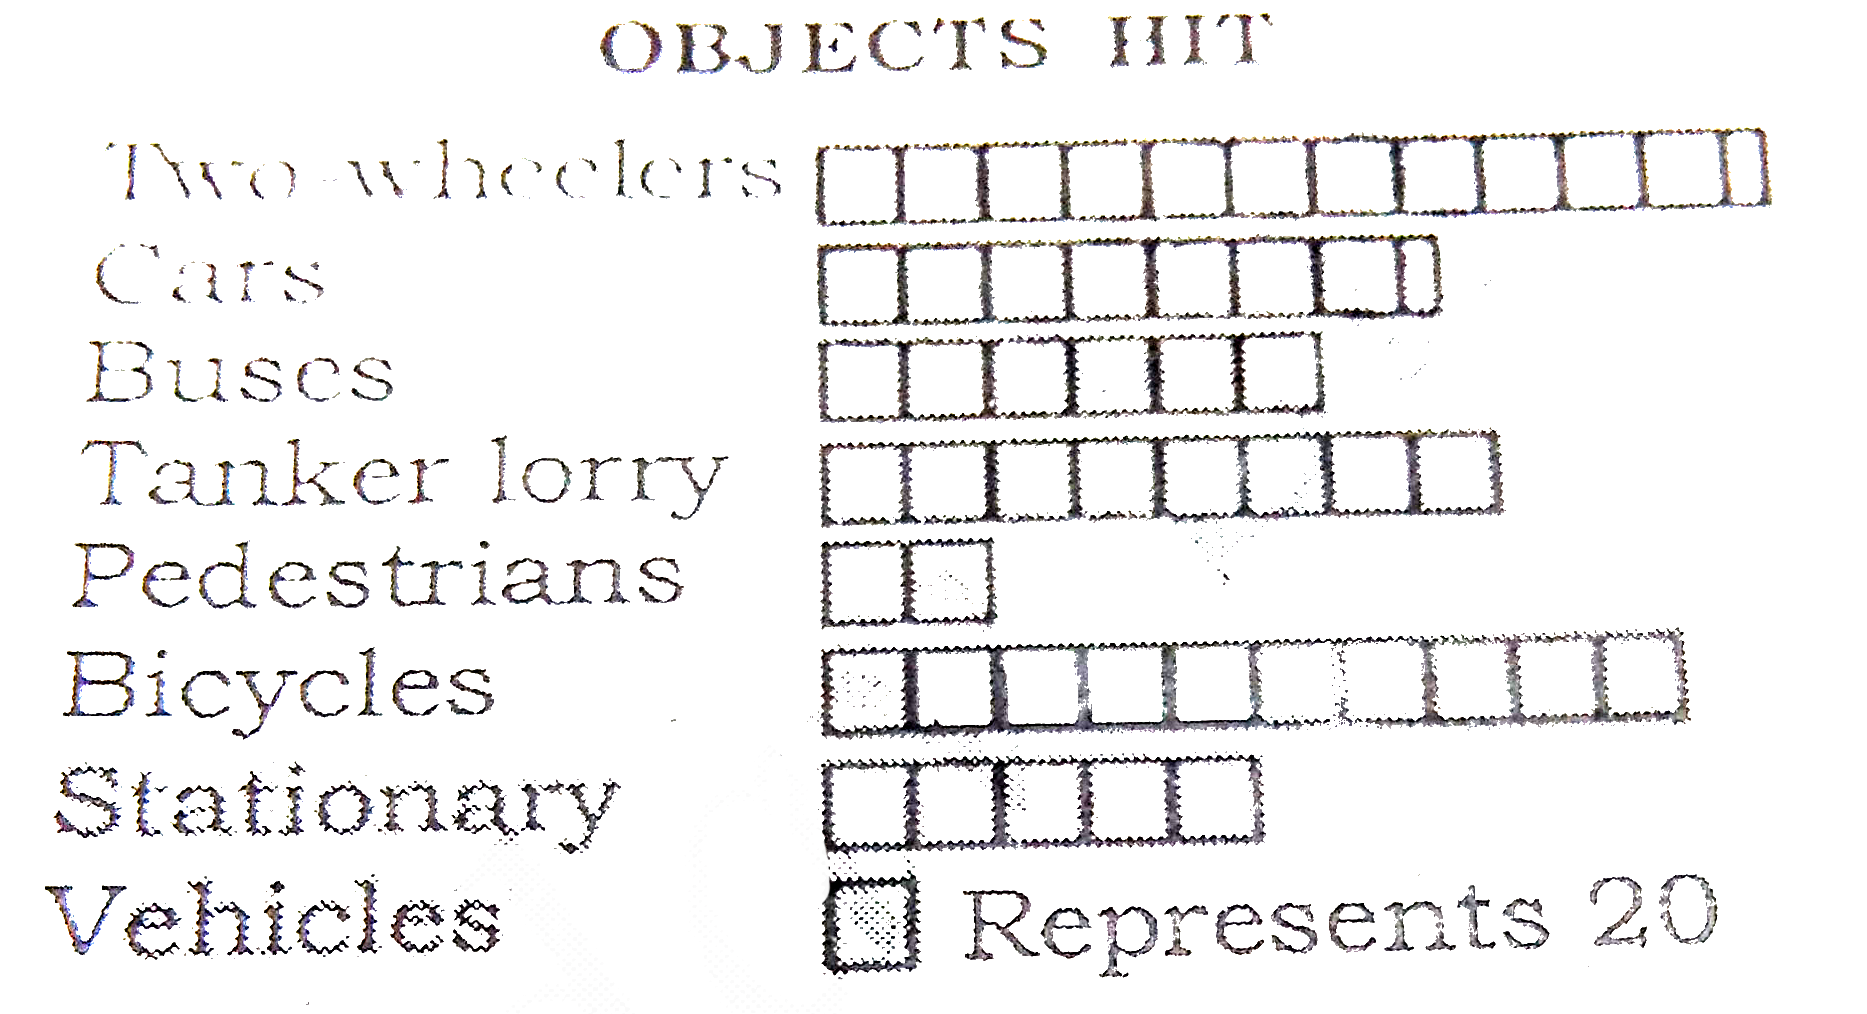
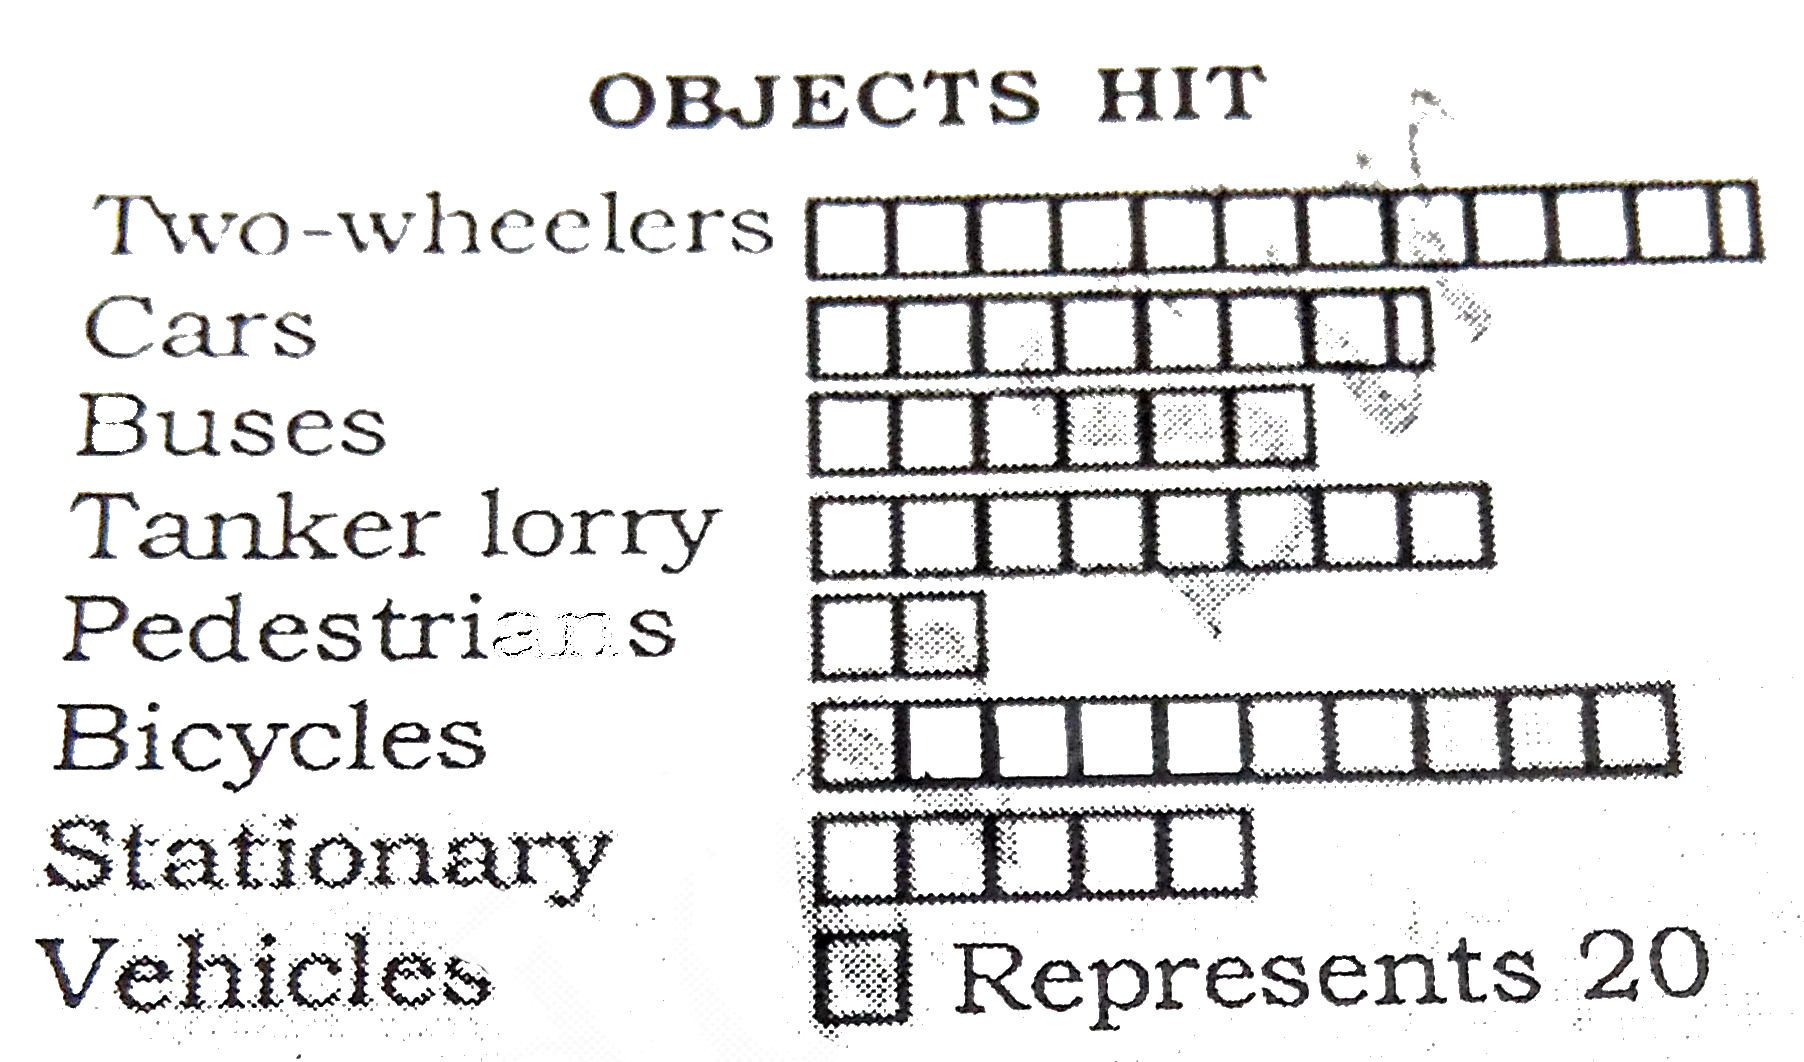
The following is a horizontal bar diagram showing the accidents in which two - wheelers are involved with other objects. Study the diagram and answer the question.

बस द्वारा होने वाली दुर्घटनाओं कार द्वारा होने वाली दुर्घटनाओं से कितने कम है ।
6%
4%
40%
28%
Required difference =160−1201000×100=4%
Topper's Solved these Questions
Similar Questions
सरल करें: 1+11+22+31+45
04:09View SolutionA एक काम को 6 दिनों में तथा B उसी काम को 9 दिनों में कर सकता है दोनों मिलकर उस काम को कितने दिन में पूरा करेंगे ?
04:26View SolutionThe following is a horizontal bar diagram showing the accidents in which two - wheelers are involved with other objects. Study the diagram and answer the question.

दो पहिया वाहनों एवं अन्य वाहनों द्वारा होने वाली दुर्घटनाओं के बीच कितने प्रतिशत का अंतर है01:10View SolutionThe following is a horizontal bar diagram showing the accidents in which two - wheelers are involved with other objects. Study the diagram and answer the question.

कुल दुर्घटनाओं का 60% निम्न वाहनों से होता है ।06:07View SolutionThe following is a horizontal bar diagram showing the accidents in which two - wheelers are involved with other objects. Study the diagram and answer the question.

पैदल तथा साइकिल से होने वाली दुर्घटनाओं का कितना है ।02:11View SolutionWhich of the following are correct chain isomers of butane ? (i)
02:45View SolutionDetermine the point of symmetry of a regular hexagon.
02:17View SolutionMatch the following Column A to Column B
 05:41View Solution
Match the following Column A to Column B
 02:10View Solution
Match the following Column A to Column B
 02:17View Solution
The inequation represented by the graph given below is :
02:10View SolutionThe inequation that best describes the graph given below is _________
View SolutionThe inequation that best describes the following graph is _________
02:21View SolutionWhich of the following best describes the diagram below of a molecular orbital?
ltimg src="https://d10lpgp6xz60nq.cloudfront.net/physics_images/JM_18_CHE_P1_E02_029_Q01.png" width="80%"gt01:54View SolutionDirections (Q. Nos. 16-20) The fallowing is a horizontal bar diagram showing the accidents in which two wheelers are involved with other objects. Study the diagram and answer the questions.

. The percentage of accidents in pedestrians and cyclists are involved is05:37View Solution

