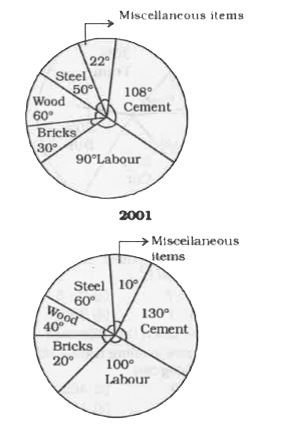
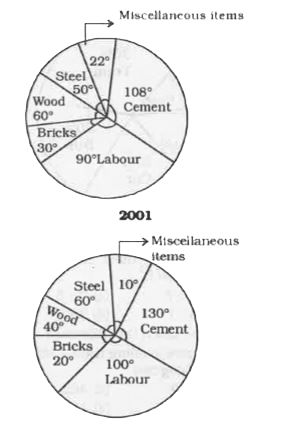
Pie charts show the expenses on various heads show the expenses on various heads in construction of a house Study the pie chart
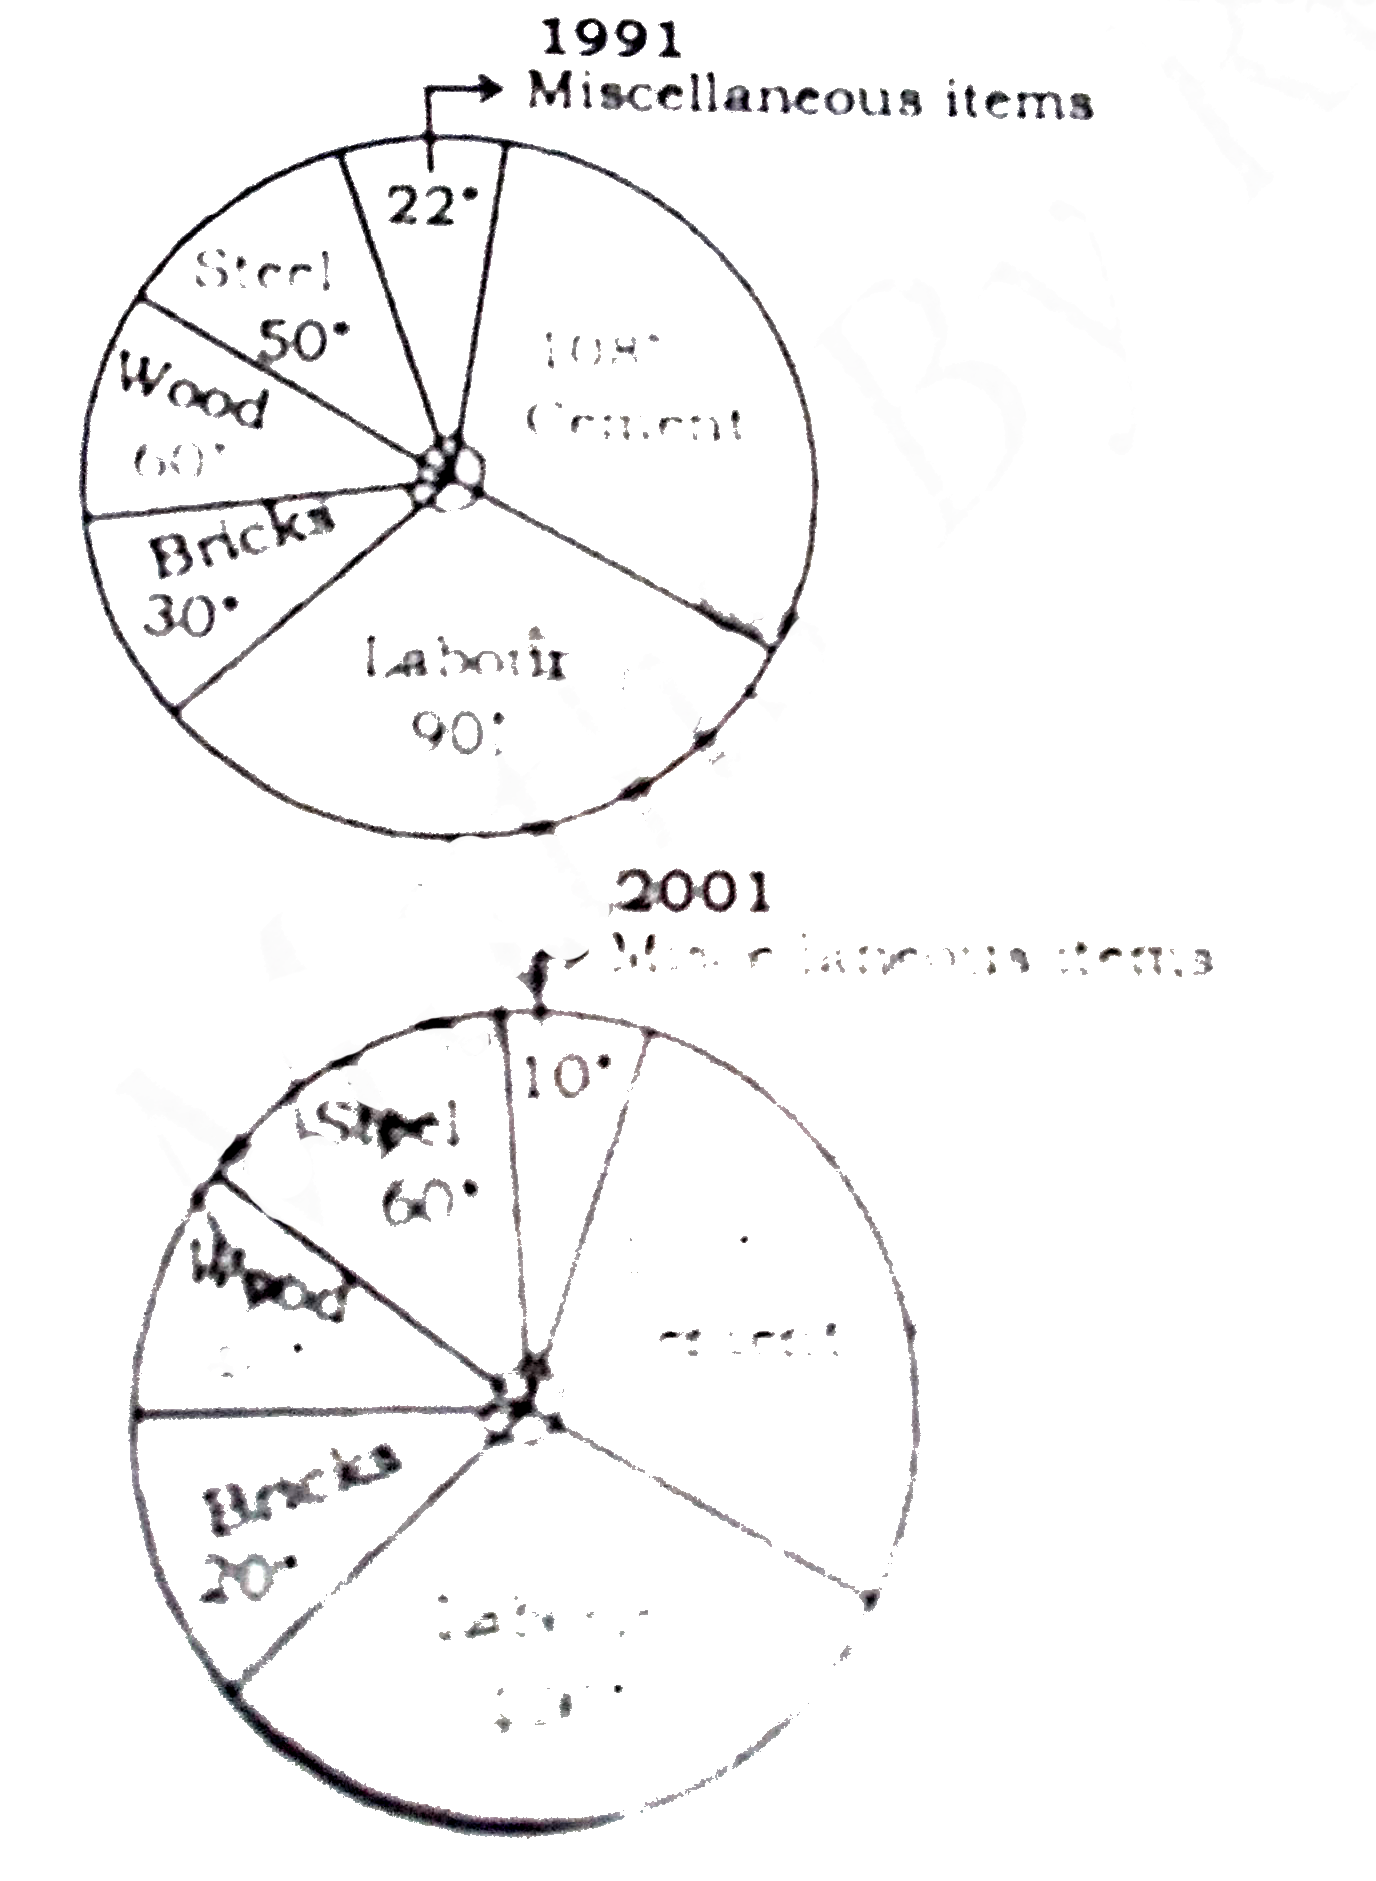
यदि एक घर के निर्माण में वर्ष 1991 में रू 360000 तथा वर्ष 2001 में कुल रू 864000 खर्च किया गया हो तो बताये वर्ष 1991 से 2001 में मजदूरी लागत में कितने % की बढ़ोतरी हुई ।
319%
4313%
4123%
16623%
The correct Answer is:D
Expenditure on labourers:
Year 1991 ⇒(360000×90∘360∘)=Rs.90000
Year 2001⇒864000×100∘360∘=Rs.240000
Percentage increase =240000−9000090000×100
=16623%
Topper's Solved these Questions
Similar Questions
सरल करें: 1+11+22+31+45
01:11View SolutionA एक काम को 6 दिनों में तथा B उसी काम को 9 दिनों में कर सकता है दोनों मिलकर उस काम को कितने दिन में पूरा करेंगे ?
01:24View SolutionPie charts show the expenses on various heads show the expenses on various heads in construction of a house Study the pie chart
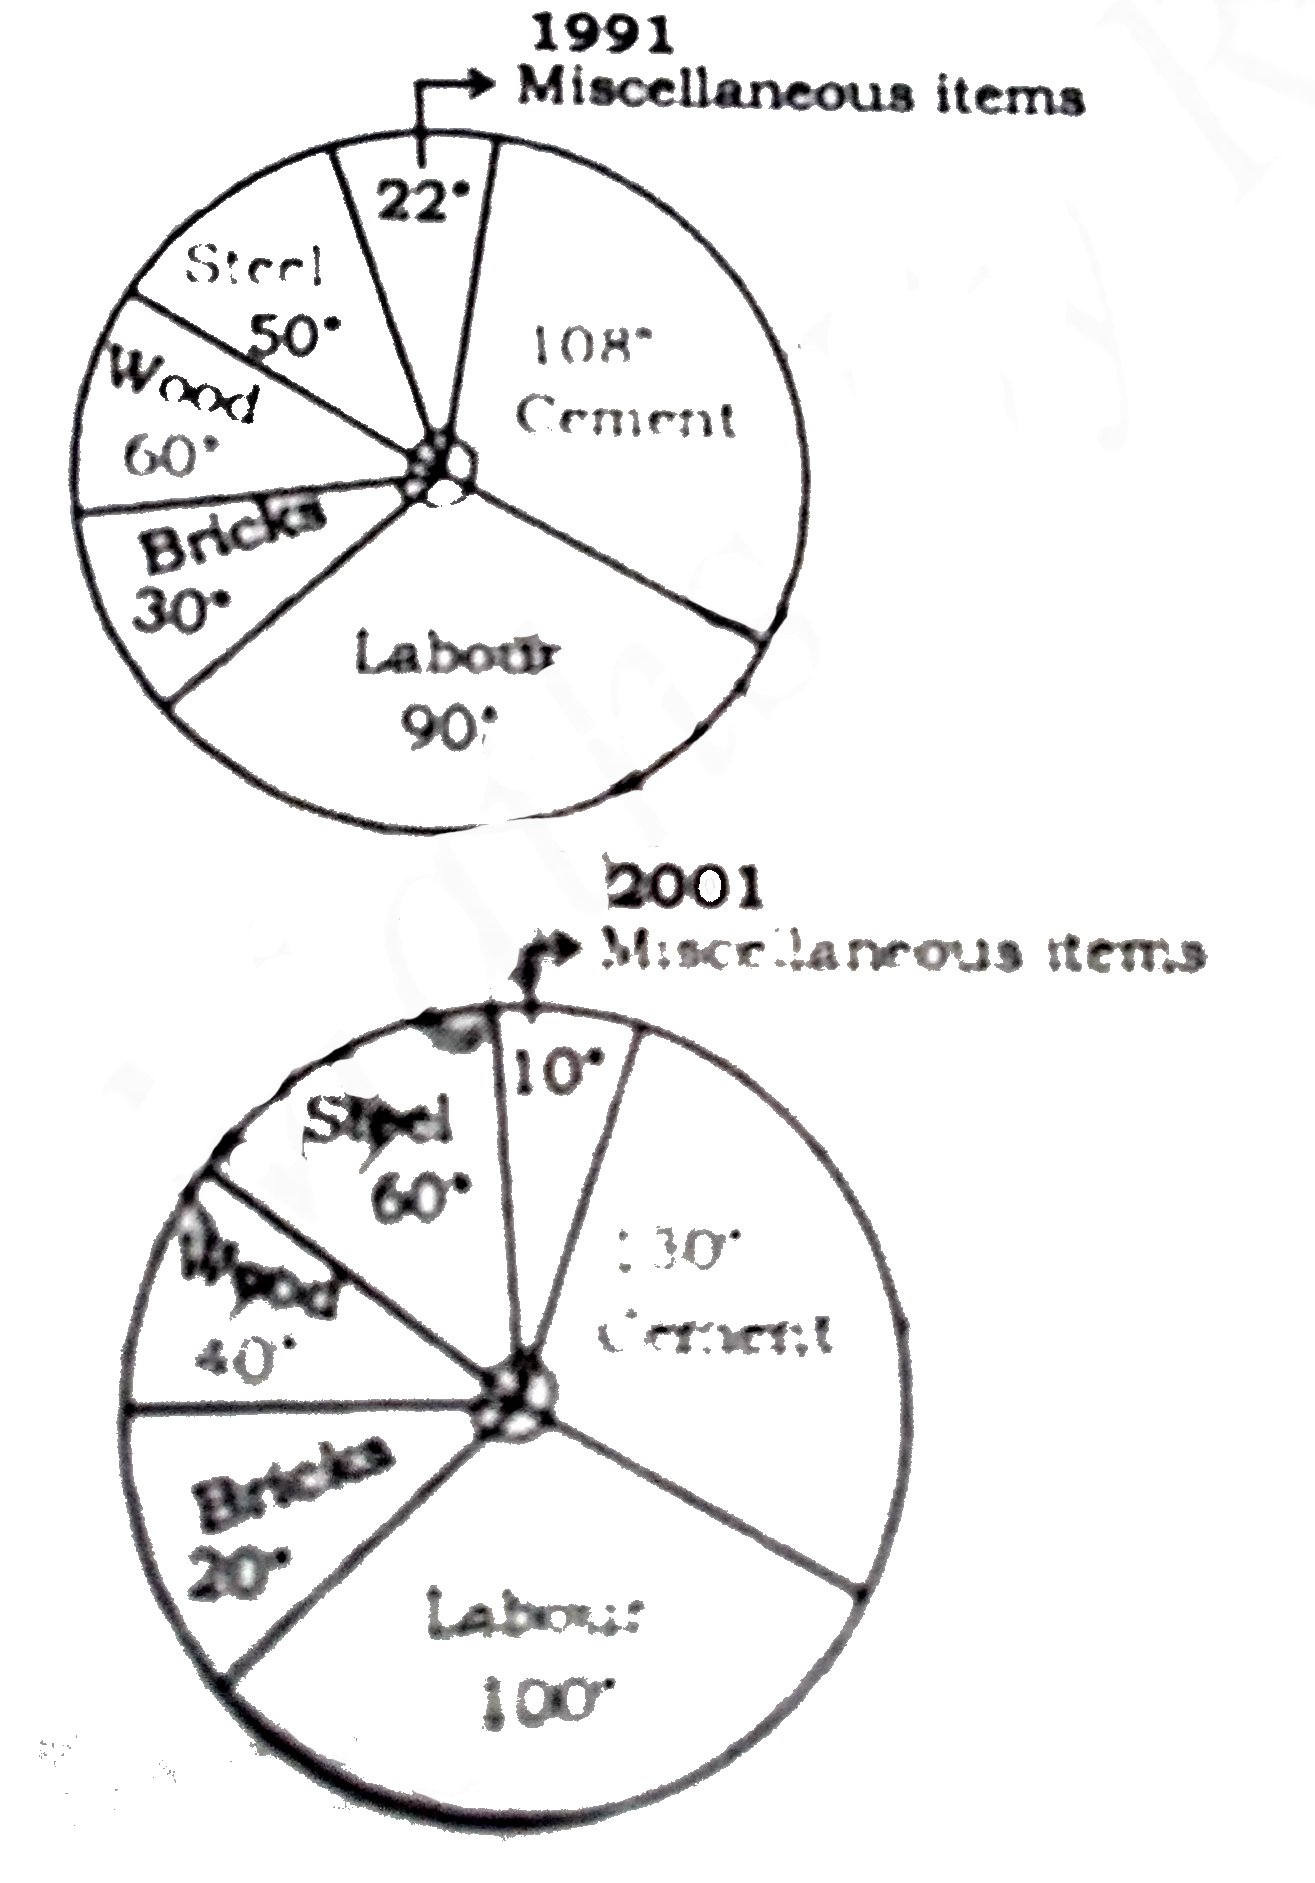
वर्ष 1991 में सीमेंट पर कुल कितने प्रतिशत खर्च किया गया ।06:14View SolutionPie charts show the expenses on various heads show the expenses on various heads in construction of a house Study the pie chart
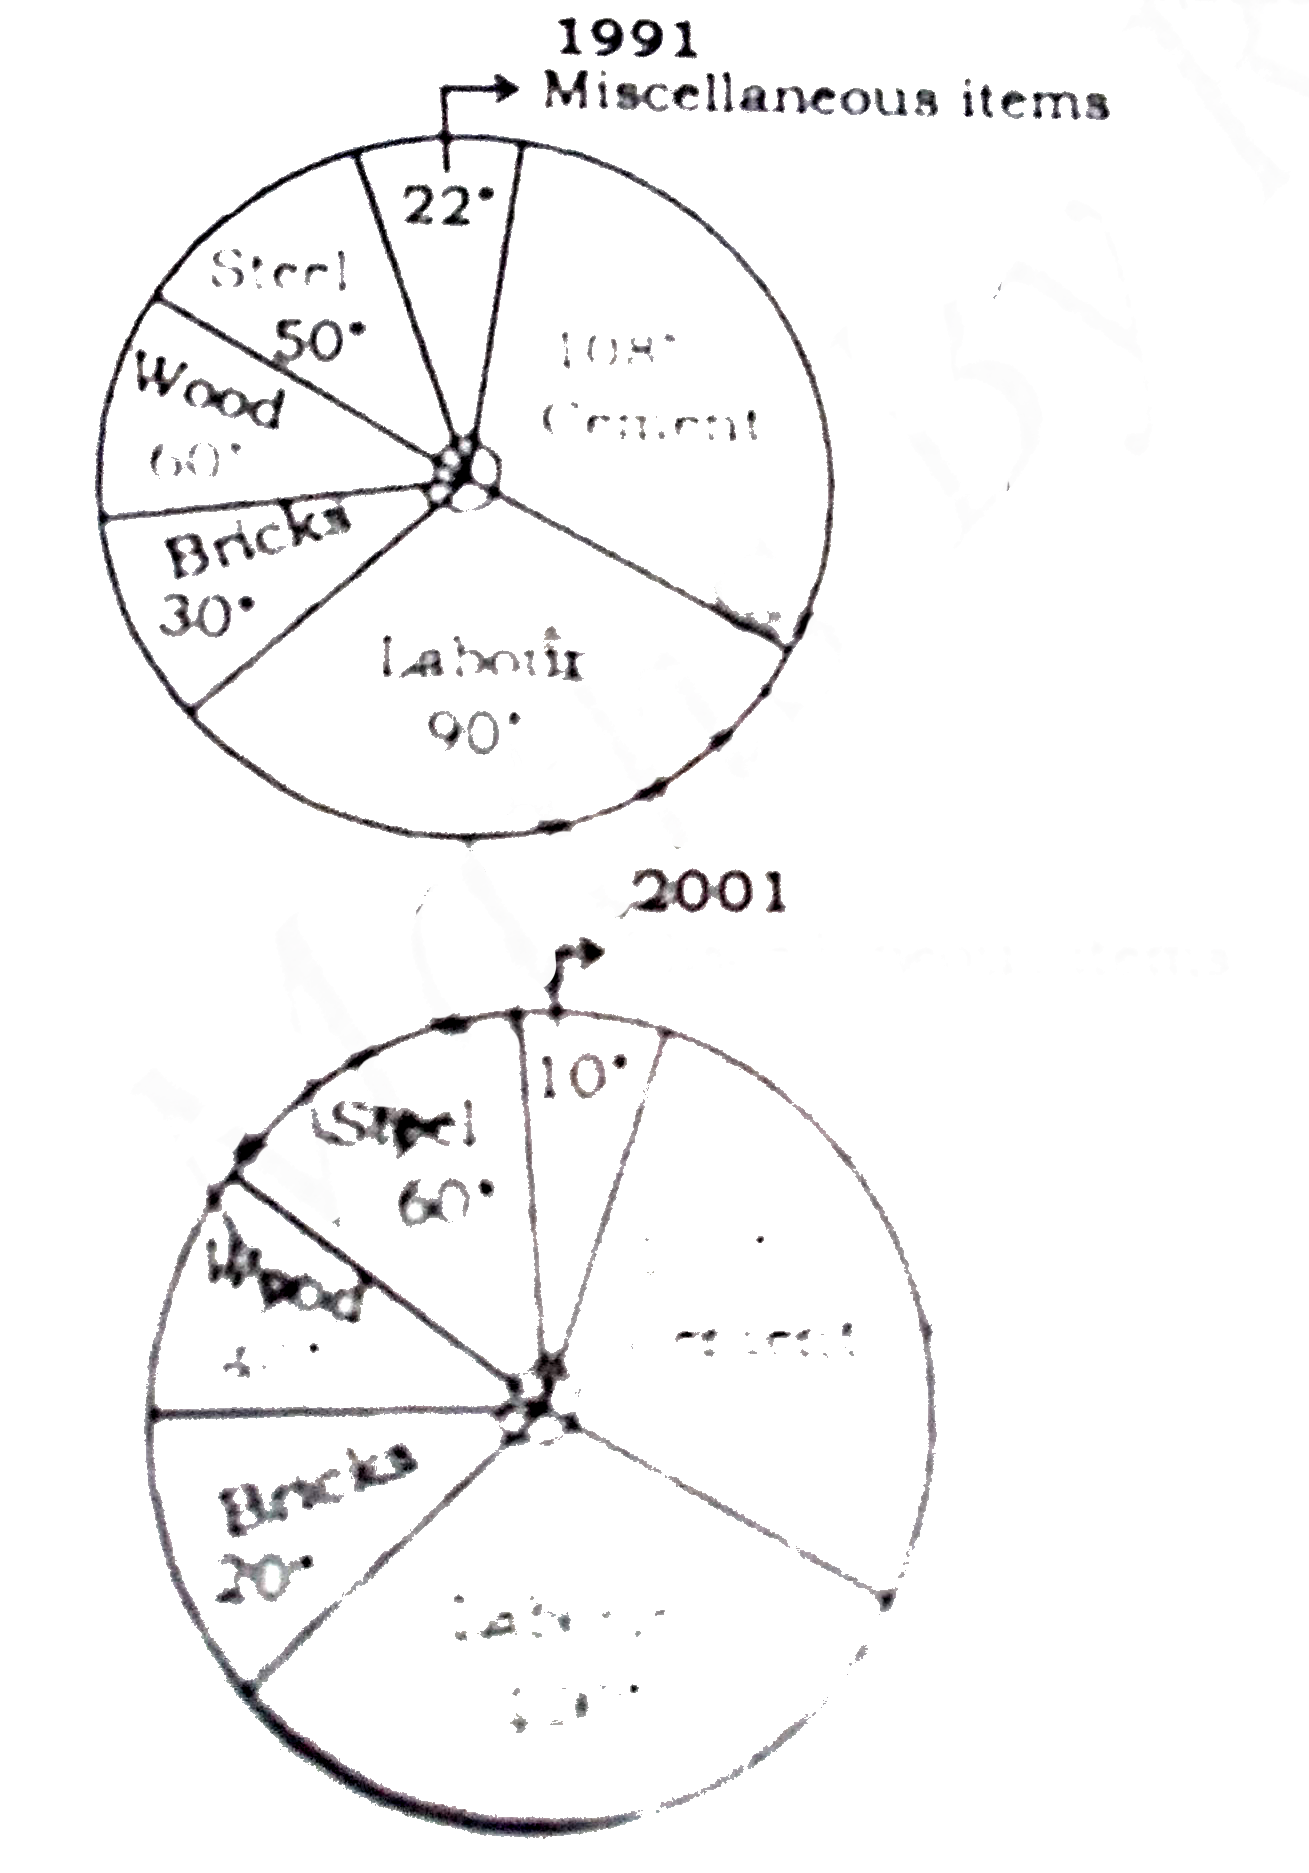
यदि भवन निर्माण की कुल लागत वर्ष 1991 में रू 3,60,000 तथा वर्ष 2001 में लागत रू 8,64,000 हो तो बताये वर्ष 1991 तथा 2001 में इस्पात पर कितने रुपये खर्च किये गए ।02:08View Solutionयह ज्ञात है की महाविद्यालय के छात्रों में से 60 % छात्रावास में रहते है और 40 % छात्रावास में नहीं रहते है । पूर्ववर्ती वर्ष से परिणाम सूचित करते है की छात्रावास में रहने वाले छात्रों में से30 % छात्रों में से 20 % छात्रों ने A ग्रेड लिए। वर्ष के अंत में महाविद्यालय के एक छात्र को यादृच्छया चुना गया और पाया गया की उसे A ग्रेड मिला है । इस बात की क्या प्रायिकता है की वह छात्रावास में रहने वाला है ?
01:57View SolutionThe population of a town has increased by 5% at the end of the first year and decreased by 4% at the end of second year. If the population at the end of second year was 55,12,248, then the population at the beginning of first year was:
एक शहर की आबादी पहले वर्ष के अंत में 5% बढ़ी है और दूसरे वर्ष के अंत में 4% कम हुई। यदि दूसरे वर्ष के अंत में जनसंख्या 55,12,248 थी, तो पहले वर्ष की शुरुआत में जनसंख्या थी:02:42View SolutionThe given bar graph shows the number of marks scored by a student in each subject in three years.
दिया गया दंड आरेख एक छात्र के द्वारा तीन वर्षो में प्रत्येक विषय में लाये गए अंकों को दर्शाता है |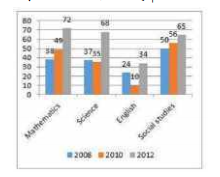 In the given chart, what is the percentage increase in marks in Mathematics in 2012 compared to 2008 (round off) ? /
इस आरेख में वर्ष 2008 की तुलना में वर्ष 2012 में गणित के अंकों में कितने प्रतिशत की वृद्धि हुई है ?02:01View SolutionThe given Bar Graph presents the sales of the number of books (in thousands) by six benches of a publishing company during two consecutive years 2000 and 2001. दिया गया दंड आरेख लगातार दो वर्षों : 2000 और 2001 में एक प्रकाशन कंपनी की छः शाखाओं के द्वारा बेची गयी पुस्तकों की संख्या ( हज़ार में ) दर्शाता है | The ratio of total sales by all branches for the year 2001 to total sales by all branches for the year 2000 is: वर्ष 2001 में सभी शाखाओं की कुल बिक्री का वर्ष 2000 में सभी शाखाओं की कुल बिक्री के साथ अनुपात ज्ञात करें|
03:22View SolutionThe Pie-chart given below shows the figures of various heads of expenditure incurred by Anurag in a year. In how many heads is his expenditure less than the expenditure he incurred on tax?
नीचे दिया गया वृत्त आरेख अनुराग द्वारा किसी वर्ष में किए गए व्यय के विभिन्न शीर्षों के आंकड़ों को दर्शाता है | उसके द्वारा टैक्स पर किए गए व्यय की तुलना में कितने शीर्षों में उसके व्यय कम हैं ?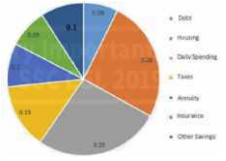 03:22View Solution
In the following table, the production of various crops (in tonnes) is given from 2015 to 2019. Study the table and answer the question that follows:
दी गयी तालिका में, 2015 से 2019 तक विभिन्न फसलों का उत्पादन (टन में ) दिया गया है | इस तालिका का अध्ययन करें तथा फिर पूछे गए प्रश्न का उत्तर दीजिए |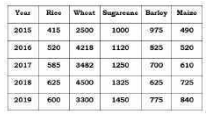 The percentage growth of maize in the year 2019 over the year 2015 is: (correct to one decimal place)
वर्ष 2019 में वर्ष 2015 की तुलना में मक्का के उत्पादन में कितने प्रतिशत की वृद्धि हुई है ? ( दशमलव के एक स्थान तक )02:19View SolutionStudy the chart and answer the questions:
In which of the given years is the percentage increase in the number of hotels in comparison to the previous year, is the maximum?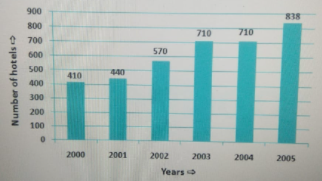
चार्ट का अध्ययन करें और प्रश्नों का उत्तर दें:पिछले वर्ष की तुलना में होटलों की संख्या में किस वर्ष में अधिकतम प्रतिशत वृद्धि हुई है?01:45View SolutionStudy the following pie-chart and answer the given questions. The pie chart shows the Budget Expenditure of a company in the year 2018 (percentage distribution) on different heads A, B, C, D and E. If ₹165 crore were spent in the year 2018 on A, what would have been the total expenditure for that year (in ₹ crores)?
निम्नलिखित पाई-चार्ट का अध्ययन करें और दिए गए प्रश्नों के उत्तर दें
पाई चार्ट वर्ष 2018 में एक कंपनी के बजट व्यय को अलग-अलग प्रमुखों A, B, C, D और E पर दिखाया गया है।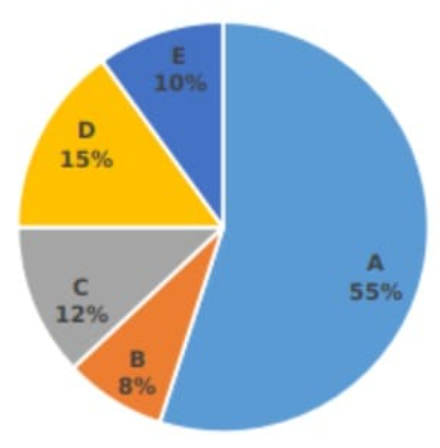
यदि A पर वर्ष 2018 में ₹165 करोड़ खर्च किए गए थे, तो उस वर्ष (₹ करोड़ों में) कुल खर्च क्या रहा होगा?02:28View SolutionPie charts shows the expenses on various heads in construction of a house. Study the pie-chart.
What percentage of the total amount is being spent on cement in 1991 ?02:17View SolutionPie charts shows the expenses on various heads in construction of a house. Study the pie-chart. The percentage increase in the amount spent on labour from 1991 to 2001, given that the total amount spent on the construction of the house is Rs 3,60,000 in 1991 and Rs 8,64,000, in 2001 is
01:19View SolutionPie charts shows the expenses on various heads in construction of a house. Study the pie-chart.
If the total cost of constructing the house is rs 3,60,000 in 1991 and Rs 8,64,000, in 2001, what is the amount spent on Steel in 1991 and 2001 ?04:25View Solution

