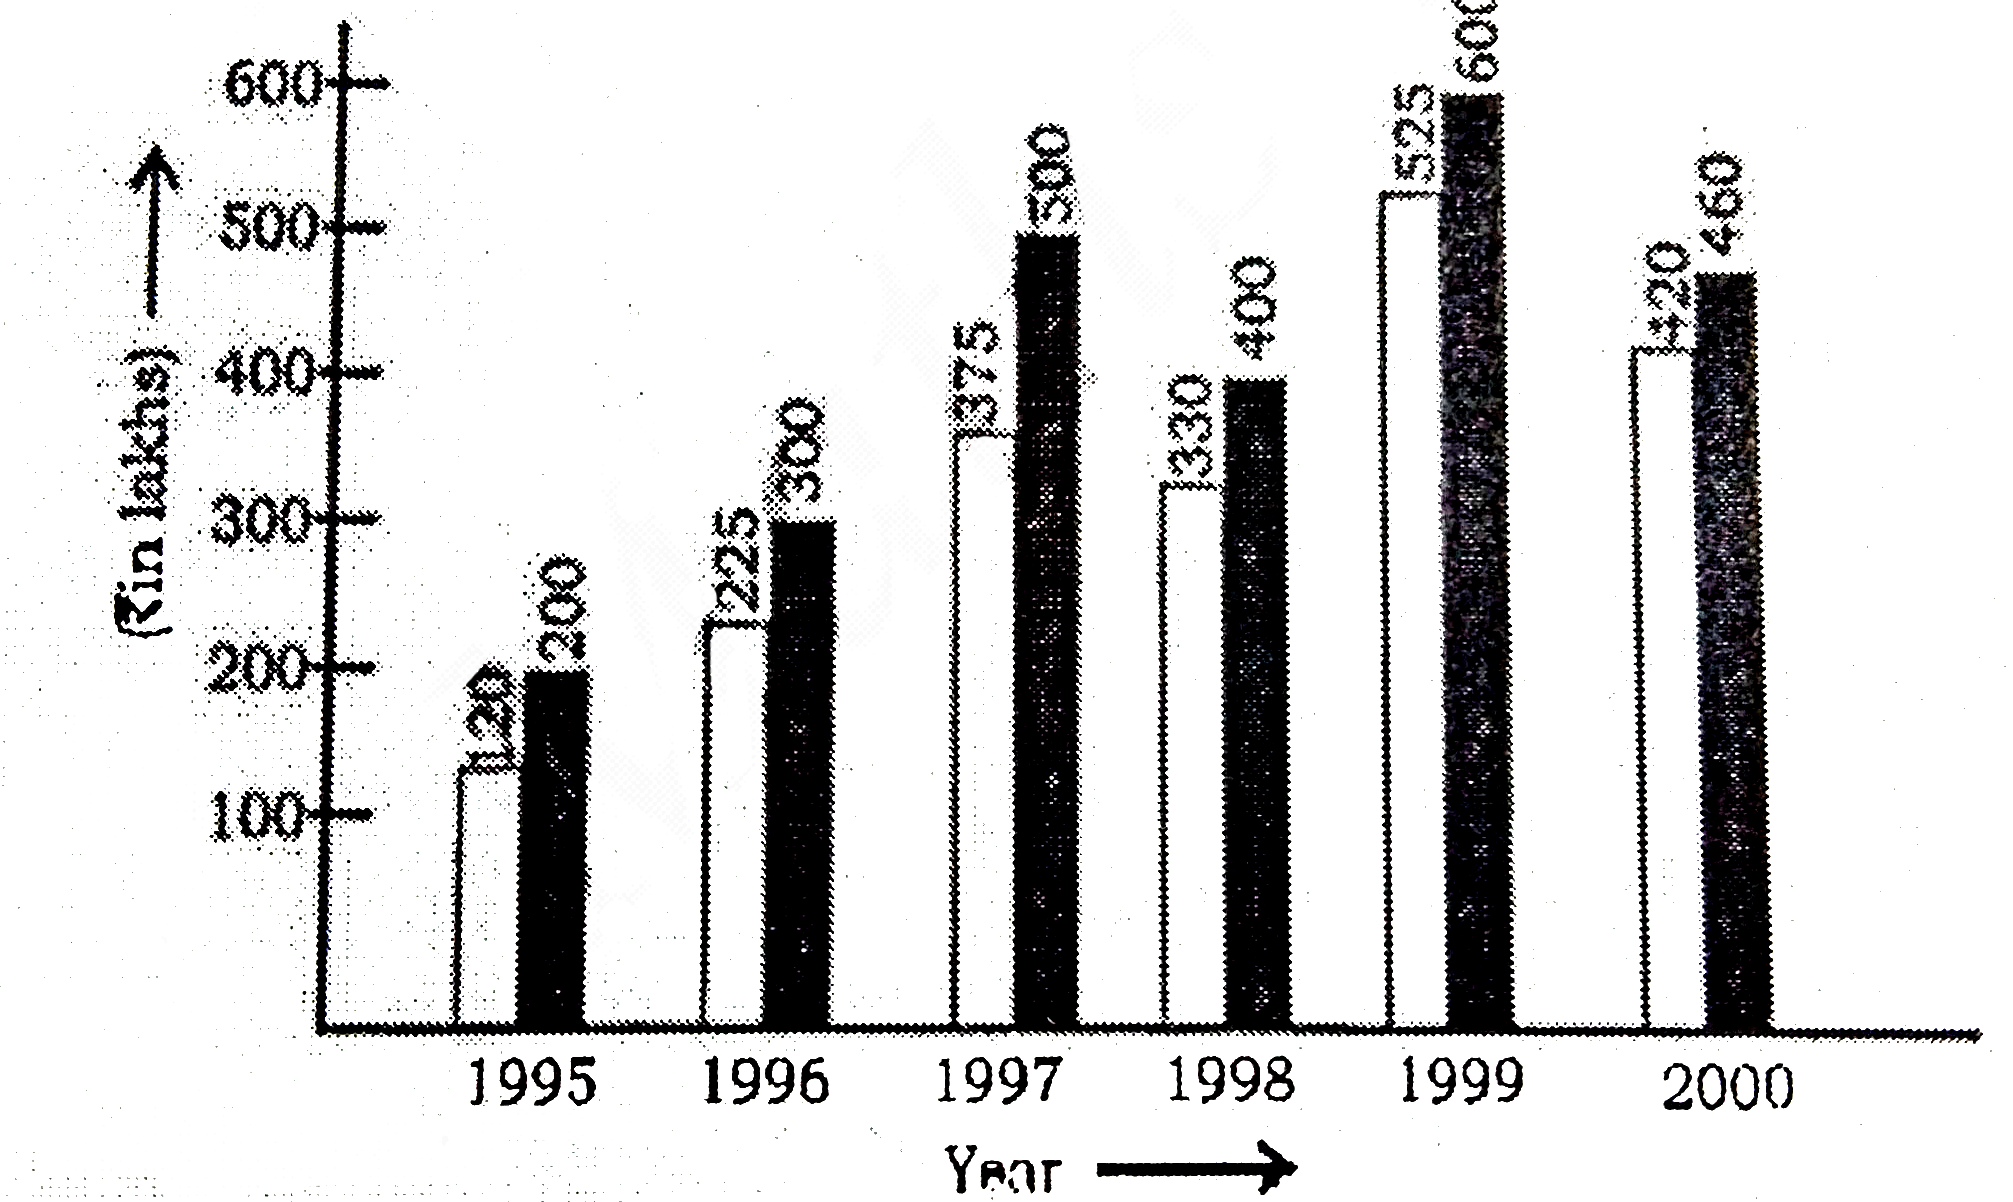
Study the following graph and answer the given questions

दिए गए समयांतराल में कच्चे माल पर किया गया औसत निवेश तथा फिनिशिंग गुड्स की औसत बिक्री कीमत में अंतर बताये ।
रू 62.5 lakhs
रू 68.5 lakhs
रू 71.5 lakhs
रू 77.5 lakhs
Average of total investment
=16(120+225+375+330+525+420)
=16×1995= Rs . 332.5 Lakhs
Average of sales =200+300+500+400+600+4606
=24606=Rs.410
Topper's Solved these Questions
Similar Questions
सरल करें: 1+11+22+31+45
View SolutionA एक काम को 6 दिनों में तथा B उसी काम को 9 दिनों में कर सकता है दोनों मिलकर उस काम को कितने दिन में पूरा करेंगे ?
View SolutionWhich of the following are correct chain isomers of butane ? (i)
View SolutionDetermine the point of symmetry of a regular hexagon.
View SolutionDtermine the images of the following figure about the given line :
View SolutionMatch the following Column A to Column B

View SolutionMatch the following Column A to Column B

View SolutionMatch the following Column A to Column B

View SolutionFind the area of figure given below.

View SolutionFind the area of the figure given below.

View SolutionCalculate the volume of the given solid.
ltimg src="https://d10lpgp6xz60nq.cloudfront.net/physics_images/PS_MATH_VII_C06_E03_002_Q01.png" width="80%"gt
View SolutionThe area of the shaded part in the figure given below is ______.

View SolutionThe inequation represented by the graph given below is :
View SolutionThe inequation that best describes the graph given below is _________
View SolutionThe inequation that best describes the following graph is _________
View SolutionWhich inequations represent the shaded region in the given figure
View Solution
