निर्देश :- निम्नलिखित तालिका में 1927-1927 तक विश्व में इस्पात का उत्पादन दर्शाया गया है तालिका का अध्ययन करे और प्रश्नो का उत्तर दे ।
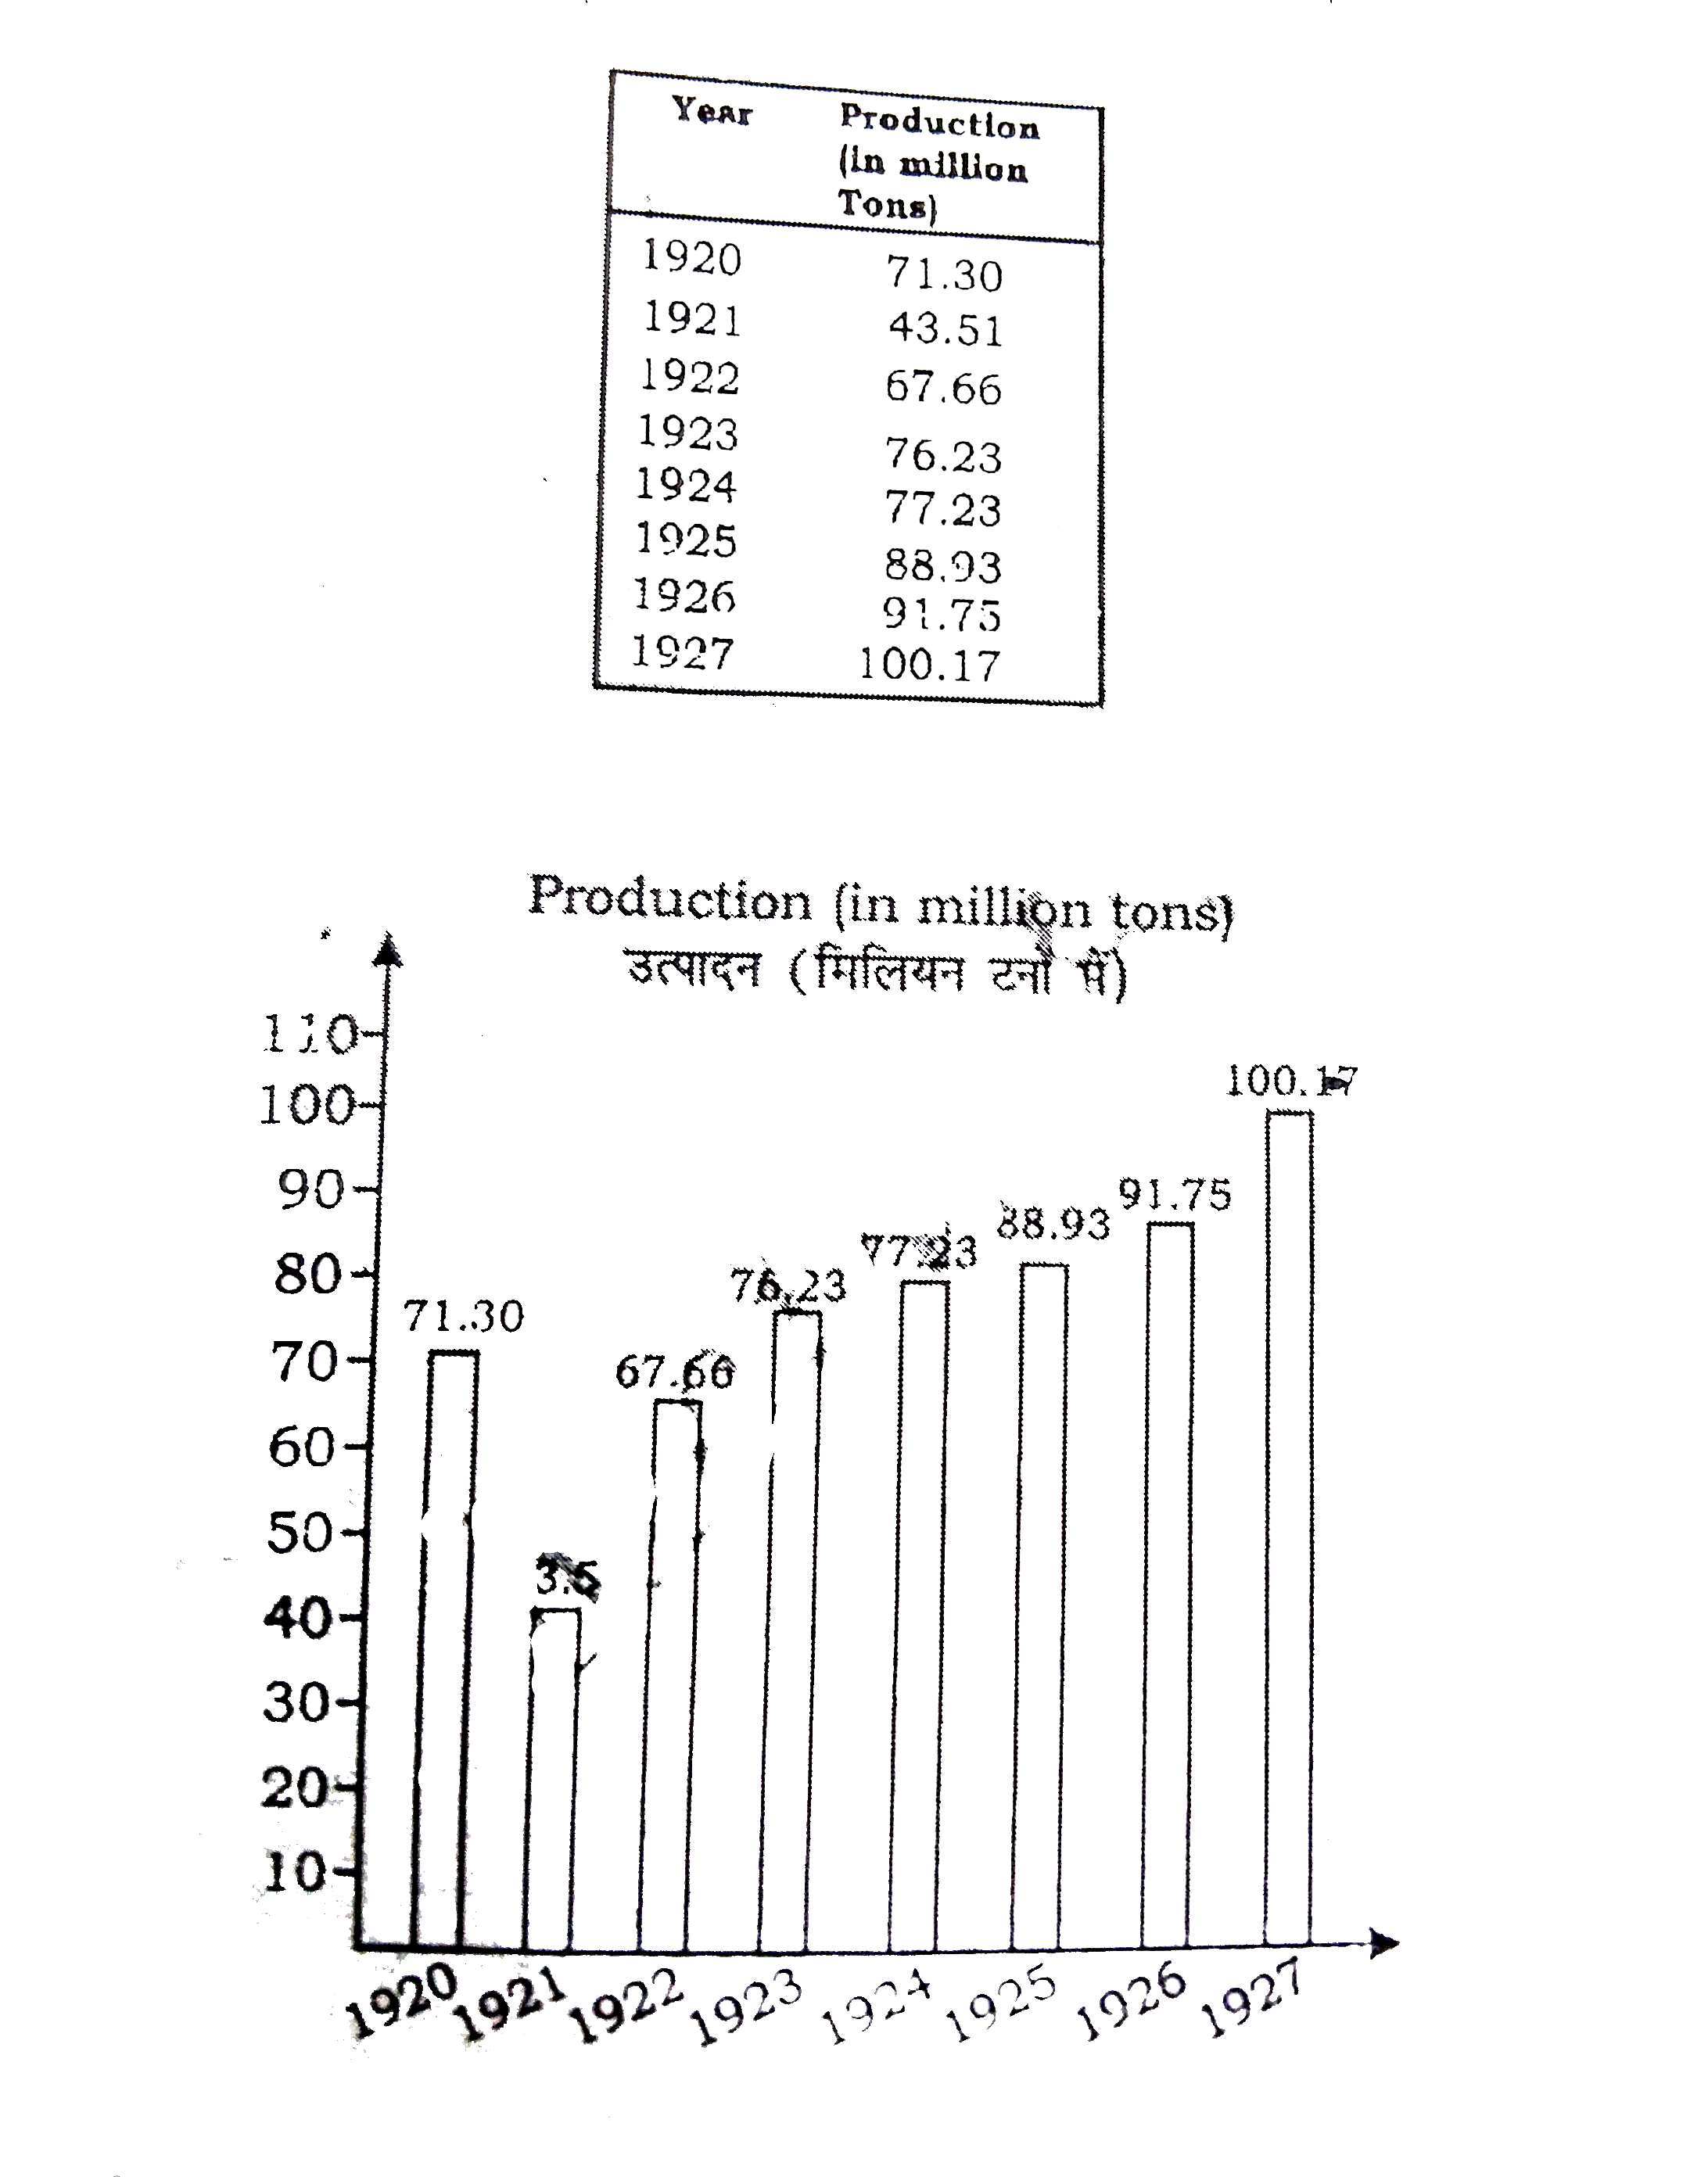
इस्पात का औसत उत्पादन है-
74.07
75.13
77.10
76.09
The correct Answer is:C
The average production during (1920-1927)
71.30+43.51+67.66+76.23+77.23+88.93+91.75+100.178
=77.0975 (milion tons)
Topper's Solved these Questions
Similar Questions
सरल करें: 1+11+22+31+45
02:11View SolutionA एक काम को 6 दिनों में तथा B उसी काम को 9 दिनों में कर सकता है दोनों मिलकर उस काम को कितने दिन में पूरा करेंगे ?
02:45View SolutionDetermine the point of symmetry of a regular hexagon.
02:17View SolutionMatch the following Column A to Column B
 05:41View Solution
Match the following Column A to Column B
 02:10View Solution
Match the following Column A to Column B
 02:17View Solution
The inequation represented by the graph given below is :
02:10View SolutionThe inequation that best describes the graph given below is _________
02:18View SolutionThe inequation that best describes the following graph is _________
01:45View SolutionThe average Kharif production of the given years is- दिए गए वर्षों में खरीफ का फसलों का औसत उत्पादन कितना है?
03:22View SolutionIn the following table, the production of various crops (in tonnes) is given from 2015 to 2019. Study the table and answer the question that follows:
दी गयी तालिका में, 2015 से 2019 तक विभिन्न फसलों का उत्पादन (टन में ) दिया गया है | इस तालिका का अध्ययन करें तथा फिर पूछे गए प्रश्न का उत्तर दीजिए |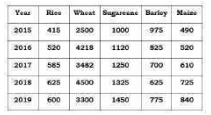 The average production of wheat (in tonnes) in the period given in the table is:
तालिका में दी गयी अवधि में गेहूँ का औसत उत्पादन ( टन में ) कितना रहा है ?02:14View SolutionIn the following table, the production of various crops (in tonnes) is given from 2015 to 2019. Study the table and answer the question that follows:
दी गयी तालिका में, 2015 से 2019 तक विभिन्न फसलों का उत्पादन (टन में ) दिया गया है | इस तालिका का अध्ययन करें तथा फिर पूछे गए प्रश्न का उत्तर दीजिए |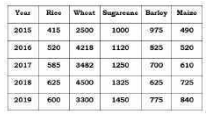 The percentage growth of maize in the year 2019 over the year 2015 is: (correct to one decimal place)
वर्ष 2019 में वर्ष 2015 की तुलना में मक्का के उत्पादन में कितने प्रतिशत की वृद्धि हुई है ? ( दशमलव के एक स्थान तक )04:05View SolutionIn the following table, the production of various crops (in tonnes) is given from 2015 to 2019. Study the table and answer the question that follows:
दी गयी तालिका में, 2015 से 2019 तक विभिन्न फसलों का उत्पादन (टन में ) दिया गया है | इस तालिका का अध्ययन करें तथा फिर पूछे गए प्रश्न का उत्तर दीजिए |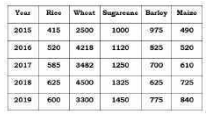 The highest growth of sugarcane production over its previous year is recorded in the year:/
किस वर्ष गन्ने का उत्पादन पिछले वर्ष की तुलना में अधिकतम रहा है ?02:17View SolutionIn the following table, the production of various crops (in tonnes) is given from 2015 to 2019. Study the table and answer the question that follows:
दी गयी तालिका में, 2015 से 2019 तक विभिन्न फसलों का उत्पादन (टन में ) दिया गया है | इस तालिका का अध्ययन करें तथा फिर पूछे गए प्रश्न का उत्तर दीजिए |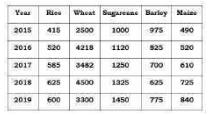 The difference (in tonnes) between the average production of barley and average production of rice is:
जौ के औसत उत्पादन तथा चावल के औसत उत्पादन के बीच क्या अंतर (टन में ) है?View Solutionनिम्नलिखित शब्दों में किसमें उपसर्ग का निर्देश अशुद्ध है?
02:05View Solutionयदि '+' का अर्थ है '+', 'x' का अर्थ है '+',’-’ का अर्थ है 'x’ और ‘+’ का अर्थ है ‘-’ तब निम्नलिखित में से कौन-सा समीकरण सही है?
View Solution

