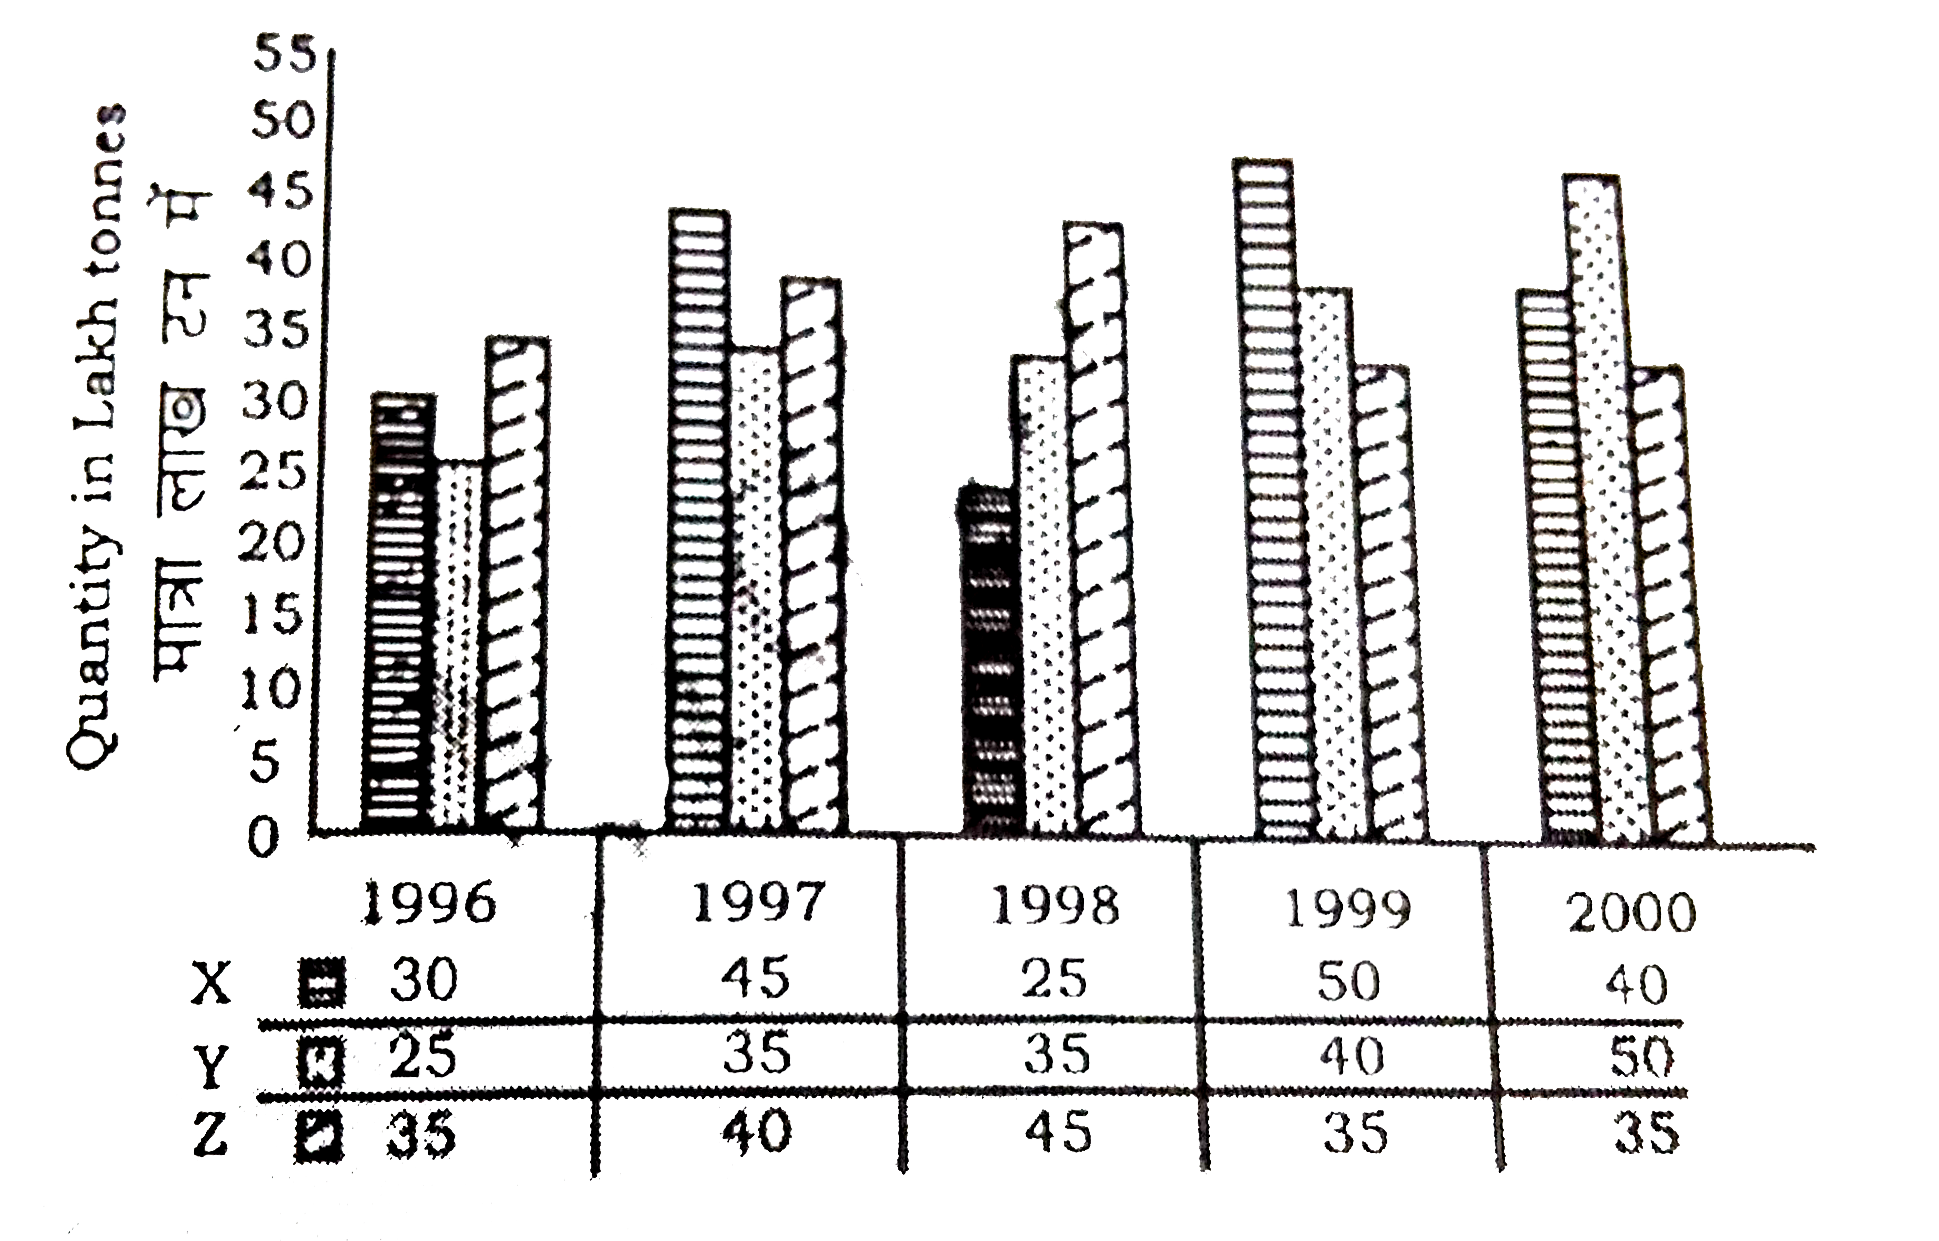
निर्देश :- नीचे दिए गए दंड आलेख में दिए गए वर्षो में किये कागज़ के उत्पादन (लाख ट्न में ) आंकड़ों को दर्शाया गया है बार चार्ट का अध्ययन कीजिये और प्रश्नो का उत्तर दीजिये ।

Z कंपनी के उत्पादन और कंपनी के उत्पादन का प्रतिशत किस वर्ष अधिकतम रहा ?
1996
1999
2000
1998
1996 (percentage is maximum
Topper's Solved these Questions
Similar Questions
सरल करें: 1+11+22+31+45
View SolutionA एक काम को 6 दिनों में तथा B उसी काम को 9 दिनों में कर सकता है दोनों मिलकर उस काम को कितने दिन में पूरा करेंगे ?
View SolutionStudy the following graph which shows the production (in thousand) of different items, and answer the questions. निम्नलिखित ग्राफ का अध्ययन कीजिए, जिन विभिन्न मदों का उत्पादन (हजार में) दर्शाया गया है तथा दिए गए प्रश्नों के उत्तर दीजिए। The total number of all products produced by the company in the year 2006 and 2008 together is:- कंपनी द्वारा वर्ष 2006 और 2008 में तेयार सभी उत्पादों को मिलाकर उनकी कुल संख्या कितनी है?
View SolutionThe following line diagram represents the yearly sales figure of a company in the years 2001-2010. Examine the diagram and answer the question. निम्नलिखित रेखा आरेख किसी कंपनी की वर्ष 2007-2010 के दौरान वार्षिक बिक्री के आंकड़ों को दर्शाता है। आरेख का अध्ययन करें और नीचे दिए गए प्रश्नों के उत्तर दें- The ratio of sales in 2002 to that in 2007 is वर्ष 2002 में बिक्री का वर्ष 2007 में बिक्री के साथ अनुपात है-
View SolutionThe pie-chart provided below gives the distribution of land (in a village) under various food crops. Study the pie-chart carefully and answer the questions. नीचे दिए गए वृत्तारेखा में विभिन खाद्य फसलों के ( एक गाँव में ) भूमि का वितरण दिखाया गया हैं। वृत्तारेखा का अध्ययन कीजिए और प्रश्नों के उत्तर दीजिए। The ratio of the land used for rice and barley is चावल और जौ के उत्पादन के लिए प्रयुक्त भूमि का अनुपात है-
View SolutionThe given Bar graph presents the Demand and Production of motorcycles of five companies (in lakhs) दिया गया दंड आरेख पांच कंपनियों के संबंध में मोटरसाइकिलों की मांग और उत्पादन ( लाख में ) को दर्शाता है| What is the ratio of the total Demand of motorcycles of companies A and D taken together to the Production of motorcycles of company C? कंपनी A और D को मिलाकर मोटरसाइकिलों की कुल मांग का कंपनी C की मोटरसाइकिलों के उत्पादन के साथ अनुपात ज्ञात करें |
View SolutionThe bar graph given below shows the wheat production (in tonnes) of a large farm during the year 2011-2018. In how many years was wheat production higher than the average production of the period? नीचे दिए गए दंड आरेख में वर्ष 2011-2018 के दौरान किसी बड़े फार्म के गेहूं उत्पादन (टन में) को दर्शाया गया है | अवधि के औसत उत्पादन की तुलना में दिए गए कितने वर्षो में गेहूं उत्पादन अधिक था ?
View SolutionIn the given bar graph, the Blue bar shows the income and the Red bar shows the expenditure of a company. Study the graph and answer the question that follows
दिए गए दंड आरेख में, नीला दंड एक कंपनी की आय दिखाता है और लाल दंड खर्च (लाख रुपये में) को दर्शाता है। आरेख का अध्ययन करें और उस प्रश्न का उत्तर दें जो नीचे पूछा गया है। The income in 2001 was equal to the expenditure in the year:
2001 में आय किस वर्ष के व्यय के बराबर है :
View SolutionIn the given bar graph, the Blue bar shows the income and the Red bar shows the expenditure of a company. Study the graph and answer the question that follows
दिए गए दंड आरेख में, नीला दंड एक कंपनी की आय दिखाता है और लाल दंड खर्च (लाख रुपये में) को दर्शाता है। आरेख का अध्ययन करें और उस प्रश्न का उत्तर दें जो नीचे पूछा गया है। The percentage decrease in the income of the company in 2002 as compared to that in 2001 is:
2001 की तुलना में 2002 में कंपनी की आय में कितने प्रतिशत में कमी आई है:
View SolutionStudy the following bar diagram carefully and answer the following questions :
निम्नलिखित आरेख का ध्यानपूर्वक अध्ययन करें और दिए गए प्रश्नों का उत्तर दें:

The ratio of production of LCDs in the year 2011 and 2013 is.
वर्ष 2011 और 2013 में एल. सी. डी. के उत्पादन का अनुपात है
View SolutionStudy the following bar diagram carefully and answer the following questions : निम्नलिखित आरेख का ध्यानपूर्वक अध्ययन करें और दिए गए प्रश्नों का उत्तर दें: The ratio of production of TVs in the years 2009 and 2010 is. वर्ष 2009 और 2010 में टी. वी. के उत्पादन का अनुपात -
View SolutionStudy the following graph which shows income and expenditure of a company over the years and answer the questions. Ratio of total income to total expenditure of the company over the years is. निम्नलिखित चार्ट का अध्ययन कीजिए जिसमें कंपनी की कुछ वर्षों की आय एवं उसके व्यय को दर्शाया गया है और प्रश्नों के उत्तर दीजिए : दिए गए वर्षों में कंपनी की कुल आय और कुल व्यय का अनुपात क्या रहा?
View SolutionStudy the chart carefully and answer the questions. The chart shows production of an item (in tones) during certain years. The production in 2006-07 in comparison to the production in 2002-03 increased by. निम्न आरेख का ध्यानपूर्वक अध्ययन कर दिए गए प्रश्नों के उत्तर दें: आरेख किसी वर्ष के दौरान एक मद का उत्पादन (टनों में) दर्शाता है। वर्ष 2002-03 की तुलना में 2006-07 में उत्पादन में वृद्धि हुई -
View Solutionस्तंभ II में दिए गए आवर्त के साथ स्तंभ I में दिए गए तत्वों के परमाणु क्रमांक का मिलान कीजिए और उपयुक्त चयन को चिह्नित कीजिए।
View Solutionप्रयोगशाला में ओजोन का उत्पादन करने के लिए निम्नलिखित में से किस अभिक्रिया का उपयोग किया जाता है?
View Solutionनीचे दिए गए प्रश्नो में सबसे उचित विकल्प का चयन कीजिये। शिक्षण की प्रकिया के किस आयाम में विषयो का विश्लेषण किया जाता है ?
View Solution
