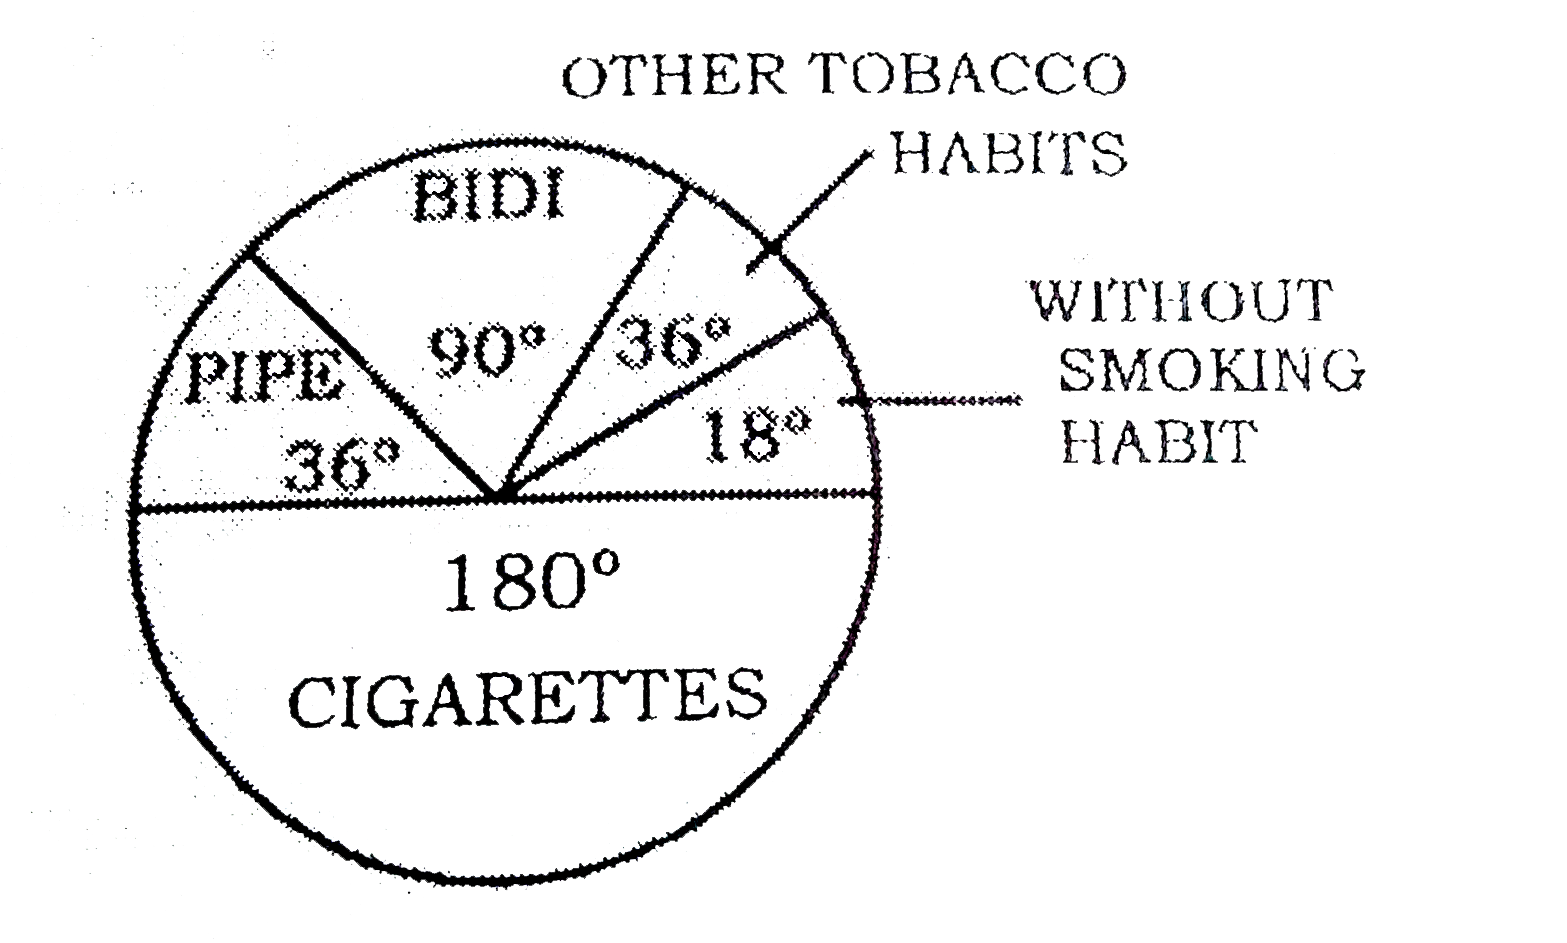
निर्देश: पाई-चार्ट में तम्बाकू का सेवन करने से सम्बन्ध 119060 लोगो के सरवेक्सन से प्राप्त परिणाम को दर्शाया गया है! पाई-चार्ट का अध्यन कीजिये और पर्सेनो के उतर दीजिये?

सिगरेट पिने वाले लोगो की संख्या कितनी है?
53905
59305
59530
11906
Number of people smokin g cigarattes
Topper's Solved these Questions
Similar Questions
सरल करें: 1+11+22+31+45
02:11View SolutionA एक काम को 6 दिनों में तथा B उसी काम को 9 दिनों में कर सकता है दोनों मिलकर उस काम को कितने दिन में पूरा करेंगे ?
01:31View SolutionDetermine the point of symmetry of a regular hexagon.
02:45View SolutionDtermine the images of the following figure about the given line :
02:17View SolutionMatch the following Column A to Column B
 05:41View Solution
Match the following Column A to Column B
 02:10View Solution
Match the following Column A to Column B
 02:17View Solution
The inequation represented by the graph given below is :
02:10View SolutionThe inequation that best describes the graph given below is _________
03:22View SolutionThe inequation that best describes the following graph is _________
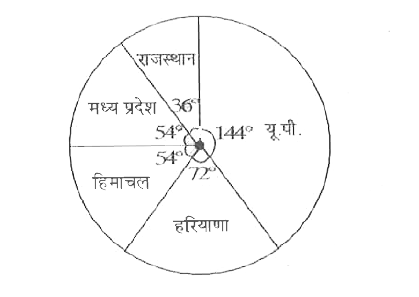
03:22View Solutionचित्र में दिया गया वृत्त चार्ट मई -जून 2013 के दौरान वाहनों का केन्द्र्य सर्कार द्वारा चल्या गये अभियान में कटे हुए चलानो की संख्या को डिग्री (∘ ) में दर्शाता है। इसे ध्यानपूर्वक पढ़िए व निम्न प्रशनो के उत्तर दीजिए।
यदि कुल वाहनों 72 लाख है तो मध्य प्रदेश में कटे चालानों की संख्या राजस्थान के कटे चालानों की संख्या से कितना अधिक है ?
 01:13View Solution
चित्र में दिया गया वृत्त चार्ट मई -जून 2013 के दौरान वाहनों का केन्द्र्य सर्कार द्वारा चल्या गये अभियान में कटे हुए चलानो की संख्या को डिग्री (∘ ) में दर्शाता है। इसे ध्यानपूर्वक पढ़िए व निम्न प्रशनो के उत्तर दीजिए।
यदि कुल वाहनों 72 लाख है तो मध्य प्रदेश में कटे चालानों की संख्या राजस्थान के कटे चालानों की संख्या से कितना अधिक है ?
 01:15View Solution
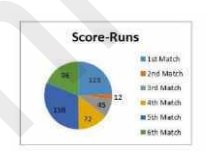
The given pie chart shows runs scored by A in 6 matches.
दिया गया पाई चार्ट A के द्वारा 6 मैचों में बनाए गए रनों को दर्शाता है | In the given pie-chart, what is the increase or decrease in score in match 4 as compared to match 2?
/ इस पाई चार्ट में मैच 2 की तुलना में मैच 4 के स्कोर में कितनी वृद्धि या कमी हुई है ?02:56View SolutionThe given pie-chart, shows the percentage distribution of the expenditure incurred in publishing a book. Study the pie-chart and the answer the question based on it. / दिया गया पाई चार्ट किसी पुस्तक के प्रकाशन में हुए व्ययों के प्रतिशत वितरण को दर्शाता है | इस पाई चार्ट का अध्ययन करें तथा इस पर आधारित प्रश्न का उत्तर दें | In the given pie-chart, by what percentage the Royalty on the book is less than the Printing cost? / दिए गए पाई चार्ट के अनुसार, इस पुस्तक पर रॉयल्टी प्रकाशन की लागत से कितना प्रतिशत कम है ?
02:52View SolutionThe given pie-chart favourite sport of students of a school. दिया गया पाई चार्ट एक विद्यालय के छात्रों के पसंदीदा खेल को दर्शाता है | In the given pie-chart, what is the difference in percentage between liking for football and basketball? इस पाई चार्ट के अनुसार, फुटबॉल तथा बास्केटबॉल पसंद करने के प्रतिशत में क्या अंतर है ?
01:57View SolutionThe pie-chart shows percentage-wise distribution of teachers who teach six different subjects. Study the pie chart and answer the questions
पाई-चार्ट छह अलग-अलग विषयों को पढ़ाने वाले शिक्षकों के प्रतिशत को दर्शाता है। पाई चार्ट का अध्ययन करें और प्रश्नों के उत्तर दें।
Total number of teachers = 1650 शिक्षकों की कुल संख्या - 1650
What is the total number of teachers teaching English, Maths and Physics?
अंग्रेजी, गणित और भौतिकी पढ़ाने वाले शिक्षकों की कुल संख्या क्या है?01:54View Solution

