निर्देश: निचे दिए गए पाई चार्ट में भारत के द्वारा 2014 में 10 देशो में निर्यात किये गए ऑटोमोबाइल आयात किया! निचे गए चार्ट पर विचार करे और निमिन्लिखित पर्सन का उतर है?
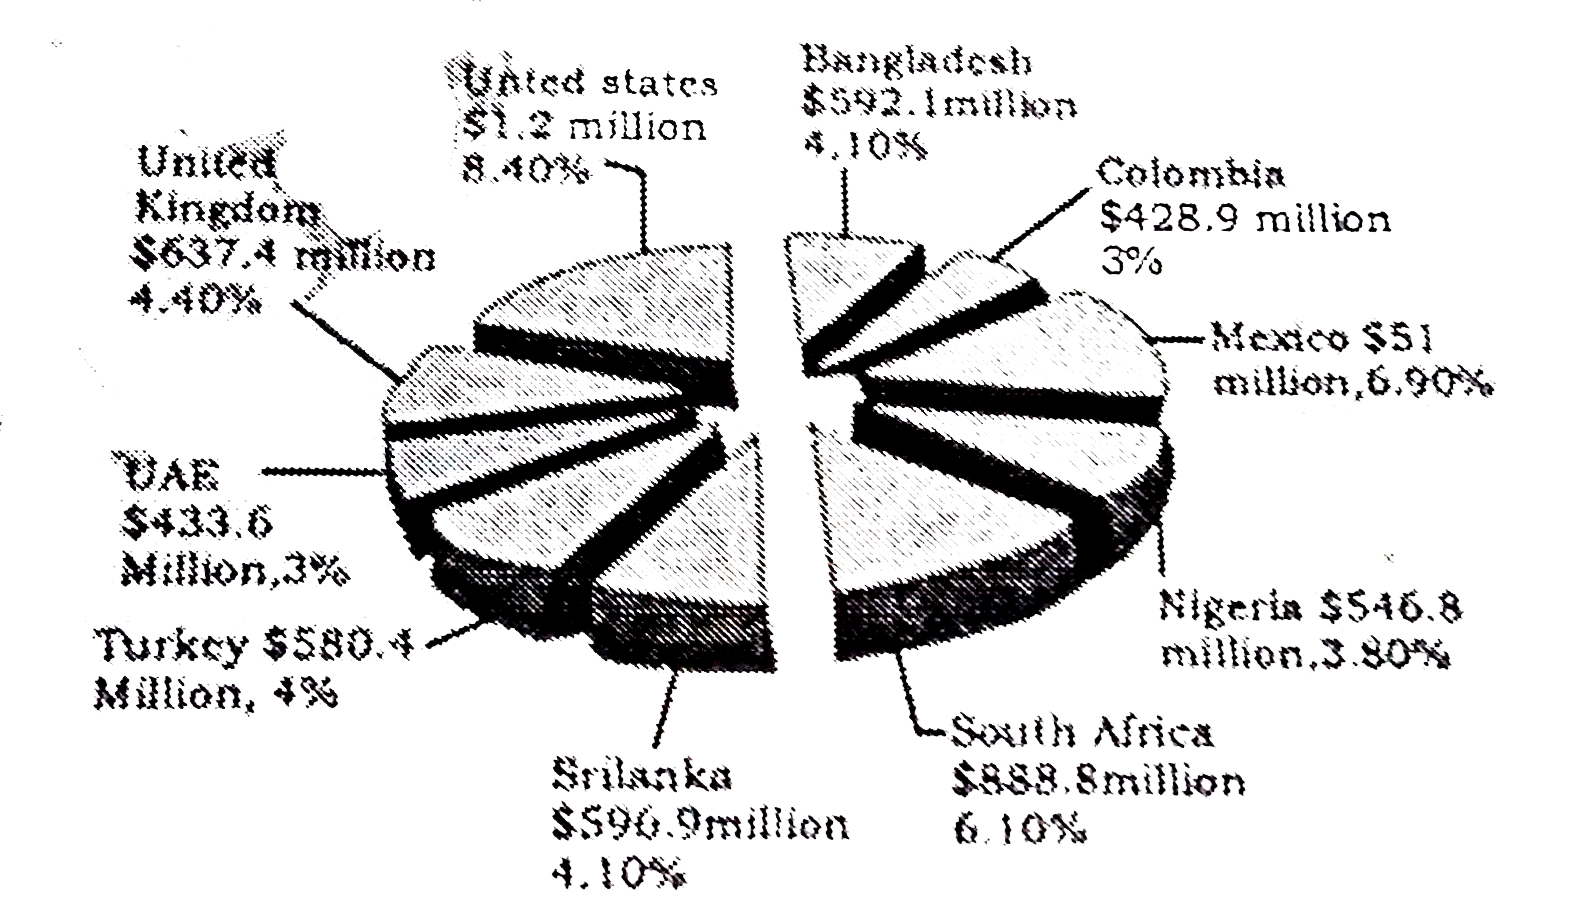
संयुक्त राज्य अमेरिका को निर्यात किया गया ऑटोमोबाइल मोठे तोर पर किन दो देसो के संयुक्त निर्यात के बराबर है?
श्री -तुर्की
श्रीलंका-बांग्लादेश
मैक्सिको-यूएई
यूनाइटेड किंगडम-तुर्की
United kingdon-Turkey
Similar Questions
The given Bar Graph presents Different Type of Vehicles (in lakhs) exported by a company in 2016 and 2017. दिया गया दंड आरेख 2016 और 2017 में एक कंपनी के द्वारा निर्यात किये गए अलग-अलग प्रकार के वाहनों ( लाख में ) को दर्शाता है | The export of which type of vehicle in 2017 is approximately 18.3% more than the export of same type of vehicle in 2016? 2017 में किस प्रकार के वाहन का निर्यात 2016 में इसी वाहन के निर्यात से लगभग 18.3% अधिक है ?
03:01View SolutionThe given pie chart shows the expenditure given in millions on each game. दिया गया पाई चार्ट प्रत्येक खेल पर करोड़ो में दिए गए व्यय को दर्शाता है | In the given pie chart, what is the difference between expenditure on cricket and football ? दिए गए पाई चार्ट में , क्रिकेट और फुटबॉल पर किये गए व्यय के बीच क्या अंतर है ?
01:48View SolutionThe given Bar Graph presents the Export of Tea and Coffee (in million kg) for the years 2012 to 2016. What is the ratio of total export of tea in 2012, 2014 and 2015 to the total export of coffee in 2013 and 2014?
दिया गया दंड आरेख वर्ष 2012 से 2016 के दौरान चाय और कॉफ़ी के निर्यात ( मिलियन किलो ग्राम में ) को दर्शाता है |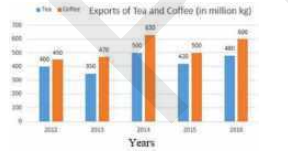
2012, 2014 और 2015 में चाय के कुल निर्यात का 2013 और 2014 में कॉफ़ी के कुल निर्यात के साथ अनुपात ज्ञात करें |02:44View SolutionThe given Bar Graph presents the number of different types of vehicles exported by a company in 2017 and 2018.The average export of vehicles in 2018 is what percent more than the export of vehicle A in 2017?
दिया गया दंड आरेख एक कंपनी के द्वारा 2017 और 2018 में निर्यात किये गए अलग-अलग प्रकार के वाहनों की संख्या को दर्शाता है |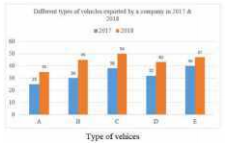
2018 में वाहनों का औसत निर्यात 2017 में वाहन A के निर्यात से कितना प्रतिशत अधिक है ?02:21View SolutionThe given Bar Graph presents the number of different types of vehicles exported by a company in 2017 and 2018.What is the ratio of the total number of vehicles exported in 2017 of types B, C and D to that of vehicles exported in 2018 of the types A, D and E?
दिया गया दंड आरेख एक कंपनी के द्वारा 2017 और 2018 में निर्यात किये गए अलग-अलग प्रकार के वाहनों की संख्या को दर्शाता है |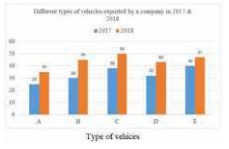
2017 में निर्यात किये गए B, C और D प्रकार के वाहनों की कुल संख्या का 2018 में निर्यात किये गए A, D और E प्रकार के वाहनों की संख्या के साथ अनुपात ज्ञात करें |02:07View SolutionThe given Bar Graph presents the number of different types of vehicles exported by a company in 2017 and 2018.The increase in the exports in 2018 as compared to that in 2017 is closest to 32% in case of vehicles of type:
दिया गया दंड आरेख एक कंपनी के द्वारा 2017 और 2018 में निर्यात किये गए अलग-अलग प्रकार के वाहनों की संख्या को दर्शाता है |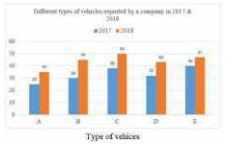
किस प्रकार के वाहनों के मामले में 2017 की तुलना में 2018 में निर्यात में हुई वृद्धि 32% के लगभग है :02:47View Solutionनिम्नलिखित में से कौनसा दिए गए यौगिकों में सक्रियता के सही क्रम का निरूपण करता है?
View Solutionस्तंभ II में दिए गए आवर्त के साथ स्तंभ I में दिए गए तत्वों के परमाणु क्रमांक का मिलान कीजिए और उपयुक्त चयन को चिह्नित कीजिए।
View Solution

