The given Bar Graph presents the Export of Tea and Coffee (in million kg) for the years 2012 to 2016. What is the ratio of total export of tea in 2012, 2014 and 2015 to the total export of coffee in 2013 and 2014?
दिया गया दंड आरेख वर्ष 2012 से 2016 के दौरान चाय और कॉफ़ी के निर्यात ( मिलियन किलो ग्राम में ) को दर्शाता है |
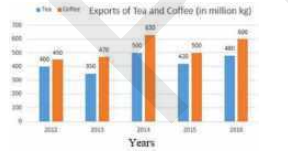
2012, 2014 और 2015 में चाय के कुल निर्यात का 2013 और 2014 में कॉफ़ी के कुल निर्यात के साथ अनुपात ज्ञात करें |
10:9
6:5
9:10
5:6
Step by step video & image solution for The given Bar Graph presents the Export of Tea and Coffee (in million kg) for the years 2012 to 2016. What is the ratio of total export of tea in 2012, 2014 and 2015 to the total export of coffee in 2013 and 2014? दिया गया दंड आरेख वर्ष 2012 से 2016 के दौरान चाय और कॉफ़ी के निर्यात ( मिलियन किलो ग्राम में ) को दर्शाता है | 2012, 2014 और 2015 में चाय के कुल निर्यात का 2013 और 2014 में कॉफ़ी के कुल निर्यात के साथ अनुपात ज्ञात करें | by Maths experts to help you in doubts & scoring excellent marks in Class 14 exams.
Updated on:21/07/2023Topper's Solved these Questions
Similar Questions
The graphs of the equations 3x+y-5=0 and 2x-y-5=0 intersect at the point P(α,β). What is the value of (3α+β) ?
समीकरण 3x+y-5=0 तथा 2x-y-5=0 के आरेख एक बिंदु P(α,β) पर एक-दूसरे को काटते है (3α+β) का मान क्या है ?
View SolutionAfter giving two successive discounts, each of x%, on the marked price of an article, total discount is Rs. 259.20. If the marked price of the article is Rs. 720, then the value of x is :
View SolutionThe bar graph shows the exports of Cars of Type A and B (in Rs. million).
दिए गए दंड आरेख में टाइप A और B कारो के निर्यात को दर्शाया गया है (मिलियन रु. में)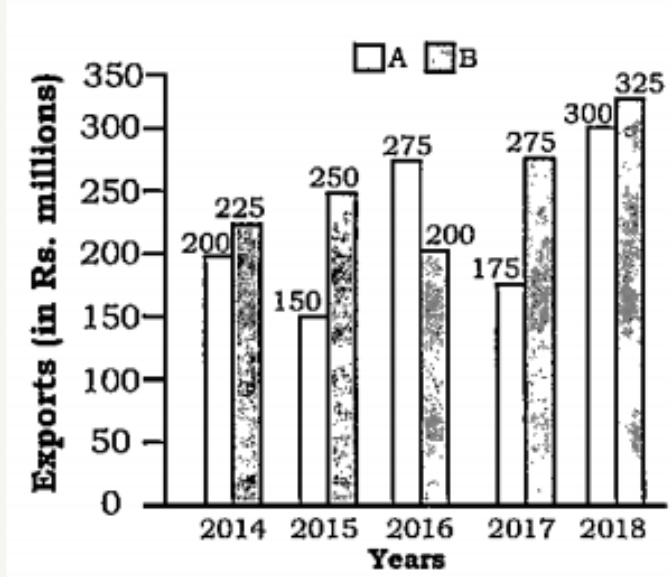 What is the ratio of the exports of cars of Type A in 2014 and 2018 to the total exports of cars of type B in 2015 and 2016?
2014 और 2018 में टाइप A कारो के कुल निर्यात और 2015 और 2016 में टाइप B कारो के कुल निर्यात का अनुपात क्या हे?
View SolutionThe given bar graph shows the imports and exports (in Rs crores) of steel by a country from 2013 to 2017.
दिया गया दंड आरेख एक देश के द्वारा 2013 से 2017 तक इस्पात के आयात और निर्यात ( करोड़ रुपये में) को दर्शाता है |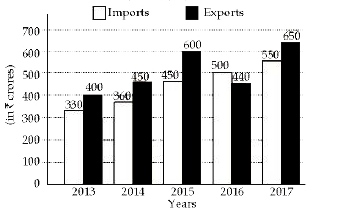 What is the ratio of the total imports in 2015 and 2017 to the total exports in 2013 and 2016 ?
2015 तथा 2017 में किये गए कुल आयात का 2013 तथा 2016 में किये गए कुल निर्यात के साथ अनुपात ज्ञात करें|
View SolutionThe given Bar Graph presents the Imports and Exports of an item (in tonnes) manufactured by a company for the five financial years, 2013-2014 to 2017-2018. दिया गया दंड आरेख पांच वित्तीय वर्षो अर्थत 2013-2014 से 2017-2018 तक एक कंपनी के द्वारा निर्मित किसी वस्तु के आयात और निर्यात ( टन में ) को दर्शाता है | What is the ratio of total Imports to total Exports during 2014-2015,2015-2016 and 2016-2017? 2014-2015, 2015-2016 और 2016-2017 के दौरान कुल आयात तथा कुल निर्यात के बीच अनुपात ज्ञात करें |
View SolutionThe given Bar Graph presents the data of annual income (A) and annual expenditure (B) of an IT officer in a multi-national company during the years 2012 to 2016. दिया गया दंड आरेख वर्ष 2012 से 2016 के दौरान किसी बहुराष्ट्रीय कंपनी में कार्यरत एक आईटी अधिकारी अधिकारी की वार्षिक आय ( A ) और वार्षिक व्यय (B) के आंकड़ों को दर्शाता है | What is the what is the percentage of his total savings with reference to his total income for the period 2012-15? 2012 से 2015 की अवधि में उसकी कुल आय के संदर्भ में उसकी कुल बचत का प्रतिशत कितना है ?
View SolutionThe given Bar Graph presents the data of annual income (A) and annual expenditure (B) of an IT officer in a multi-national company during the years 2012 to 2016. दिया गया दंड आरेख वर्ष 2012 से 2016 के दौरान किसी बहुराष्ट्रीय कंपनी में कार्यरत एक आईटी अधिकारी अधिकारी की वार्षिक आय ( A ) और वार्षिक व्यय (B) के आंकड़ों को दर्शाता है | What is the ratio between the ratios of savings to expenditure, respectively for the periods 2012-13 and 2015-16? बचत और व्यय के अनुपात के बीच क्रमशः वर्ष 2012-13 और 2015-16 के लिए अनुपात ज्ञात करें |
View SolutionThe given Bar Graph presents the Export of Tea and Coffee (in million kg) for the years 2012 to 2016.
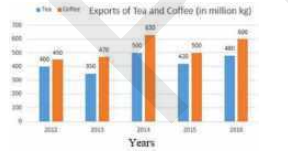
Total export of coffee is approximately what percent more than the total export of tea during the five years?
View SolutionThe given Bar Graph presents the Export of Tea and Coffee (in million kg) for the years 2012 to 2016.
दिया गया दंड आरेख वर्ष 2012 से 2016 के दौरान चाय और कॉफ़ी के निर्यात ( मिलियन किलो ग्राम में ) को दर्शाता है |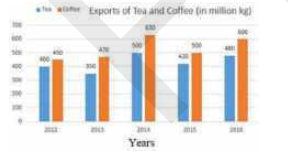
The number of years, in each of which the export of coffee is more than 20% as compared to the export of tea in that year is:
ऐसे कितने वर्ष हैं जिनमें से प्रत्येक में कॉफ़ी का निर्यात इस वर्ष में चाय के निर्यात की तुलना में 20% अधिक है ?
View SolutionThe Pie-chart given here shows the percentage of candidates selected in an examination from 2012 to 2016.
यहाँ दिया गया वृत्त आरेख 2012 से 2016 तक किसी परीक्षा में चयनित उम्मीदवारों के प्रतिशत को दर्शाता है |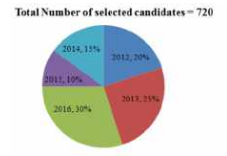 What is the total number of selected candidates for the year 2012 and 2014 taken together ?
वर्ष 2012 तथा 2014 को मिलाकर, चयनित उम्मीदवारों की कुल संख्या है :
View SolutionThe given Bar Graph presents the Imports and Exports of an items (in tonnes) manufactured by a company for the five financial Years, 2013-2014 to 2017-2018. दिया गया दंड आरेख (बार ग्राफ) 5 वित्त वर्षों, 2013-2014 से 2011-2018, के दौरान किसी कंपनी द्वारा निर्मित किसी वस्तु के आयात और निर्यात (टन में) को दर्शाता है| What is the ratio of total Exports to total Imports during the five financial Years? 5 वित्त वर्षों के दौरान कुल निर्यात और कुल आयात का अनुपात क्या है?
View SolutionThe given Bar Graph presents the Imports and Exports of an item (in tonnes) manufactured by a company for the five financial years, 2013-2014 to 2017-2018. दिया गया दंड आरेख (बार ग्राफ) 5 वित्त वर्षों, 2013-2014 से 2011-2018 के दौरान एक कंपनी द्वारा निर्मित किसी वस्तु (टन में) के आयात और निर्यात को दर्शाता है | What is the ratio of total Imports to total Exports during the five financial years? पांचों वित्त वर्षों के दौरान कुल आयात और कुल निर्यात का अनुपात क्या है?
View SolutionThe given Bar Graph present the Imports and Exports of an item (in tonnes) manufactured by a company for the five financial years, 2013-2014 to 2017-2018. दिया गया दंड आरेख (बार ग्राफ) पांच वित्त वर्षों, 2013-2014 से 2017-2018, के दौरान किसी कंपनी दवारा निर्यात किसी वस्तु (टन में] के आयात और निर्यात को दर्शाता है| What is the ratio of total Imports to total Exports during 2013-2014, 2015-2016 and 2017-2018? 2013-2014, 2015-2016 3X 2017-2018 के दौरान कुल आयात का कुल निर्यात से क्या अनुपात है?
View SolutionThe given Bar Graph present the Imports and Exports of an item (in tonnes) manufactured by a company for the five financial years, 2013-2014 to 2017-2018. दिया गया दंड आरेख (बार ग्राफ) पांच वित्त वर्षों, 2013-2014 से 2017-2018, के दौरान किसी कंपनी दवारा निर्यात किसी वस्तु (टन में] के आयात और निर्यात को दर्शाता है| What is the average of total Import and Export (in tonnes) during five financial years? पांच वित्त वर्षो के दौरान कुल आयात और निर्यात (टन में) का औसत क्या है?
View SolutionThe given Bar Graph present the Imports and Exports of an item (in tonnes) manufactured by a company for the five financial years, 2013-2014 to 2017-2018. दिया गया दंड आरेख (बार ग्राफ) पांच वित्त वर्षों, 2013-2014 से 2017-2018, के दौरान किसी कंपनी दवारा निर्यात किसी वस्तु (टन में] के आयात और निर्यात को दर्शाता है| In which financial year the total of Exports and Imports is the lowest? किस वित्त वर्ष में निर्यात और आयात का कुल जोड़ सबसे कम है?
View Solution
