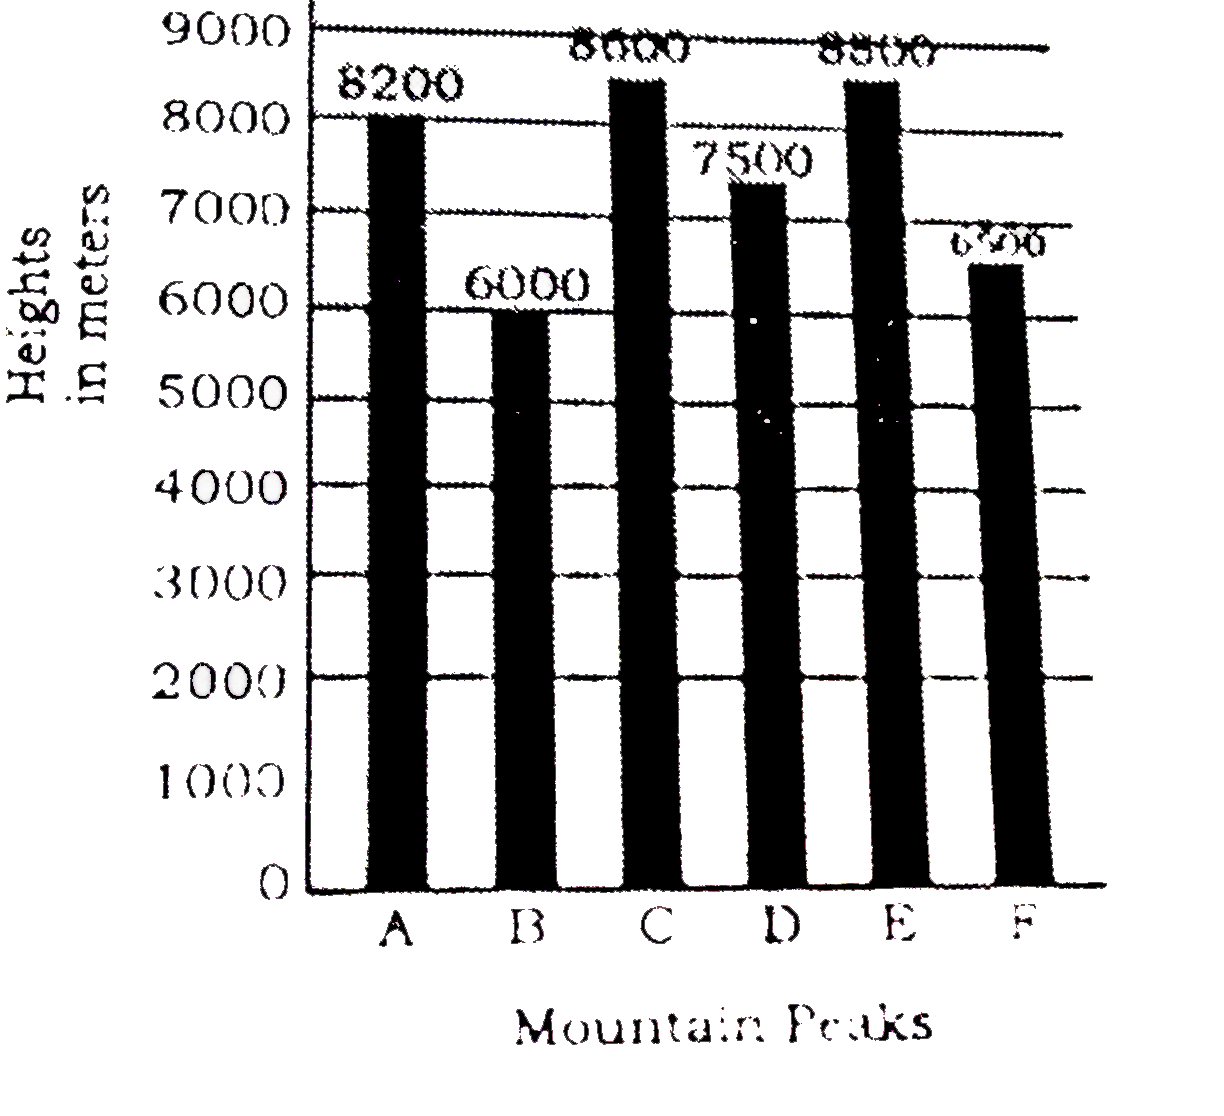
बार ग्राफ का अध्ययन कीजिए और निम्नलिखित प्रश्नों के उत्तर दीजिए। ग्राफ में 6 पर्वत शिखरों की उँचाई दर्शायी गयी है।

ग्राफ में 6 पर्वत शिखरों की उँचाई दर्शायी गयी है। सभी शिखरों की औसत उँचाई (मीटर में ) ज्ञात कीजिए ?
7601.5
7600
7599.5
7610
Avg. (8800+8600+8200+7500+6500+6000)6=7600
Similar Questions
The graph shows the monthly expenditure of a company (unit = 10 lakhs). Study the graph and answer the questions : The ratio between transport and employee salary on monthly basis is ग्राफ में किसी कम्पनी के मासिक व्यय को दर्शाया गया है। ग्राफ का अध्ययन कीजिए और निम्नलिखित प्रश्नों के उत्तर दीजिए। मासिक आधार पर परिवहन और कर्मचारियों के वेतन के बीच अनुपात कितना है ?
01:35View SolutionStudy the Bar diagram carefully and answer the question. The Bar diagram shows the trends of foreign direct investment (FDI) into India from all over the World Gin Rs. crores) The sum of FDI of 1992 and 1993 is बार ग्राफ में समस्त विश्व से भारत में विदेशी प्रत्यक्ष निवेश (एफ डी आई) की प्रवृत्ति को दर्शाया गया है। बार ग्राफ का ध्यानपूर्वक अध्ययन कीजिए और प्रश्नों का उत्तर दीजिए। वर्ष 1992 और 1999 में विदेशी प्रत्यक्ष निवेश का कुल योग कितना है ?
01:57View SolutionStudy the Bar diagram carefully and answer the question. The Bar diagram shows the trends of foreign direct investment (FDI) into India from all over the World Gin Rs. crores) The year which exhibited the 2nd highest growth percentage in FDI in India over the period shown is बार ग्राफ में समस्त विश्व से भारत में विदेशी प्रत्यक्ष निवेश (एफ डी आई) की प्रवृत्ति को दर्शाया गया है। बार ग्राफ का ध्यानपूर्वक अध्ययन कीजिए और प्रश्नों का उत्तर दीजिए। दर्शायी गयी अवधि में भारत में किस वर्ष सर्वाधिक विदेशी प्रत्यक्ष निवेश किया गया ?
01:35View SolutionStudy the Bar diagram carefully and answer the question. The Bar diagram shows the trends of foreign direct investment (FDI) into India from all over the World Gin Rs. crores) The ratio of investment in 1997 to the average investment बार ग्राफ में समस्त विश्व से भारत में विदेशी प्रत्यक्ष निवेश (एफ डी आई) की प्रवृत्ति को दर्शाया गया है। बार ग्राफ का ध्यानपूर्वक अध्ययन कीजिए और प्रश्नों का उत्तर दीजिए। वर्ष 1992 और 1997 में किए गए निवेश का अनुपात क्या है।
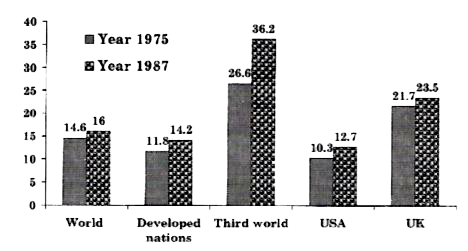
02:28View SolutionStudy the following Bar graph and answer the question. The Bar graph gives the annual rates of inflation in percentages for 1975 and 1987:
निम्नलिखित बार-ग्राफ का अध्ययन करें और प्रश्नों का उत्तर दें। बार-ग्राफ में वर्ष 1975 से 1987 तक प्रतिशत में मुद्रा स्फीति की वार्षिक दर प्रतिशत में दी गई है :

The change in rate of inflation was least in which of the following.
मुद्रास्फीति के परिवर्तन की निम्नतम दर इन में से कहाँ थी?04:15View Solutionनिम्नलिखित में से कौन सा ग्राफ बॉयल के नियम का प्रतिनिधित्व करता है?
View Solutionसीरियम (Z = 58) लैंथेनॉइडों का एक सदस्य है। निम्नलिखित में से सीरियम के बारे में गलत कथनों की पहचान कीजिए।
View Solutionनिम्नलिखित प्रश्नों के उचित विकल्प चुनकर उत्तर दीजिए-
निम्नलिखित में से मिश्र वाक्य का चयन कीजिए-View Solution

