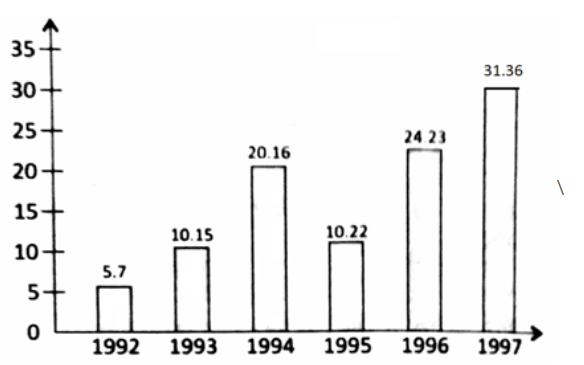
Study the Bar diagram carefully and answer the question. The Bar diagram shows the trends of foreign direct investment (FDI) into India from all over the World Gin Rs. crores)
The ratio of investment in 1997 to the average investment
बार ग्राफ में समस्त विश्व से भारत में विदेशी प्रत्यक्ष निवेश (एफ डी आई) की प्रवृत्ति को दर्शाया गया है। बार ग्राफ का ध्यानपूर्वक अध्ययन कीजिए और प्रश्नों का उत्तर दीजिए।
वर्ष 1992 और 1997 में किए गए निवेश का अनुपात क्या है।
2:1
1:2
1:1
3:1
The correct Answer is:A
31.6:5.7+10.15+20.16+10.22+24.23+31.366
=31.6:16:97≈2:1
Similar Questions
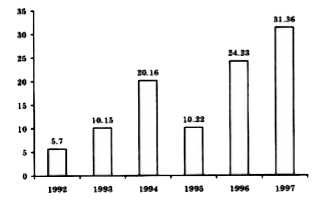
Study the Bar diagram carefully and answer the question. The Bar diagram shows the trends of foreign direct investment (FDI) into India from all over the World Gin Rs. crores)
The sum of FDI of 1992 and 1993 is
बार ग्राफ में समस्त विश्व से भारत में विदेशी प्रत्यक्ष निवेश (एफ डी आई) की प्रवृत्ति को दर्शाया गया है। बार ग्राफ का ध्यानपूर्वक अध्ययन कीजिए और प्रश्नों का उत्तर दीजिए।
वर्ष 1992 और 1999 में विदेशी प्रत्यक्ष निवेश का कुल योग कितना है ?
View SolutionStudy the Bar diagram carefully and answer the question. The Bar diagram shows the trends of foreign direct investment (FDI) into India from all over the World Gin Rs. crores)
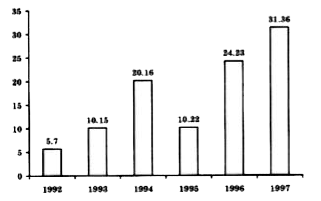
The year which exhibited the 2nd highest growth percentage in FDI in India over the period shown is
बार ग्राफ में समस्त विश्व से भारत में विदेशी प्रत्यक्ष निवेश (एफ डी आई) की प्रवृत्ति को दर्शाया गया है। बार ग्राफ का ध्यानपूर्वक अध्ययन कीजिए और प्रश्नों का उत्तर दीजिए।
दर्शायी गयी अवधि में भारत में किस वर्ष सर्वाधिक विदेशी प्रत्यक्ष निवेश किया गया ?
View Solution
Knowledge Check
Study the bar diagram and answer the questions.
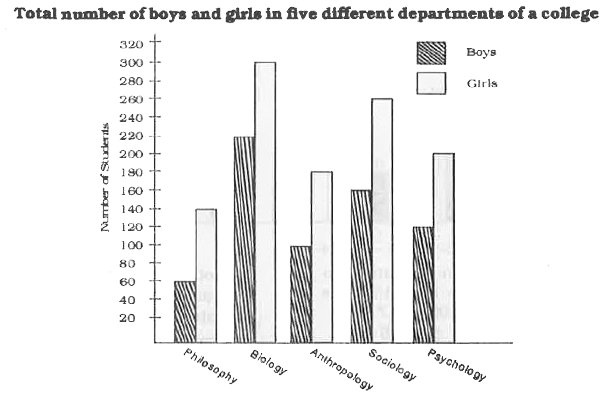
The average number of boys from all the departments together isA123B132C134D142Study the bar diagram and answer the questions.
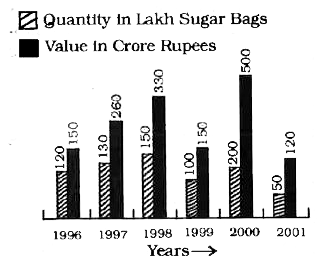
The approximate percentage incresase in value from 1997 to 1998 wasA26.9%B27.8%C26.5%D27.3%Study the following bar diagram carefully and answer the four questions.
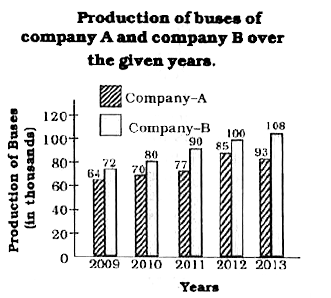
The average production (in thousand) of the company B over the years 2009, 2011, 2012 isA87.33B80.67C90.33D84
Study the following bar-diagram carefully and answer the questions.
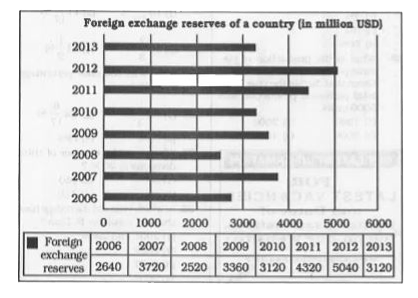
What was the percentage increase in the foreign reserve in 2012 over 2008?
View SolutionStudy the following bar-graph carefully and answer the question:
The average export of pearls for the given period (in crores Rs) is
View SolutionStudy the following bar-diagram carefully and answer the questions.
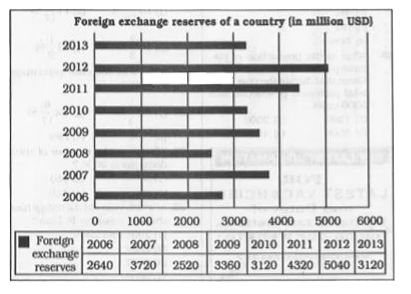
The foreign exchange reserve in 2012 was how many times that in 2009?
View SolutionThe government has decided to increase the foreign direct investment (FDI) limit in private bank from the existing 74% to
View SolutionDirection : Study the following bar diagram carefully and answer the four questions.
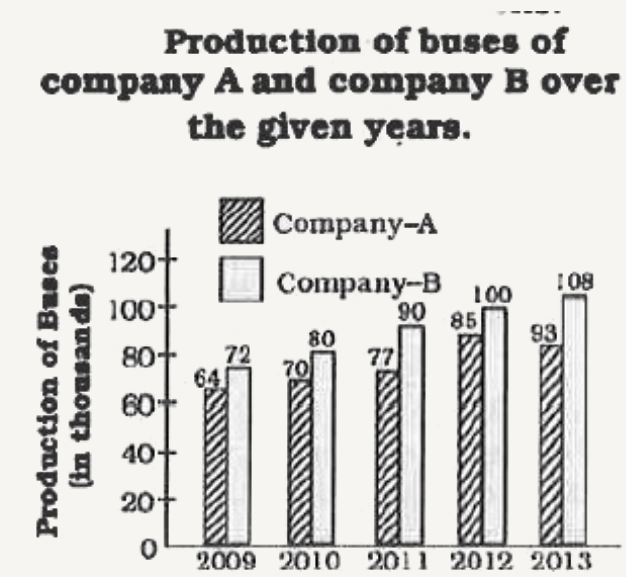
The average production (in thousand) of company A over the years 2010, 2011, 2012, 2013 is
View Solution