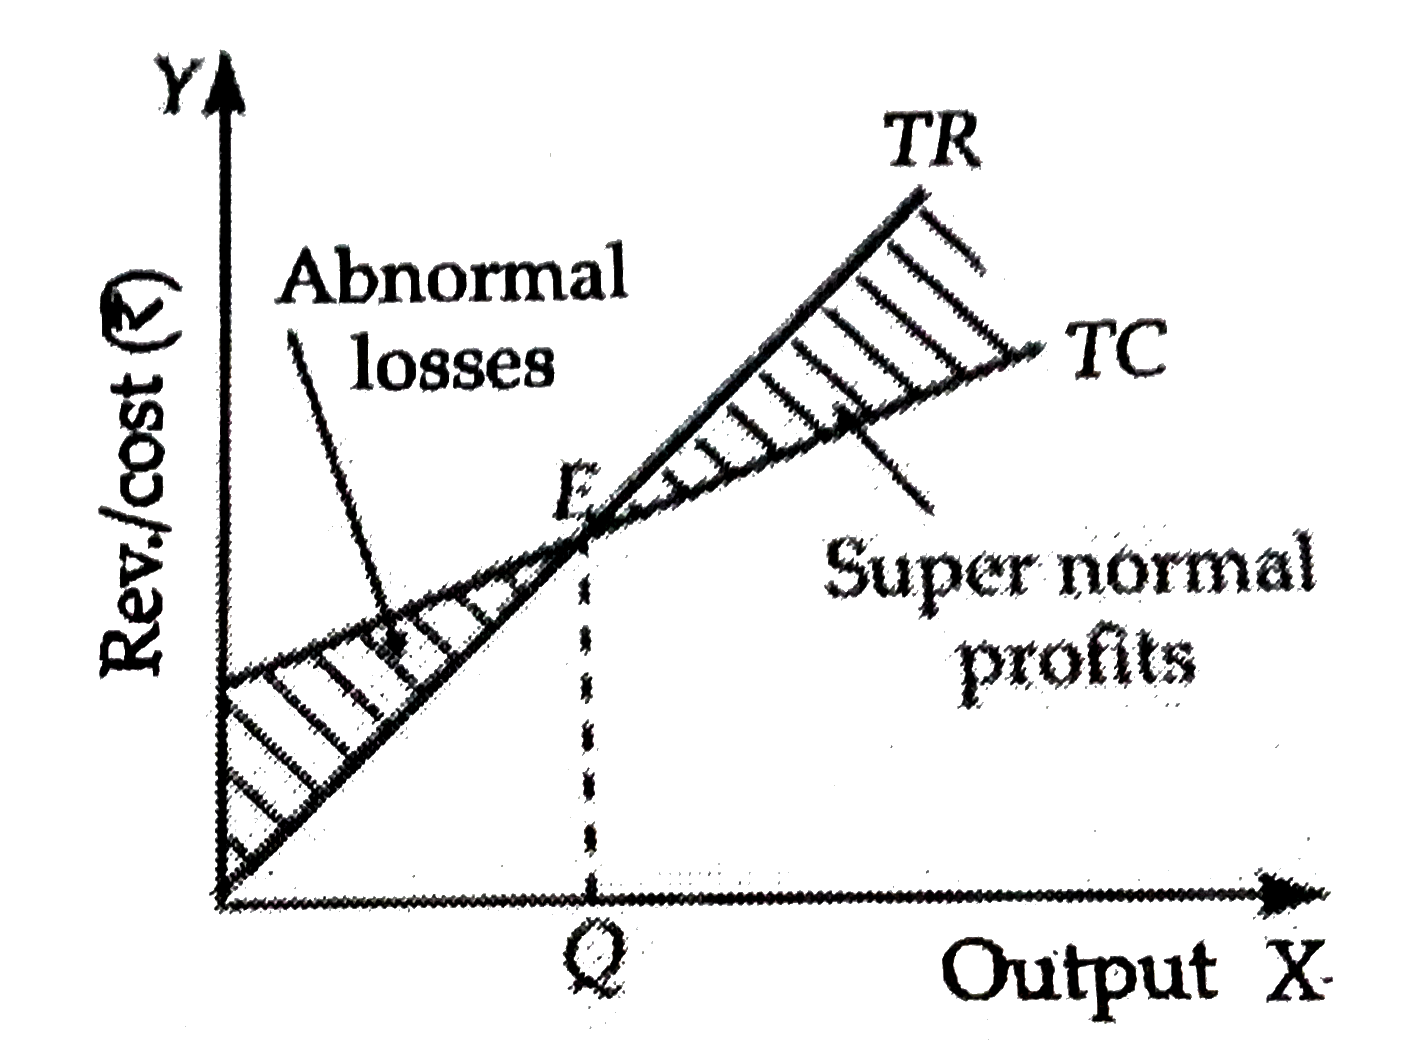
Break-even point in the following diagram is represented by :
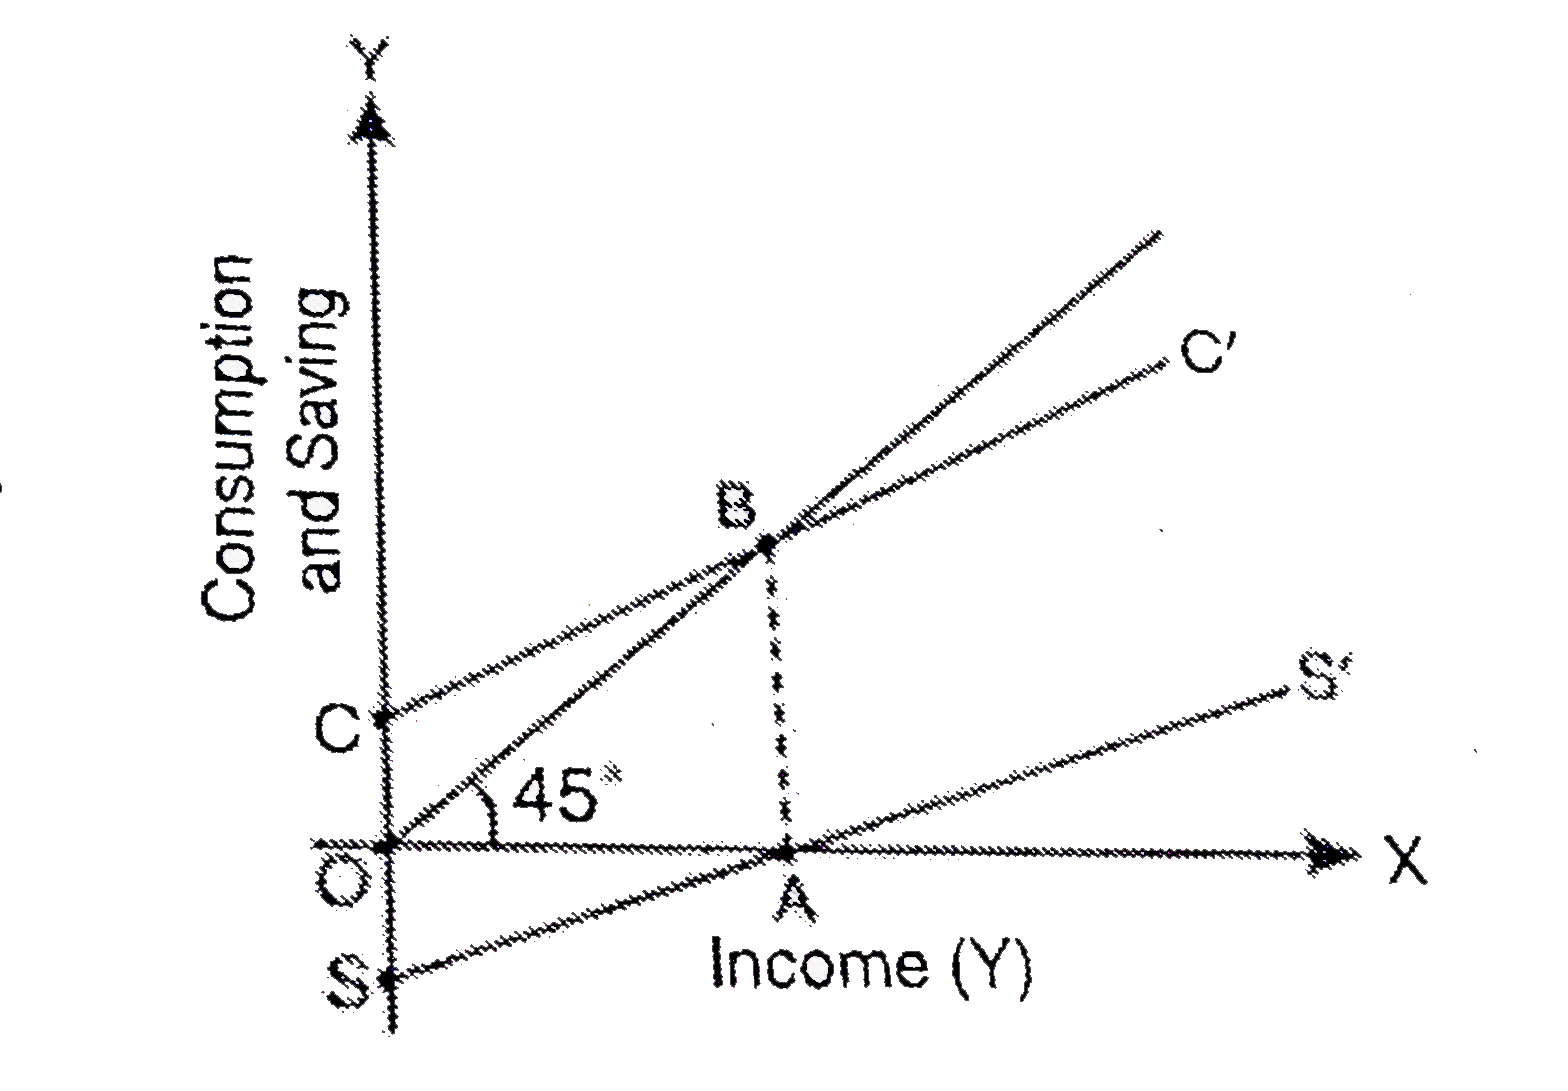
A
Point B
B
Point A
C
Both (a) and (b)
D
Neither (a) nor (b)
Text Solution
The correct Answer is:C
|
Topper's Solved these Questions
- AGGREGATE DEMAND AND RELATED CONCEPTS BOOK - SANDEEP GARGCHAPTER - AGGREGATE DEMAND AND RELATED CONCEPTS EXERCISE - VERY SHORT ANSWER TYPE QUESTIONS
34 Videos
- AGGREGATE DEMAND AND RELATED CONCEPTS BOOK - SANDEEP GARGCHAPTER - AGGREGATE DEMAND AND RELATED CONCEPTS EXERCISE - SHORT ANSWER TYPE QUESTIONS
23 Videos
- AGGREGATE DEMAND AND RELATED CONCEPTS BOOK - SANDEEP GARGCHAPTER - AGGREGATE DEMAND AND RELATED CONCEPTS EXERCISE - GUIDELINES TO NCERT QUESTIONS
2 Videos
- FOREIGN EXCHANGE RATE BOOK - SANDEEP GARGCHAPTER - FOREIGN EXCHANGE RATE EXERCISE - REVISION EXERCISE
12 Videos
- BALANCE OF PAYMENTSBOOK - SANDEEP GARGCHAPTER - BALANCE OF PAYMENTSEXERCISE - LONG ANSWER TYPE QUESTIONS
6 Videos
Similar Questions
Knowledge Check
The following diagram represents:

a) Adaptive radiation
b) Divergent evolution
c) Convergent evolution
d) Both (a) and (b)AAdaptive radiationBDivergent evolutionCConvergent ecolutionDBoth (a) and (b)What does the following diagram represents ?
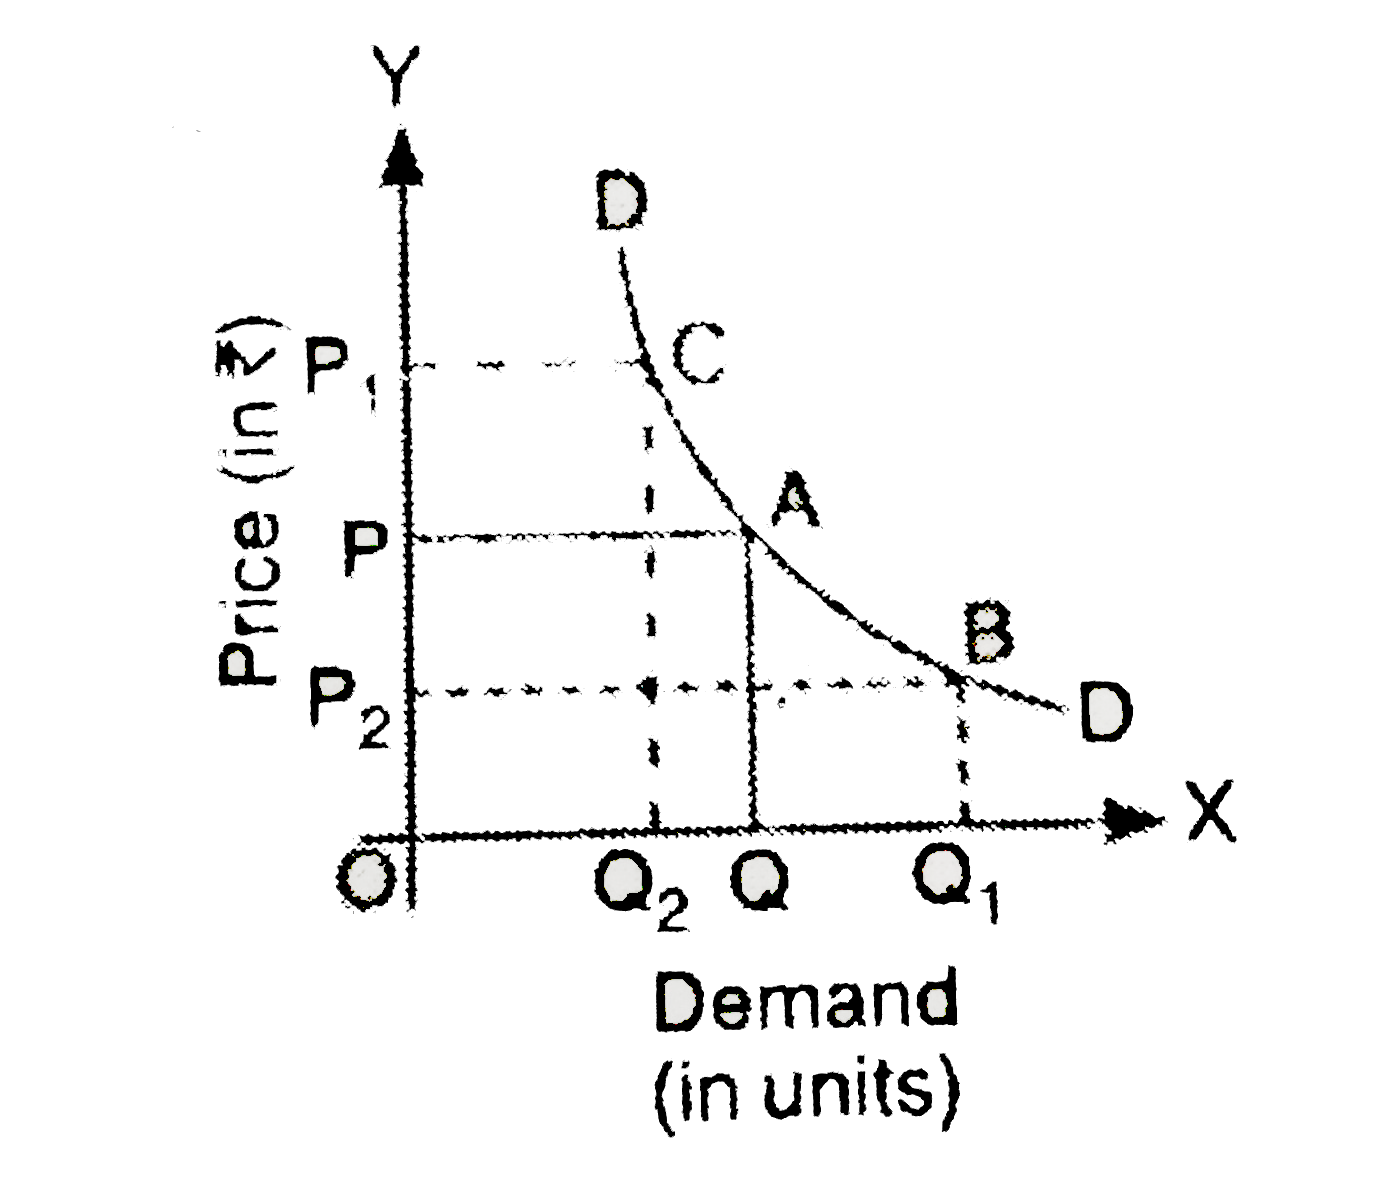 AChange in DemandBChange in Quantity DemandedCBoth (a) and (b)DNeither (a) or (b)
The following diagram represents the situation of:
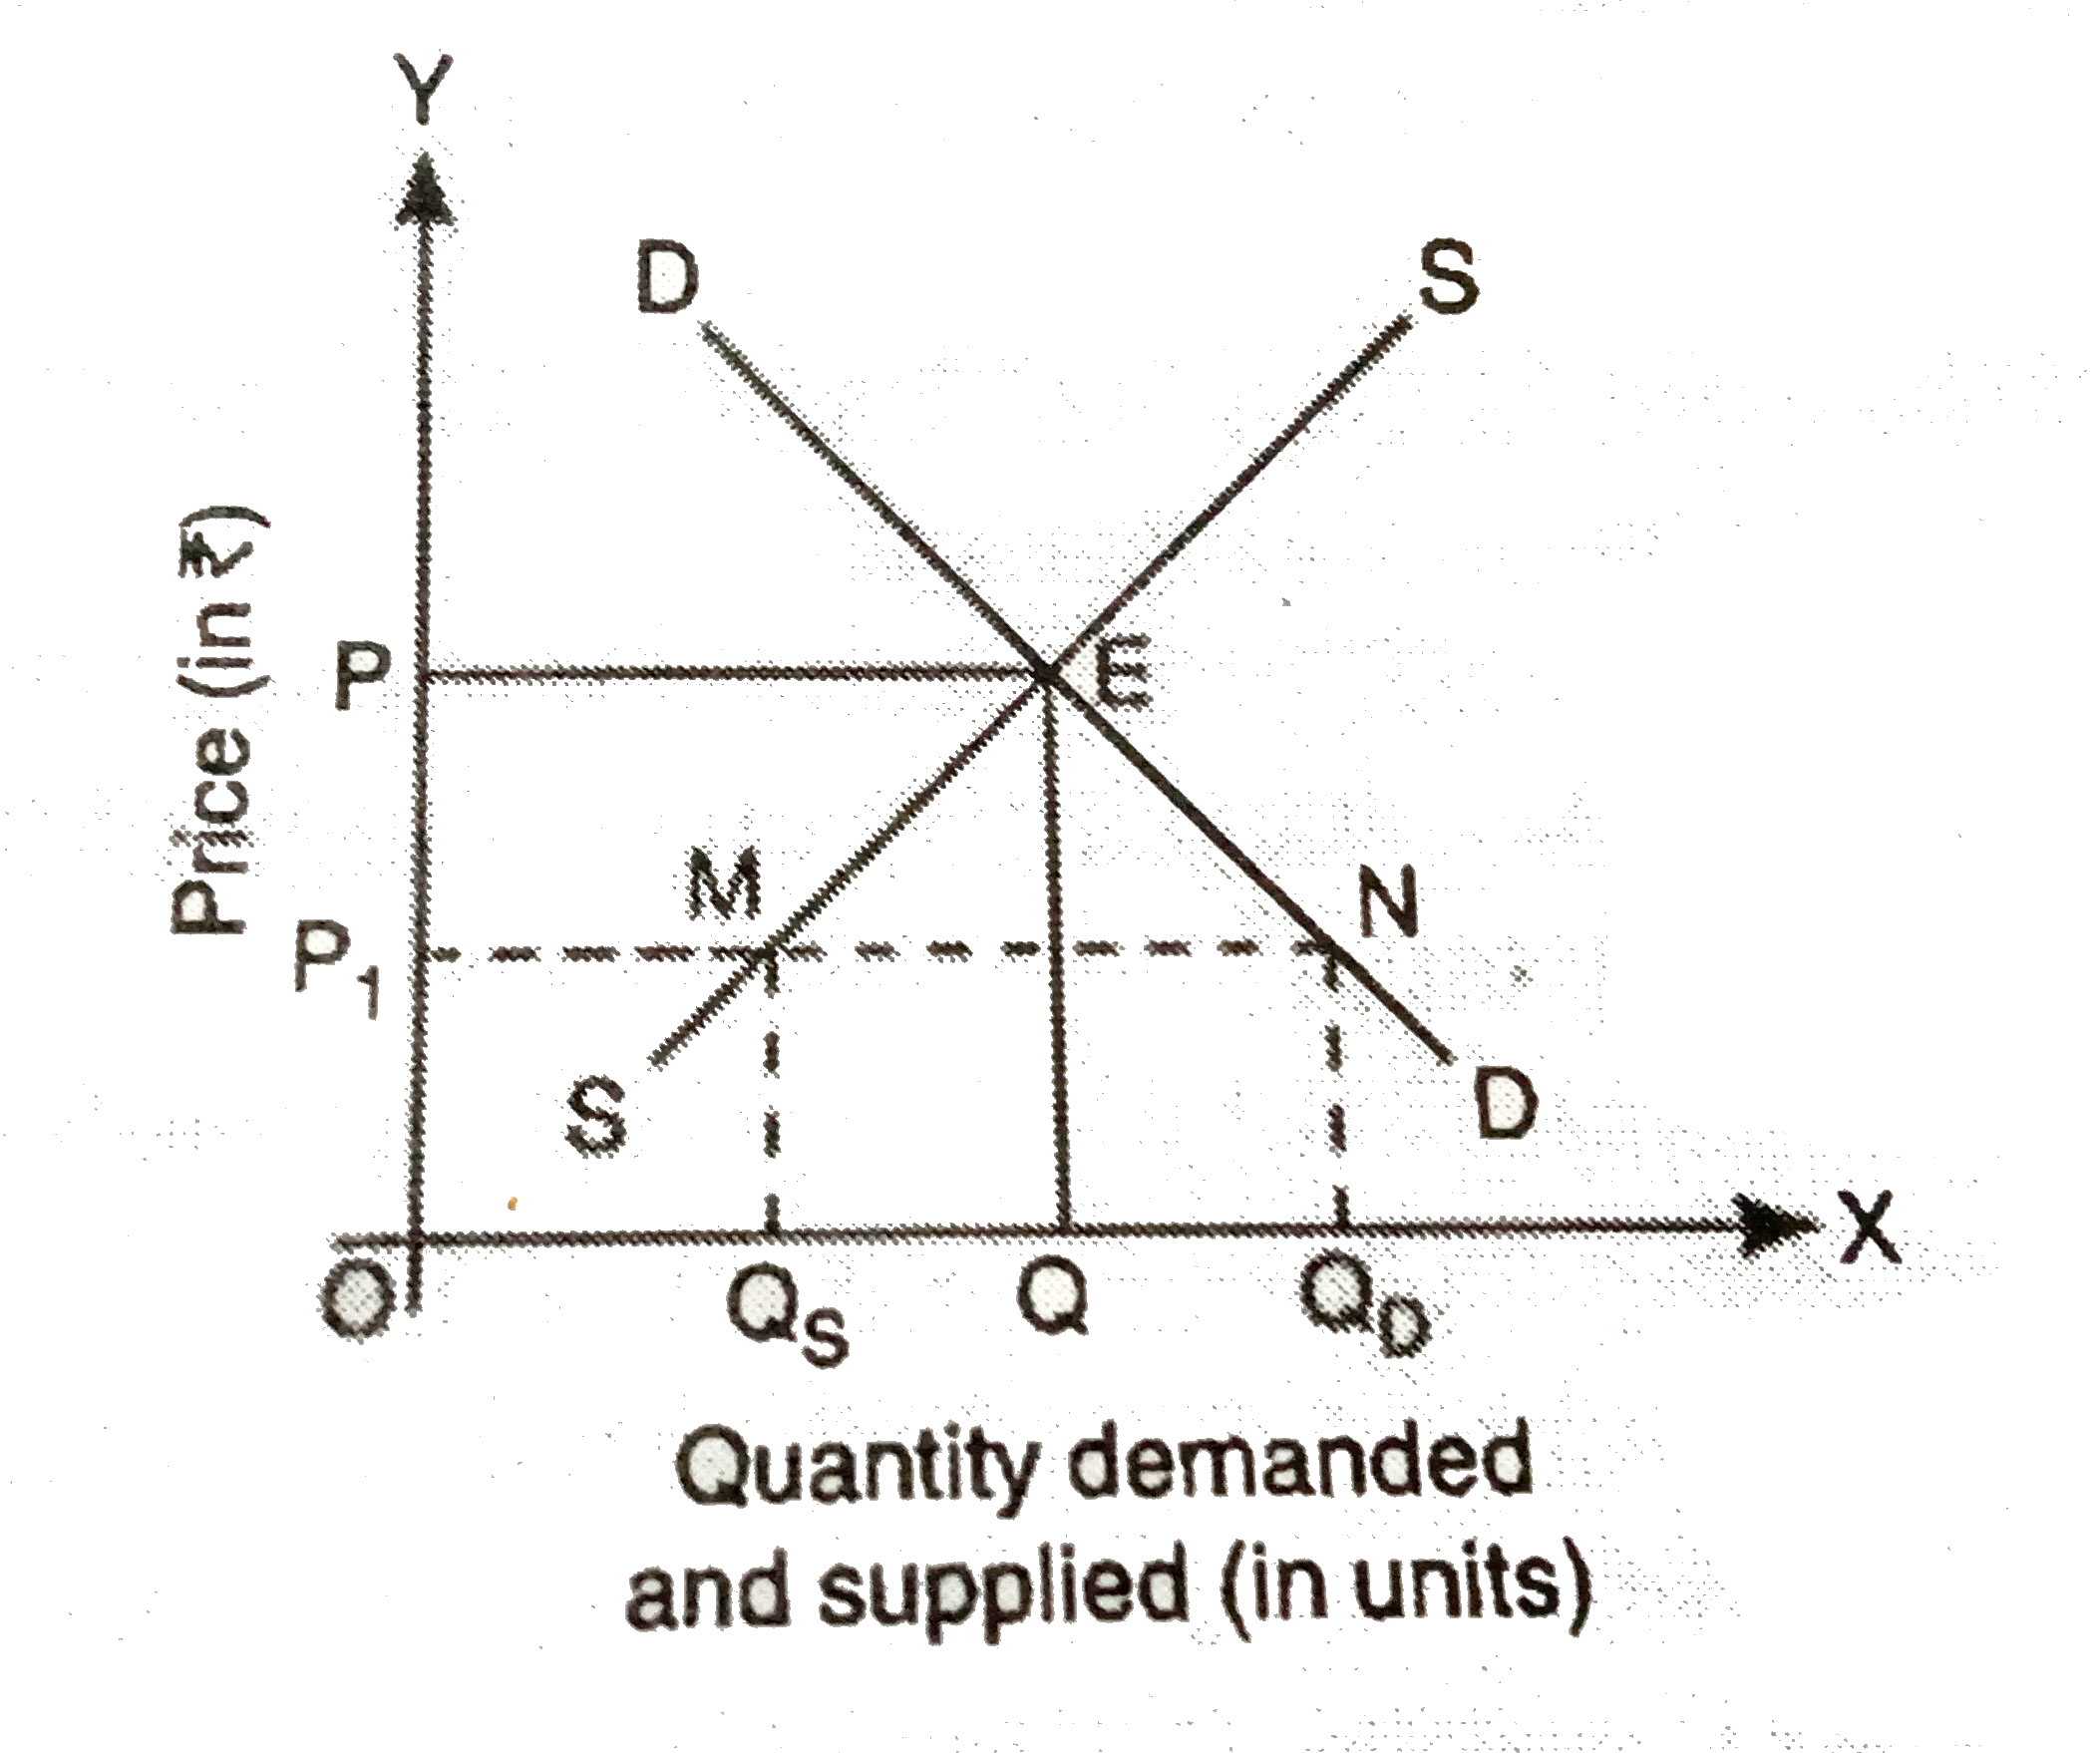 APrice FloorBPrice CeilingCEither (a) or (b)DNeither (a) nor (b)

