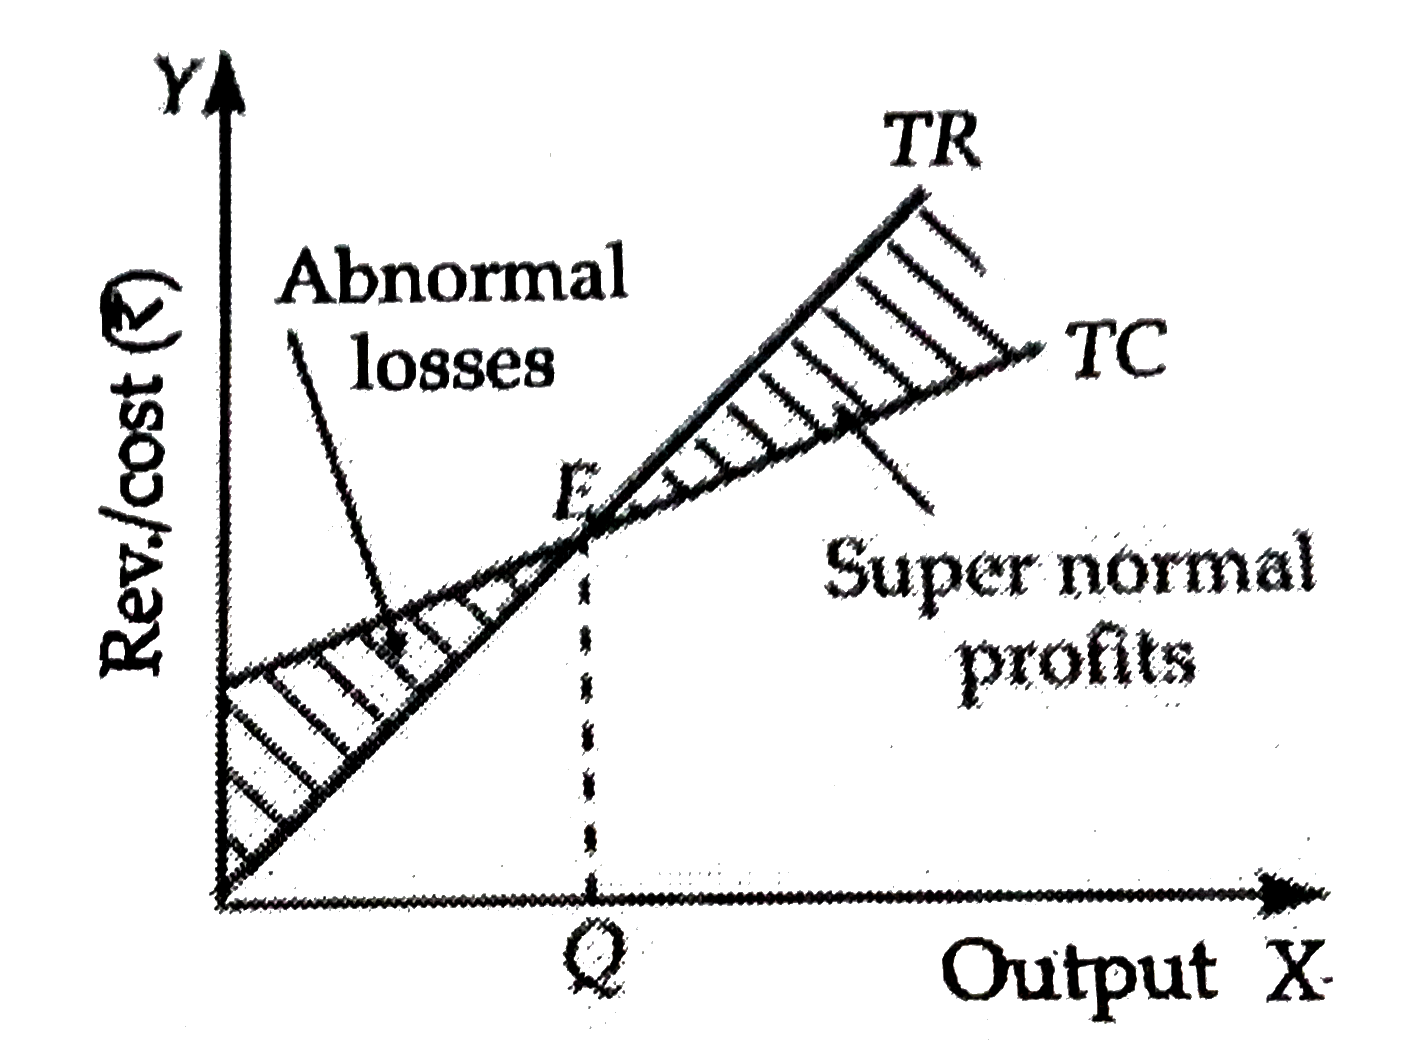
Identify break-even point from the following diagram :
Text Solution
Break-even point refers to the situation in which a firm is able to recover all its costs. In other words it is a situation of normal profits ( A situation of No Profit - No Loss ). In the above figure point 'E' refers to Break-even point. If a firm operates to the left of point 'E' it is enjoying super-normal profits (TR gt TC).
(Also break-even point can be determined from equality between AR and AC. Refer to section 8.3 specific analysis : (1) Normal profits)
|
Topper's Solved these Questions
- PRODUCER'S EQUILIBRIUMBOOK - RADHA BHUGANACHAPTER - PRODUCER'S EQUILIBRIUMEXERCISE - Value Based Questions
2 Videos
- PRODUCER'S EQUILIBRIUMBOOK - RADHA BHUGANACHAPTER - PRODUCER'S EQUILIBRIUMEXERCISE - Guidelines to NCERT Questions
7 Videos
- PRODUCER'S EQUILIBRIUMBOOK - RADHA BHUGANACHAPTER - PRODUCER'S EQUILIBRIUMEXERCISE - CONCEPTUAL QUESTIONS
1 Videos
- PRODUCER BEHAVIOUR AND SUPPLYBOOK - RADHA BHUGANACHAPTER - PRODUCER BEHAVIOUR AND SUPPLYEXERCISE - LET US RECAPITULATE
1 Videos
- SIMPLE APPLICATIONS OF TOOLS OF DEMAND AND SUPPLYBOOK - RADHA BHUGANACHAPTER - SIMPLE APPLICATIONS OF TOOLS OF DEMAND AND SUPPLYEXERCISE - Long answer
3 Videos
Similar Questions
Knowledge Check
Identify the following diagram
 AGlandular epitheliumBCiliated epitheliumCSquamous epitheliumDAreolar connective tissue
Identify the following diagram.
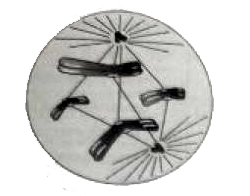 ATransition to Metaphase (Mitosis)BTransition to Anaphase-II (Meiosis)CTransition to Metaphase-I (Meiosis)DTransition to Anaphase (Mitosis)
Identify the following diagram -
 ATransition to Metaphase (mitosis)BTransition to Anaphase II (meiosis)CTransition to Metaphase-1 (meiosis).DTransition to Anaphase (mitosis)

